ELK vs CloudWatch - Choosing the Right Monitoring Tool

In today’s evolving cloud-native landscape, having a reliable monitoring and observability setup is essential for maintaining application health and performance. Two widely used solutions, Amazon CloudWatch and the ELK Stack (Elasticsearch, Logstash, and Kibana) offer powerful capabilities for log management, metrics, and alerting. But each serves different needs and environments.
In this guide, we will dive into a detailed comparison between ELK Stack and CloudWatch, exploring their core features, and how to decide which one aligns best with your infrastructure and operational goals.
Table of Contents:
- What is ELK?
- What is AWS CloudWatch?
- Why Compare ELK Stack and CloudWatch?
- Difference between ELK and CloudWatch
- When to Choose ELK Stack
- When to Choose AWS CloudWatch
- Atatus: A Great Alternative ELK and AWS CloudWatch
What is ELK?
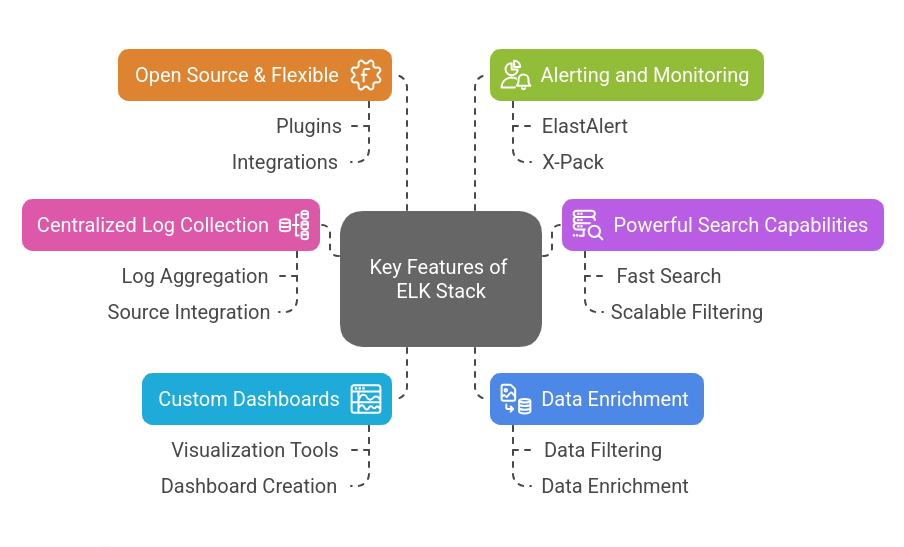
ELK stands for Elasticsearch, Logstash, and Kibana, a popular open-source stack used for log management, search, and visualization. It is widely used for monitoring, analyzing logs, and observability across applications and infrastructure.
Components of the ELK Stack
Elasticsearch: A distributed search and analytics engine that stores and indexes large volumes of log and event data. It enables fast querying and filtering across structured and unstructured data.
Logstash: A server-side data processing pipeline that collects logs from various sources, transforms and enriches the data, and forwards it to Elasticsearch for storage and analysis.
Kibana: A visualization and dashboard tool that connects to Elasticsearch and helps users explore data through interactive charts, graphs, and dashboards. It also supports log analysis, alerting, and reporting.
What is AWS CloudWatch?
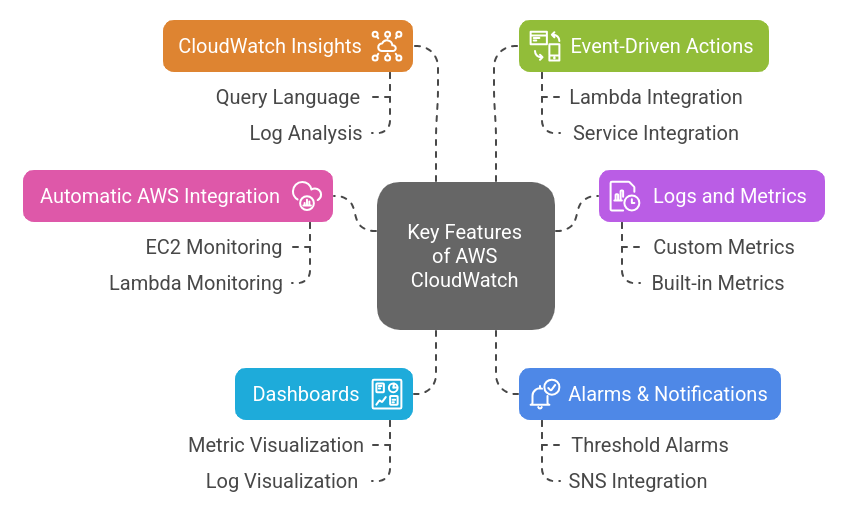
AWS CloudWatch is a fully managed monitoring and observability service from AWS. It is designed for developers, DevOps engineers, and IT managers to monitor AWS cloud resources and applications in real-time.
It automatically collects metrics, logs, and events from AWS services, enabling centralized visibility. CloudWatch also supports custom metrics and log ingestion from on-premises or hybrid environments, making it versatile for a wide range of monitoring needs.
Why Compare ELK Stack and CloudWatch?
Both ELK Stack and AWS CloudWatch are robust solutions for monitoring, logs monitoring, and observability, but they cater to different use cases and user expectations.
Understanding the differences between them can help you choose the tool that best matches your infrastructure setup, team capabilities, scaling requirements, and management preferences. Here’s why this comparison is important:
Cloud Adoption - ELK vs CloudWatch
As modern applications move toward distributed, containerized, and serverless models, visibility into performance becomes critical.
- CloudWatch is built to work effortlessly within AWS, providing a plug-and-play experience for teams already using AWS services.
- ELK Stack, on the other hand, shines when you need to monitor across diverse systems, including cloud, on-premises, and hybrid setups, where flexibility and customization are key.
Observability Standards - ELK vs CloudWatch
With microservices and third-party integrations, it’s common for logs and metrics to come from multiple sources.
- ELK lets you define exactly how data is parsed, filtered, and visualized, offering deep control and tailored observability.
- CloudWatch simplifies this process but operates under AWS-specific formats and limitations, which can create inconsistencies if you're pulling in logs from outside AWS.
Platform Dependence - ELK vs CloudWatch
Locking your observability into a single vendor like AWS can make future migration or expansion challenging.
- CloudWatch works great if you’re all-in on AWS, but extending it to other environments often requires workarounds or extra tools.
- In contrast, ELK is open source and can be hosted anywhere, giving you the long-term flexibility to adapt as your infrastructure evolves.
Performance Considerations - ELK vs CloudWatch
When it comes to handling large-scale log ingestion and real-time data processing, performance plays a key role in choosing the right tool.
- CloudWatch benefits from AWS’s managed infrastructure, offering reliable scalability and minimal setup time. It can handle high-throughput workloads without requiring manual performance tuning. However, there can be latency in log delivery and limitations on querying flexibility during peak loads.
- In contrast, ELK Stack offers fine-grained control over indexing, storage, and query performance. With the right tuning and scaling, ELK can deliver faster query results and real-time insights. But this comes at the cost of ongoing performance management, hardware provisioning, and potential downtime if not properly maintained.
Difference between ELK and CloudWatch
| Feature | ELK Stack | Amazon CloudWatch |
|---|---|---|
| Type | Open-source observability stack (self-hosted or managed) | Fully managed AWS-native monitoring service |
| Deployment | Self-managed (on-premises, cloud, or hosted by providers like Elastic Cloud) | Fully managed by AWS, no infrastructure to maintain |
| Log Management | Customizable log collection, parsing, and indexing with Logstash/Filebeat | Centralized logging with automatic ingestion from AWS services |
| Metrics Support | Metric collection through Beats or integrations; less native support | Built-in metrics for AWS services; supports custom and high-resolution metrics |
| Visualization | Powerful dashboards with Kibana; highly customizable | Integrated dashboards and CloudWatch Metrics Explorer |
| Alerting | Via Kibana or external tools like ElastAlert | Built-in alarm system with SNS integration |
| Integration | Integrates with various log shippers, third-party tools, and cloud platforms | Tight integration with AWS services only |
| Multi-cloud / Hybrid Support | Yes – ideal for hybrid and multi-cloud environments | Limited – optimized for AWS environments |
| Ease of Setup | Requires configuration and infrastructure setup | Quick setup, fully managed |
| Scalability | Scales well but needs manual tuning and resource planning | Automatically scales with AWS infrastructure |
| Cost | Lower cost if self-managed, but requires infrastructure and support | Pay-as-you-go model; can become expensive at scale |
| Vendor Lock-in | No – open source and vendor-neutral | Yes – tightly coupled with AWS ecosystem |
When to Choose ELK Stack
- You want full control over your log data, pipelines, and dashboards.
- You are operating in a multi-cloud or hybrid environment.
- You need custom parsing, enrichment, or advanced search capabilities.
- You want to avoid vendor lock-in and prefer an open-source, flexible solution.
- You have the resources to self-manage infrastructure or use a hosted ELK service.
When to Choose AWS CloudWatch
- You are fully or primarily using AWS services.
- You prefer a fully managed solution with minimal setup and maintenance.
- You need tight integration with AWS services like EC2, Lambda, ECS, etc.
- You want automatic metrics collection and built-in dashboards out of the box.
- You are okay with vendor lock-in and plan to stay within the AWS ecosystem.
Atatus: A Great Alternative ELK and AWS CloudWatch
If you're looking for an alternative to ELK Stack or CloudWatch that’s simpler to manage, easier to scale, and more cost-effective, Atatus stands out as a strong choice: Here is why,
- Atatus combines logs, metrics, traces, uptime monitoring, and real user monitoring in one platform, reducing the need for multiple tools unlike ELK Stack which requires separate components and configurations.
- It doesn’t tie you to any specific cloud provider, unlike CloudWatch which is tightly integrated with AWS, making Atatus more flexible for hybrid or multi-cloud environments.
- Setup is quick and hassle-free with Atatus, requiring no infrastructure management, while ELK demands ongoing maintenance of Elasticsearch, Logstash, and Kibana.
- Pricing with Atatus is predictable and transparent, which is a relief for teams used to CloudWatch’s pay-per-ingestion and retention model or the hidden costs of self-hosting ELK.
- The user interface in Atatus is simple and modern, allowing even non-technical users to navigate and monitor effectively, whereas ELK and CloudWatch often require deep familiarity to use efficiently.
- Atatus supports alerting, custom dashboards, and integrations with tools like Slack and PagerDuty out of the box, while setting up similar workflows in ELK requires plugins and extra effort, and CloudWatch’s integrations are largely AWS-specific.
- You can instrument your applications quickly with Atatus using lightweight agents or open standards like OpenTelemetry, providing flexibility for teams that want to avoid vendor lock-in or complex SDKs.
Try Before You Decide – Experience Atatus with a free trial and see the difference today!
#1 Solution for Logs, Traces & Metrics
![]() APM
APM
![]() Kubernetes
Kubernetes
![]() Logs
Logs
![]() Synthetics
Synthetics
![]() RUM
RUM
![]() Serverless
Serverless
![]() Security
Security
![]() More
More