Dynatrace vs Prometheus - A Detailed Comparison for 2025
When it comes to monitoring solutions, Dynatrace and Prometheus are two powerful tools that cater to different use cases. While Dynatrace is a comprehensive observability platform Prometheus is an open-source monitoring tool designed for scalability and flexibility. But which one should you choose? This detailed Dynatrace vs. Prometheus comparison will help you make an informed decision by evaluating key aspects such as data collection, alerting, integrations, scalability, and pricing.
Table of Contents:
- Dynatrace vs Prometheus: An Overview
- Data Collection and Processing
- Log Management
- Data Visualization
- Alerting
- Scalability and Performance
- Deployment and Integrations
- Ease of Use and Learning Curve
- Documentation
- Dynatrace vs Prometheus: Pricing
- Dynatrace vs Prometheus: When to Choose?
- Why choose Atatus over Dynatrace and Prometheus?
Dynatrace vs Prometheus: An Overview
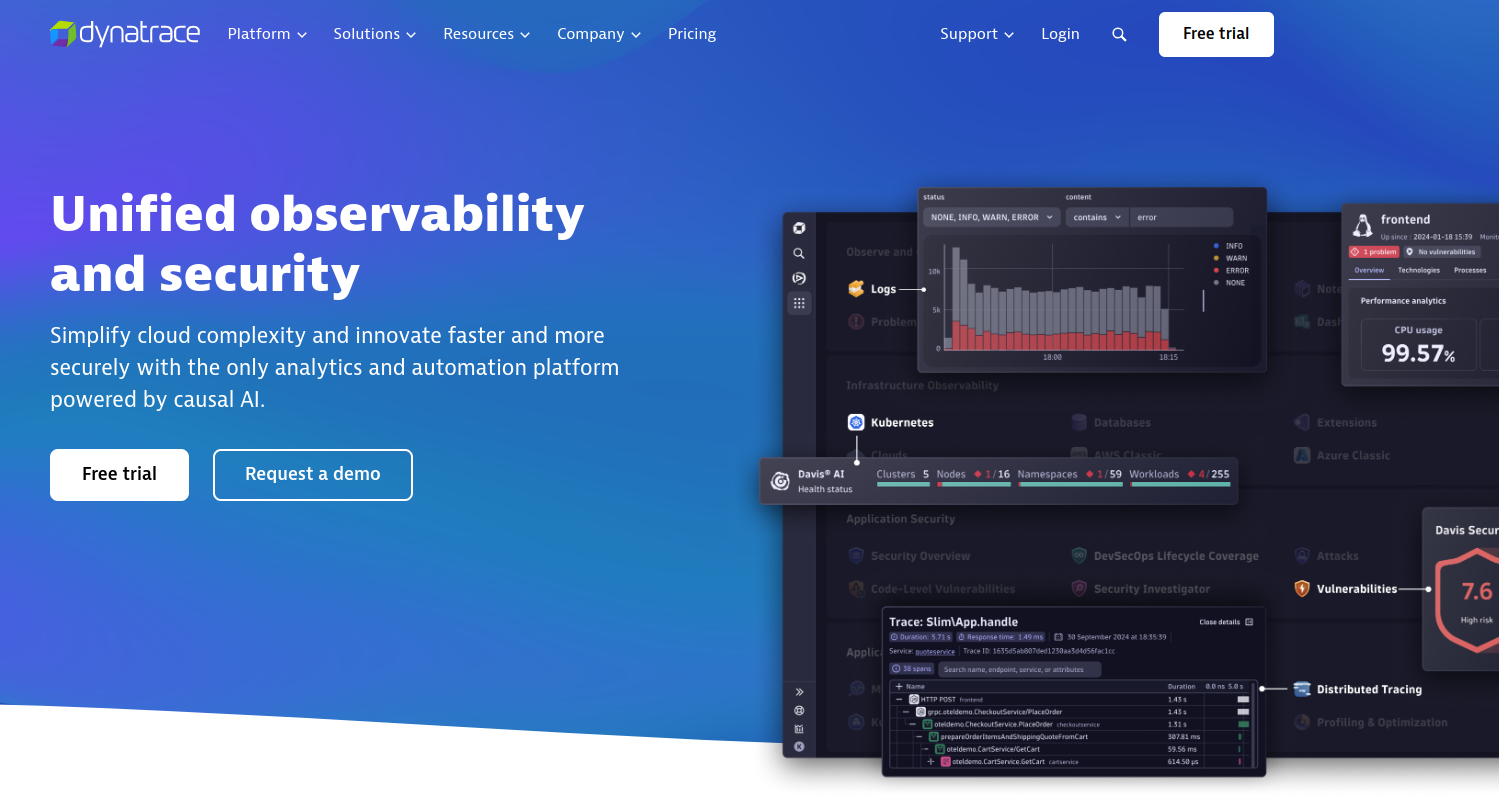
Dynatrace
Dynatrace is an AI-driven observability platform that provides end-to-end monitoring for applications, infrastructure, and user experience. It automates anomaly detection and root cause analysis, making it a preferred choice for enterprises that require an all-in-one solution.
Key Features of Dynatrace:
- Full-stack observability with AI-driven insights
- Automated anomaly detection
- Real-time monitoring and distributed tracing
- Support for cloud-native, hybrid, and on-premises environments
- Advanced visualization dashboards
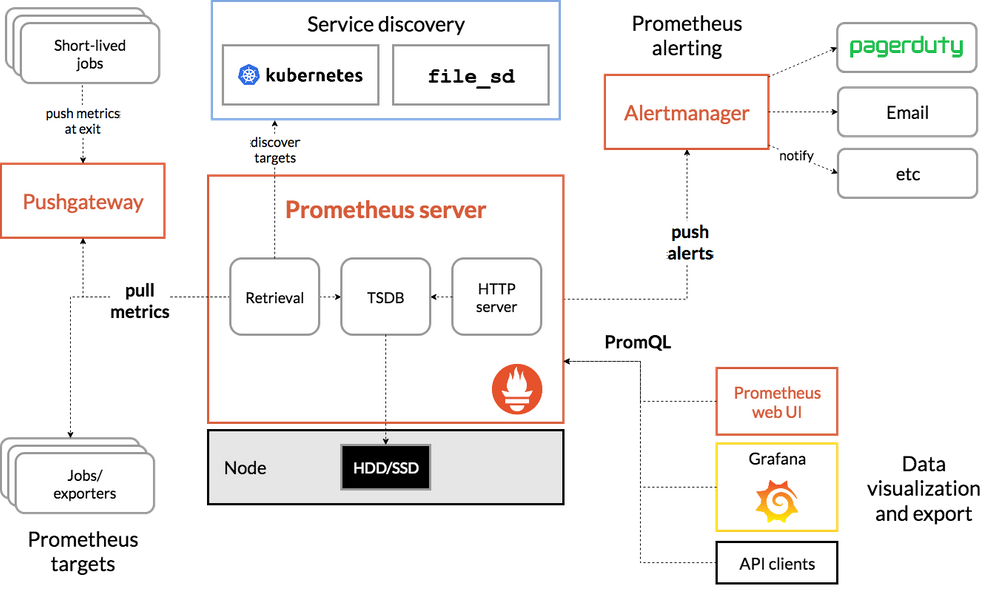
Prometheus
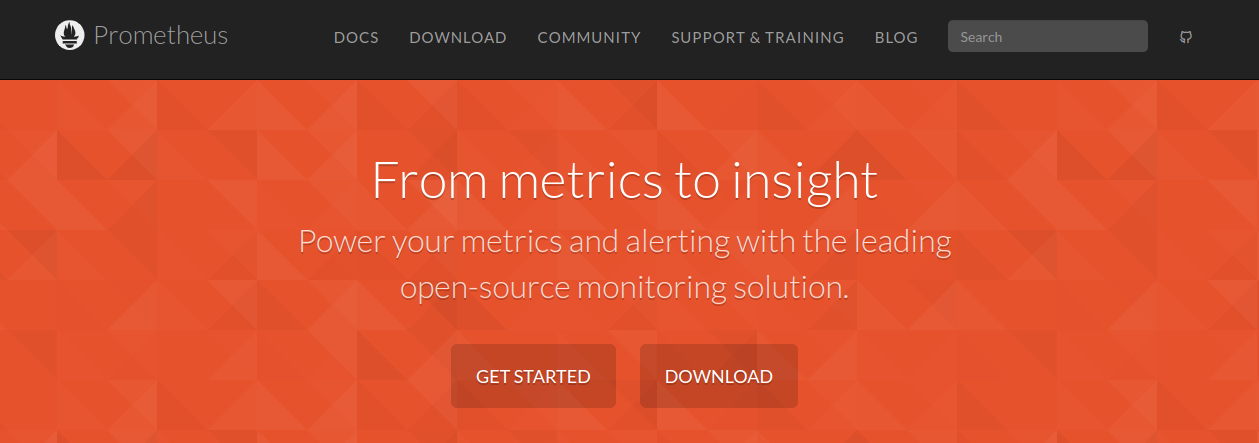
Prometheus is an open-source monitoring and alerting system primarily used for time-series data collection. It is widely used for monitoring Kubernetes environments and integrates seamlessly with Grafana for visualization.
Key Features of Prometheus:
- Open-source and highly scalable
- Pull-based metrics collection via HTTP endpoints
- Powerful querying with PromQL
- Alerting support via Alertmanager
- Integration with Grafana for visualization
Data Collection and Processing
Dynatrace
Dynatrace uses agents installed on servers, containers, and mobile devices to collect data. The platform leverages AI-powered processing to generate actionable insights in real time. It also provides distributed tracing capabilities, ensuring complete visibility into transactions.
Prometheus
Prometheus follows a pull-based data collection approach, where it scrapes metrics from instrumented applications, network devices, and exporters. It stores time-series data efficiently, making it a preferred choice for metric-based monitoring.
If you require deep, AI-driven insights with automated tracing, Dynatrace is the better choice. However, if you need a lightweight, open-source solution for time-series monitoring, Prometheus excels.
Log Management
Dynatrace
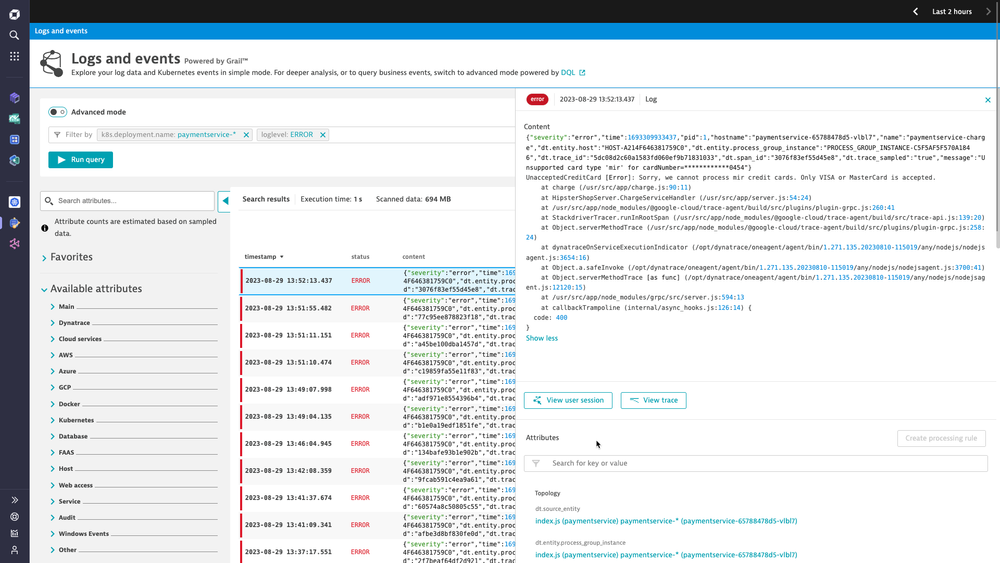
Log management in Dynatrace is powered by Grail, offering comprehensive built-in capabilities for log collection, storage, searching, and analysis. It automatically ingests logs from multiple sources, correlates them with metrics and traces, and provides AI-powered anomaly detection for faster troubleshooting. With centralized log storage and real-time search, Dynatrace enables efficient log monitoring without needing external integrations.
Prometheus
Prometheus, being a metrics-first monitoring tool, does not natively support log management. It excels at collecting and querying time-series data but lacks built-in capabilities for storing, searching, or visualizing logs. To manage logs effectively, Prometheus requires integration with external tools.
If you need built-in log management with advanced insights, Dynatrace is a better option. However, if you are comfortable integrating Prometheus with external log aggregation tools, you can still achieve a customized log management setup.
Data Visualization
Dynatrace
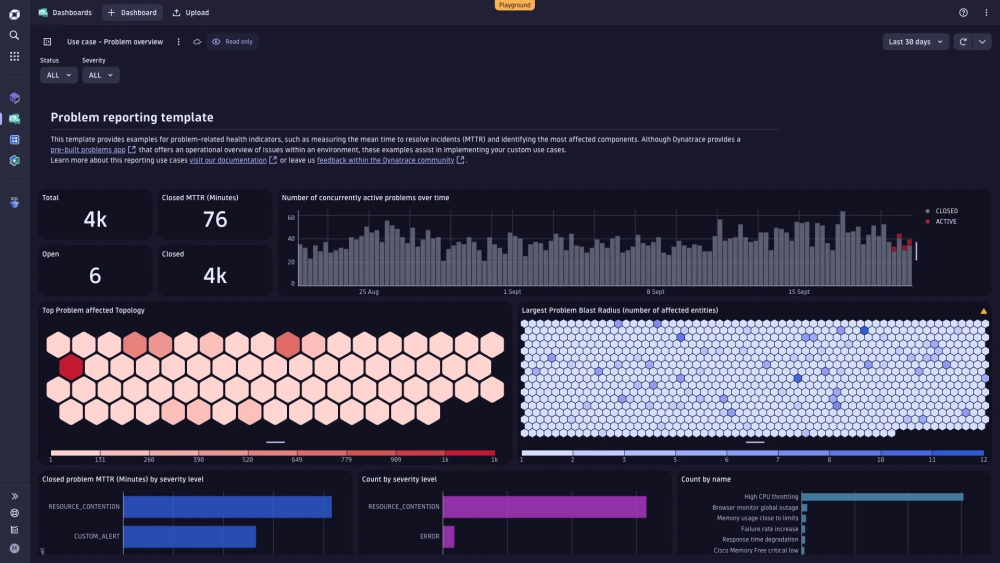
Dynatrace features built-in dashboards with powerful visualization tools. Users can customize dashboards with various charts, graphs, and reports to track real-time performance data. It automatically correlates metrics, traces, and logs, making it easier to analyze system health.
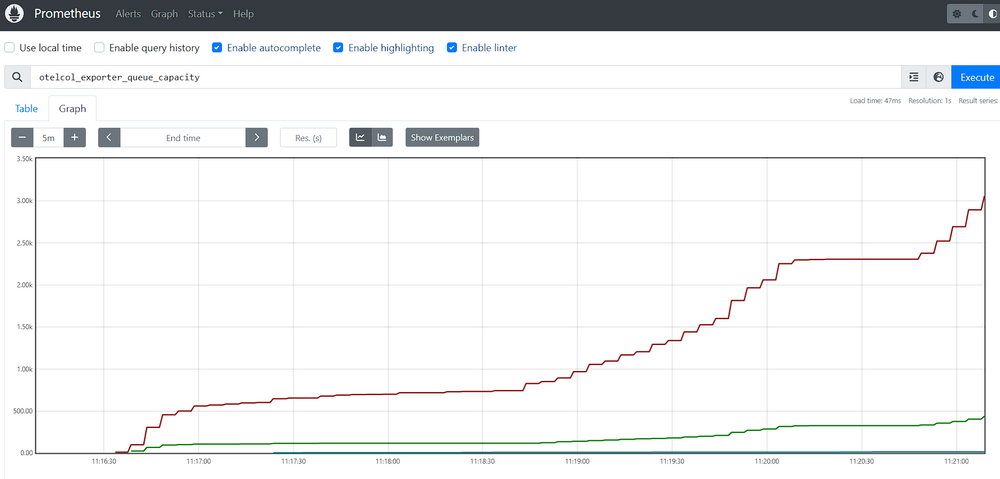
Prometheus
Prometheus lacks native visualization but integrates seamlessly with Grafana, a widely used open-source visualization tool. Grafana enables users to create dynamic dashboards with Prometheus data, providing deep insights into system performance. However, setting up dashboards requires manual configuration and knowledge of PromQL for query-based visualizations.
Dynatrace provides ready-made, AI-enhanced visualizations, whereas Prometheus depends on Grafana for visualization, requiring additional setup and expertise.
Alerting
Dynatrace
Dynatrace provides an advanced AI-powered alerting system that automatically detects anomalies and performance issues. It reduces false positives by analyzing historical trends and dependencies. Users can configure alerts for various metrics, and the system integrates with multiple notification channels like Slack, PagerDuty, and email for seamless incident response.
Prometheus
Prometheus relies on Alertmanager for handling alerts. Users need to define alerting rules using PromQL, making it more customizable but requiring manual setup. Alerts can be grouped, silenced, and routed based on labels, providing flexibility in managing incidents. However, unlike Dynatrace, it lacks built-in anomaly detection and AI-driven insights.
Dynatrace offers automated, intelligent alerting, whereas Prometheus requires manual configurations but provides more flexibility.
Scalability and Performance
Dynatrace
Dynatrace is designed to scale automatically, making it suitable for enterprises with thousands of hosts. It supports cloud-native, hybrid, and multi-cloud environments, ensuring smooth performance across infrastructures.
Prometheus
Prometheus is horizontally scalable but requires additional components for long-term storage and high availability.
If you need enterprise-grade scalability with automation, Dynatrace is the better choice. However, for scalable time-series data collection with an open-source approach, Prometheus works well.
Deployment and Integrations
Dynatrace
- Supports on-premises, cloud, and hybrid deployments
- Integrates with AWS, Azure, Google Cloud, Kubernetes, and OpenTelemetry
- Offers built-in DevOps and ITSM integrations
Prometheus
- Typically deployed in self-hosted environments
- Integrates with Grafana, Kubernetes, and various exporters
- Requires third-party tools for full observability
Dynatrace offers seamless cloud integration, whereas Prometheus is ideal for Kubernetes monitoring but requires additional tools for broader observability.
Ease of Use and Learning Curve
Dynatrace
- User-friendly UI with AI-powered automation
- Requires minimal configuration
- Suitable for both beginners and experienced users
Prometheus
- Requires manual setup and configuration
- Learning curve for PromQL and Alertmanager
- Best suited for experienced DevOps teams
Dynatrace is easier to set up and use, whereas Prometheus requires technical expertise for configuration and management.
Documentation
Dynatrace
Dynatrace provides extensive documentation, but it can be complex and difficult to navigate, requiring users to go through multiple documents for clarity.
Prometheus
Prometheus documentation is not as extensive as Dynatrace's, new users might find it challenging to set up and optimize configurations due to limited structured guides.
Dynatrace vs Prometheus: Pricing
Dynatrace
Dynatrace follows a usage-based pricing model depending on host units, data ingestion, and retention policies. While it provides advanced features, the pricing is significantly high, making it an expensive choice, especially for small to mid-sized businesses. Organizations must carefully evaluate their budget before opting for Dynatrace.
Prometheus
Prometheus is completely free and open-source. However, organizations must consider infrastructure costs, maintenance, and scalability expenses when deploying Prometheus at scale.
Why pay more for monitoring? With Atatus, you get the same powerful insights as Dynatrace and Prometheus at 4x lower costs—with free support included. No complicated pricing, no hidden fees—just seamless observability for your entire team. Make the switch today and start saving!
Dynatrace vs Prometheus: When to Choose?
Choose Dynatrace if:
- You need a fully automated, AI-driven observability platform
- You want end-to-end monitoring across cloud, hybrid, and on-premises environments
- You require built-in alerting and visualisation
- Budget is not a major constraint
Choose Prometheus if:
- You prefer an open-source monitoring solution
- You primarily monitor Kubernetes and cloud-native workloads
- You have a team with expertise in Prometheus setup and query language
- You are comfortable integrating multiple tools for full observability
Why choose Atatus over Dynatrace and Prometheus?
Atatus offers a cost-effective, user-friendly, and fully managed monitoring solution, making it a strong alternative to Dynatrace and alternative to Prometheus.
Here is why Atatus is the better choice:
- Quick & Simple Setup: Dynatrace requires complex configurations, and Prometheus demands manual setup and integrations. Atatus, on the other hand, offers a hassle-free onboarding process, allowing teams to start monitoring within minutes.
- Affordable & Transparent Pricing: Dynatrace’s pricing can be expensive, especially for growing teams. While Prometheus is free, maintaining and scaling it comes with hidden infrastructure and management costs. Atatus provides clear, budget-friendly pricing without compromising on features.
- Built-In Visualization & Alerting: Unlike Prometheus, which relies on external tools like Grafana for visualization, Atatus offers real-time dashboards and built-in alerting, eliminating the need for additional configurations.
- No Maintenance Overhead: Prometheus requires continuous management for long-term data storage and high availability. Atatus is a fully managed solution, ensuring reliability without additional operational efforts.
- Easy-to-Understand Documentation & Support: Dynatrace’s documentation can be complex, while Prometheus lacks detailed guidance for new users. Atatus offers clear, concise documentation and dedicated support, ensuring a smooth user experience.
If you are looking for a cost-effective monitoring solution, Atatus is the best alternative to Dynatrace and Prometheus. You can enjoy the same features of both tools in one place, without the complexity, at an affordable price. Try Before You Decide – Experience Atatus with a free trial and see the difference today!
#1 Solution for Logs, Traces & Metrics
![]() APM
APM
![]() Kubernetes
Kubernetes
![]() Logs
Logs
![]() Synthetics
Synthetics
![]() RUM
RUM
![]() Serverless
Serverless
![]() Security
Security
![]() More
More


![Splunk vs Prometheus: A Side-by-Side Comparison [2025 Guide]](/blog/content/images/size/w960/2024/08/Datadog-vs-sentry--13-.png)