Dynatrace vs Grafana - A Detailed Comparison for 2025
Dynatrace and Grafana are popular tools when it comes to monitoring and observability. In this post, I have compared Dynatrace and Grafana on important features like APM, log management, infrastructure monitoring, pricing, etc.
Table of Contents:
- Dynatrace vs Grafana: An Overview
- Getting Started
- APM: Dynatrace
- Log Management: Dynatrace
- Infrastructure Monitoring: Dynatrace
- Visualization: Grafana
- UI/UX: Grafana
- Pricing: Grafana
- Dynatrace vs Grafana: Final Verdict
- A better Dynatrace and Grafana Alternative: Atatus
Dynatrace vs Grafana: An Overview
Dynatrace and Grafana are two well-known observability tools, but they serve different purposes and cater to different user needs.
Dynatrace, is primarily a full-stack observability platform with AI-driven automation. It provides automatic application performance monitoring (APM), log management, infrastructure monitoring, and security analysis, making it a comprehensive solution for enterprises
Grafana, on the other hand, is a visualization tool, allowing users to create custom dashboards for monitoring metrics from various data sources. When combined with Prometheus, Loki, and Tempo, it forms a powerful observability stack. However, it requires manual setup and integrations.
Here’s a quick comparison of Dynatrace and Grafana based on key features and functionality:
| Features | Grafana | Dynatrace |
|---|---|---|
| APM (Application Performance Monitoring) | ✅ | ✅ |
| Log Management | 🟡 | ✅ |
| Infrastructure Monitoring | 🟡 | ✅ |
| Visualization | ✅ | ✅ |
| OpenTelemetry Support | ✅ | ✅ |
| Incident Response & Management | 🟡 | ✅ |
| Application Security | ❌ | ✅ |
| Free Tier | ✅ | ✅ |
✅ - Available ❌ - Not Available 🟡 - Limited
Getting Started
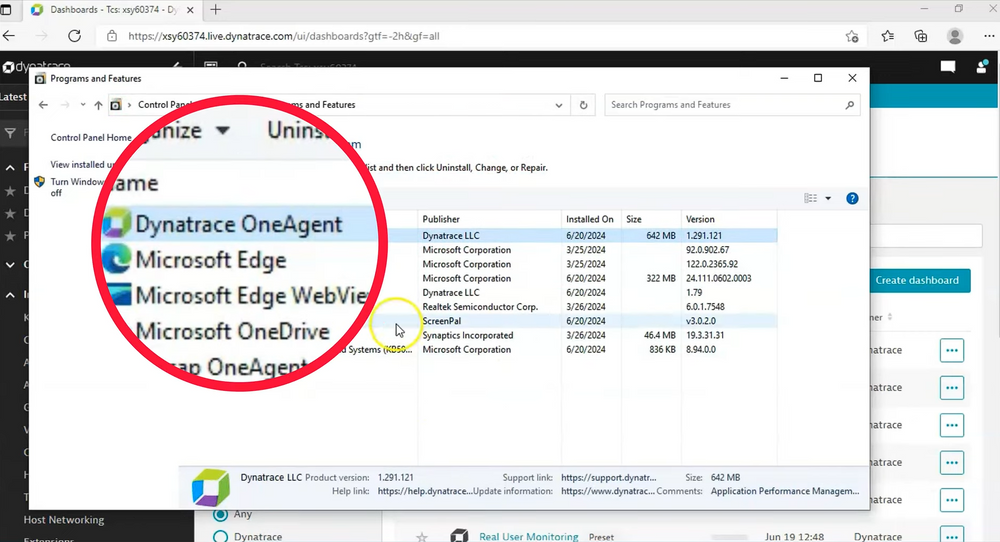
With Dynatrace, installing OneAgent enabled automatic data collection within minutes, with AI-driven automation handling most of the setup and requiring minimal manual effort.
In contrast, Grafana required integration with tools to gather metrics and manual dashboard configuration, which took more effort but allowed for greater customization in visualization.
APM: Dynatrace
To evaluate the APM feature in Grafana and Dynatrace, I sent data from a sample application to both platforms. While the APM setup was straightforward on both, Grafana required a few extra steps.
Grafana
Grafana Cloud uses its Application Observability solution to monitor application performance and detect anomalies. This helped me identify request failures in my application and analyse the root cause.
Dynatrace
With Dynatrace, I initially found the APM setup confusing since it’s not immediately visible in the user interface. After checking the Dynatrace documentation, I learned that you can either instrument your application with OpenTelemetry or use the OneAgent SDK, which works alongside Dynatrace OneAgent. However, the OneAgent SDK requires code modifications, which may not be ideal for everyone.
The best part about Dynatrace APM is its AI-powered automatic problem detection and resolution. It continuously monitors application performance, detects anomalies, and identifies the root cause of issues without manual effort.
Both Grafana and Dynatrace provide APM capabilities, but they serve different purposes. If you are looking for in-depth insights with minimal effort, Dynatrace is the better choice.
Log Management: Dynatrace
Grafana
Grafana uses Loki, a log aggregation tool designed to store and query logs from your applications and infrastructure. Unlike traditional log management systems that index entire logs, Loki only indexes metadata (labels) and stores the compressed logs in object storage (e.g., S3).
This approach, coupled with smaller indexes, helps keep Loki cost-effective while still providing powerful features like live tailing and the ability to build metrics and generate alerts from logs.
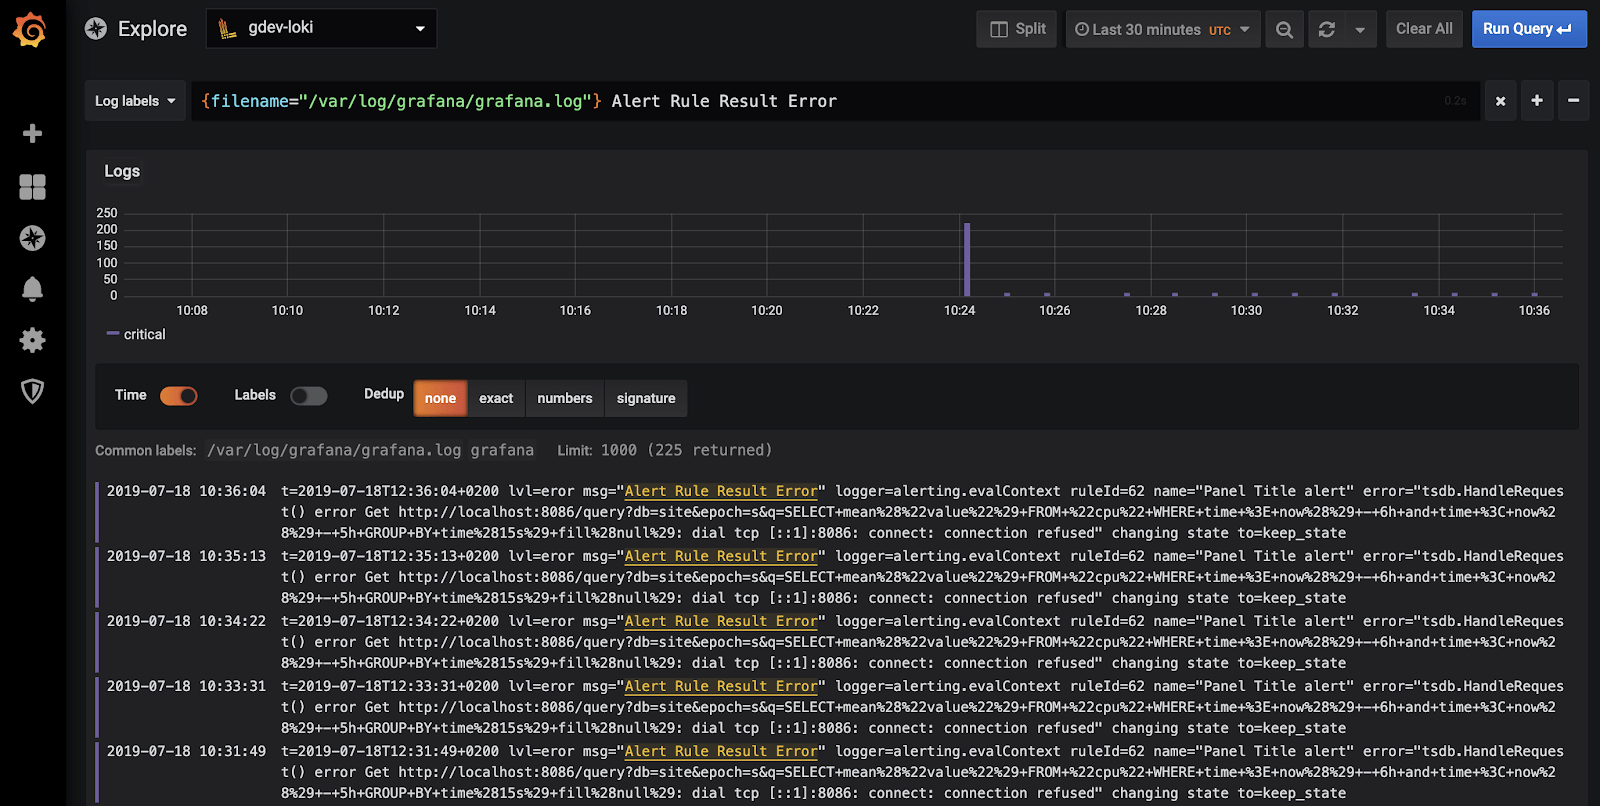
What is great about Loki is that it can ingest logs without needing any specific formatting, making it a flexible choice for various environments.
Dynatrace
On the other hand, Dynatrace uses Grail for log management, which is designed to handle log data in a more schema-less way. Grail allows users to store massive amounts of log data (even in petabytes) without requiring traditional indexing. Once OneAgent is deployed, it seamlessly ingests logs into the Dynatrace platform.
Users have the flexibility to define custom ingestion rules and manage log retention according to specific business or compliance requirements. This makes Dynatrace's log management particularly useful for scenarios like debugging or auditing, where the ability to store and query logs over long periods is essential.
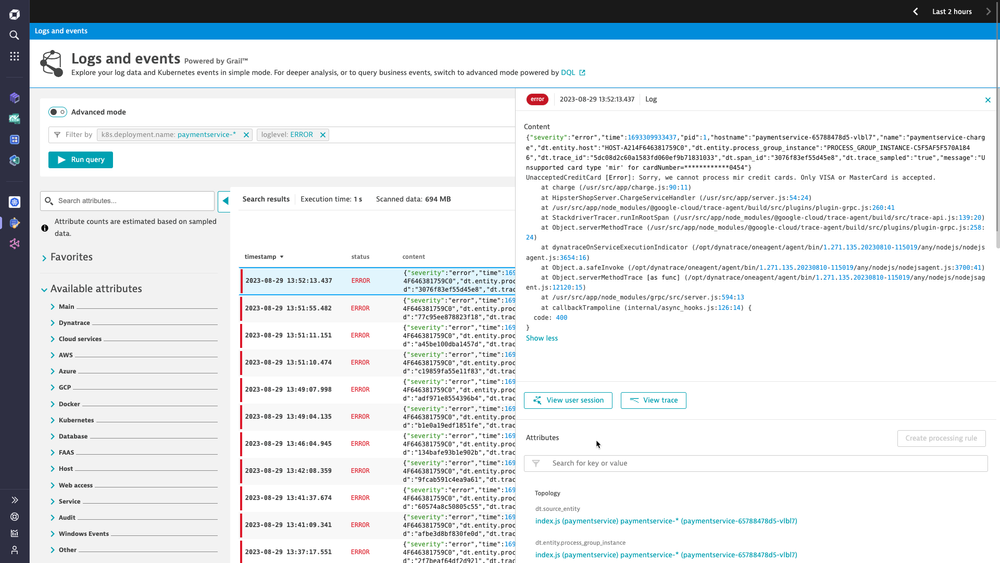
For log aggregation, scalability, and cost-effectiveness, Grafana Loki is a good choice. For AI-driven insights and seamless integration, Dynatrace excels.
Infrastructure Monitoring: Dynatrace
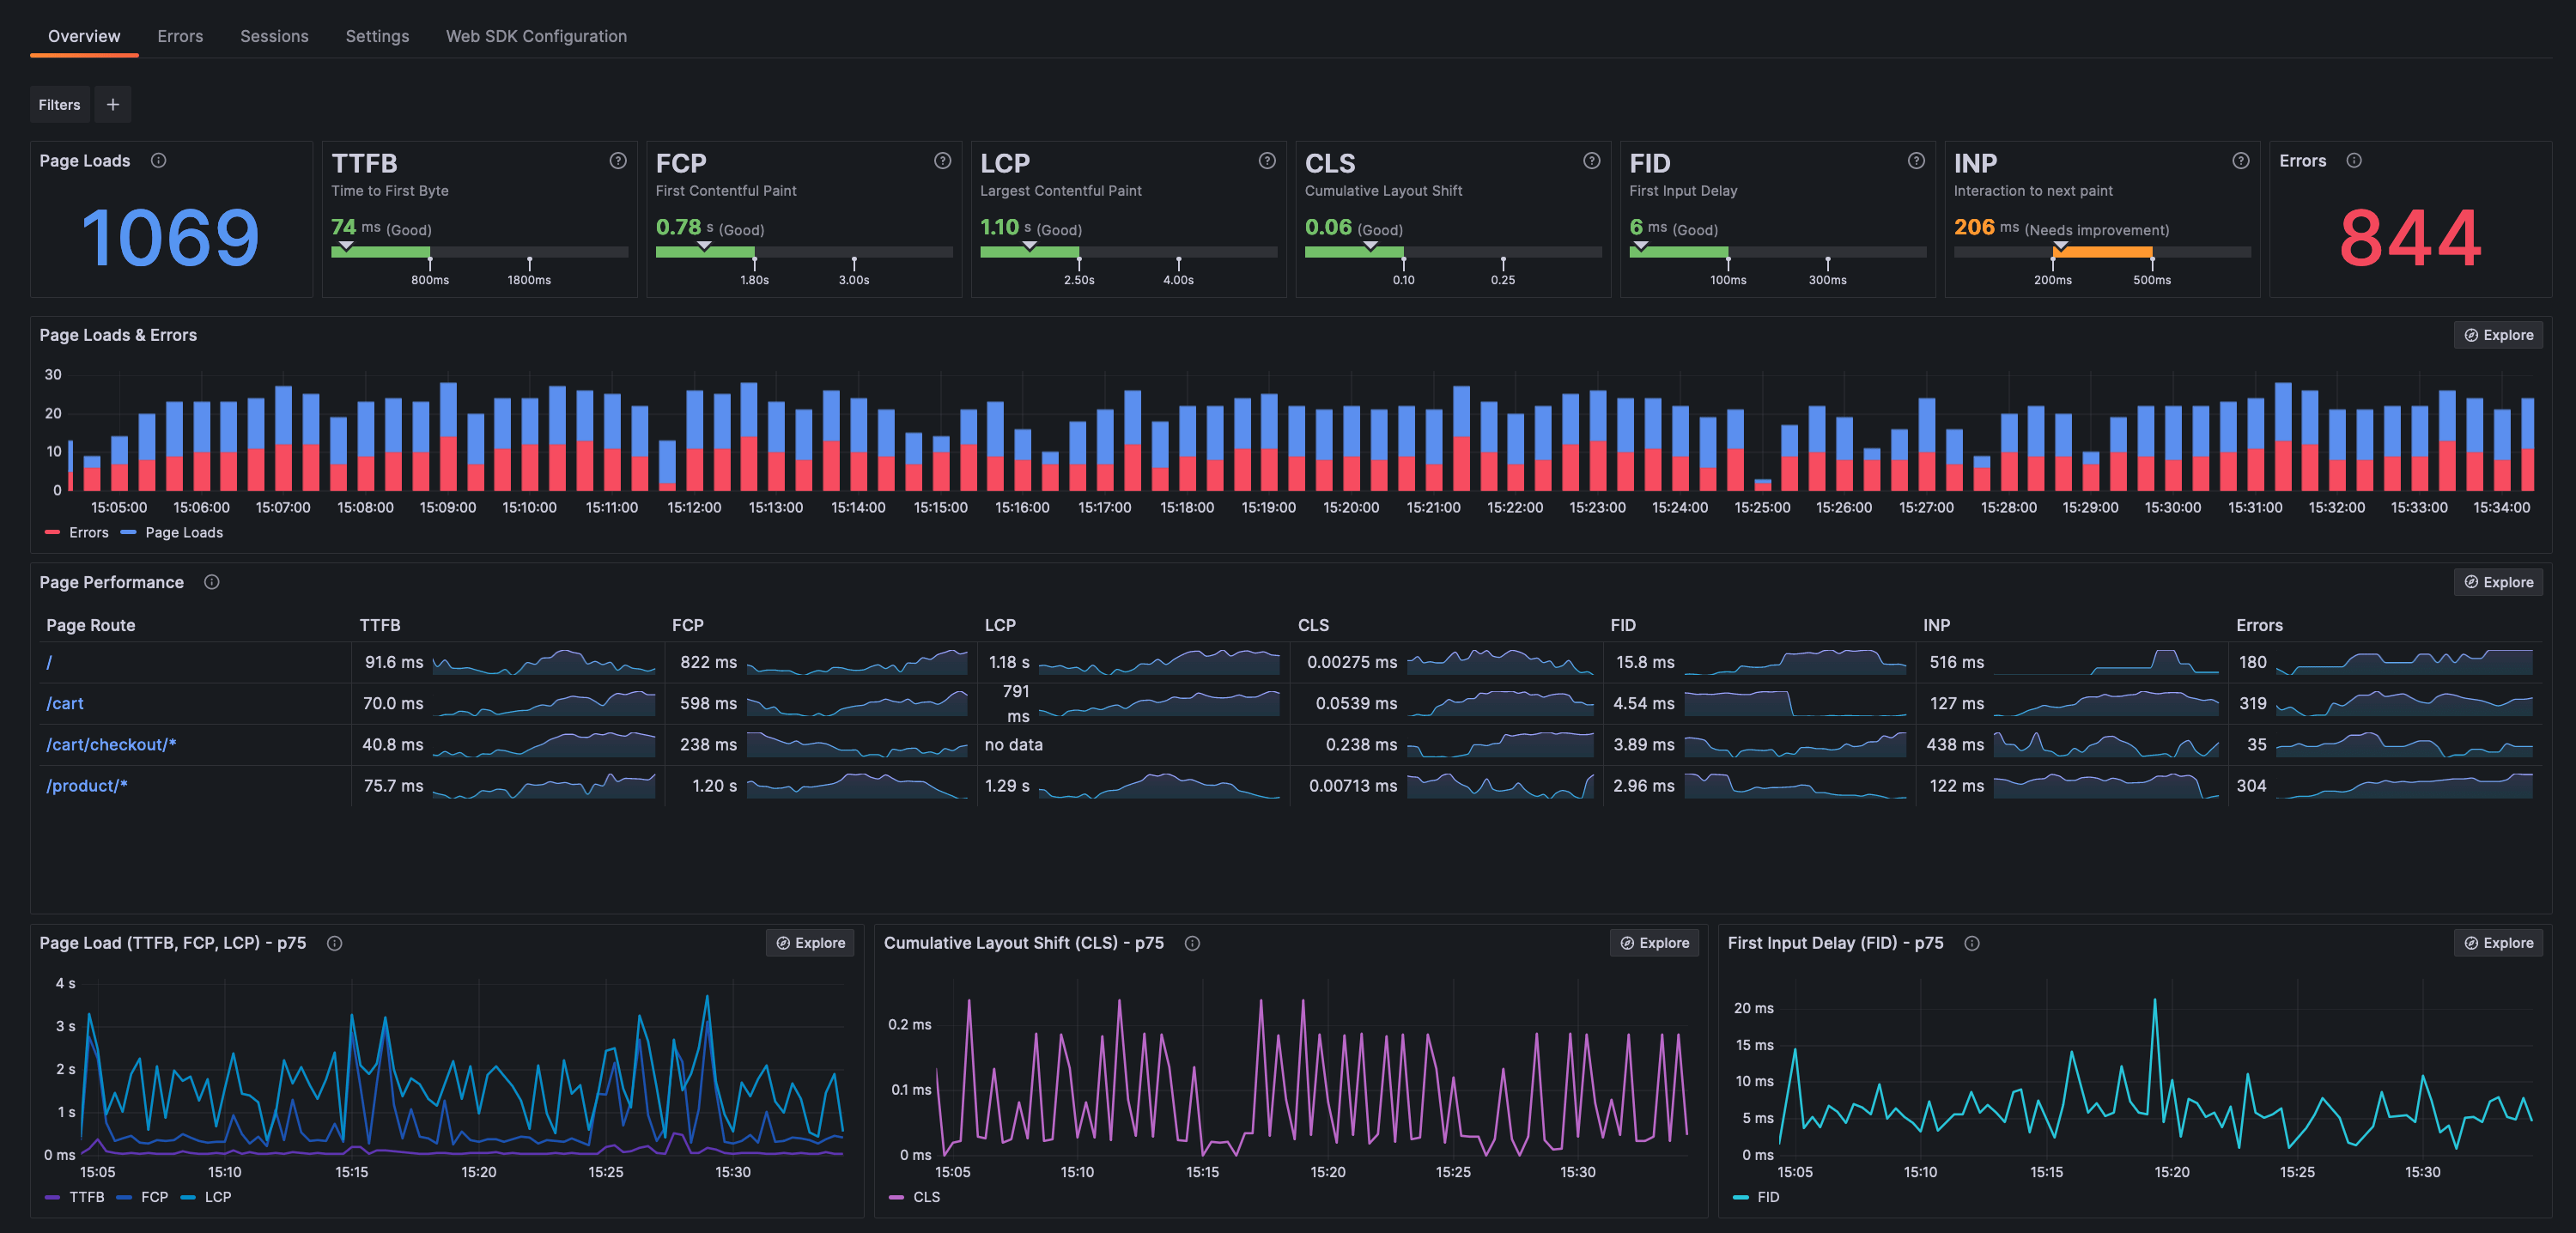
Grafana Cloud provides infrastructure monitoring for various environments like AWS, Kubernetes, and other integrations such as Linux machines, databases, and applications. With a managed Grafana instance, it offers integrations with diverse data sources, robust visualization tools, and alerting capabilities.
This made it easy for me to focus on monitoring my infrastructure without worrying about managing the backend. I was also able to build customized dashboards to track specific infrastructure metrics.
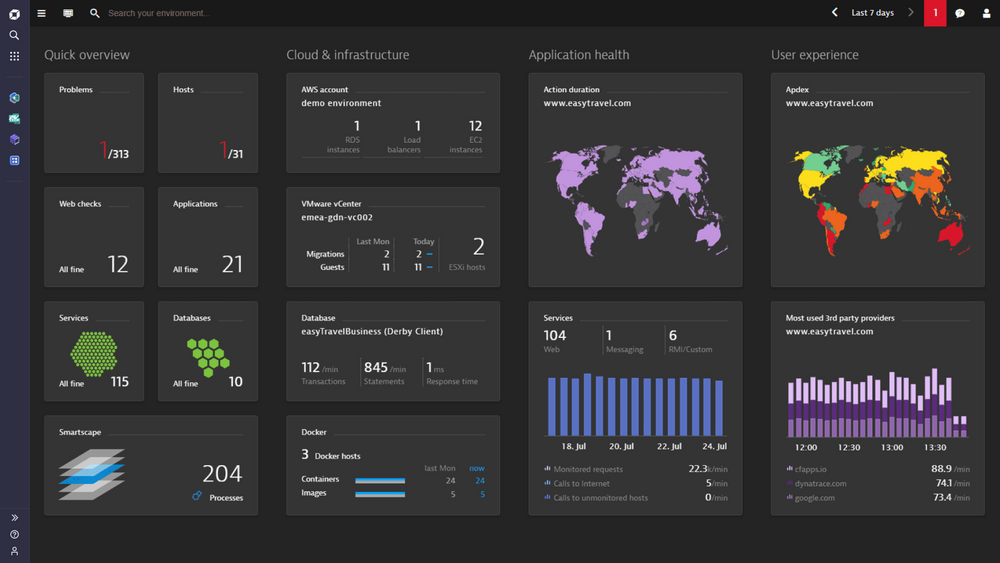
On the other hand, Dynatrace offers a single unified view of infrastructure metrics. As I navigated through the platform, I could easily access all the key performance indicators I needed, including outgoing connections, host performance, process analysis, disk usage, and more.
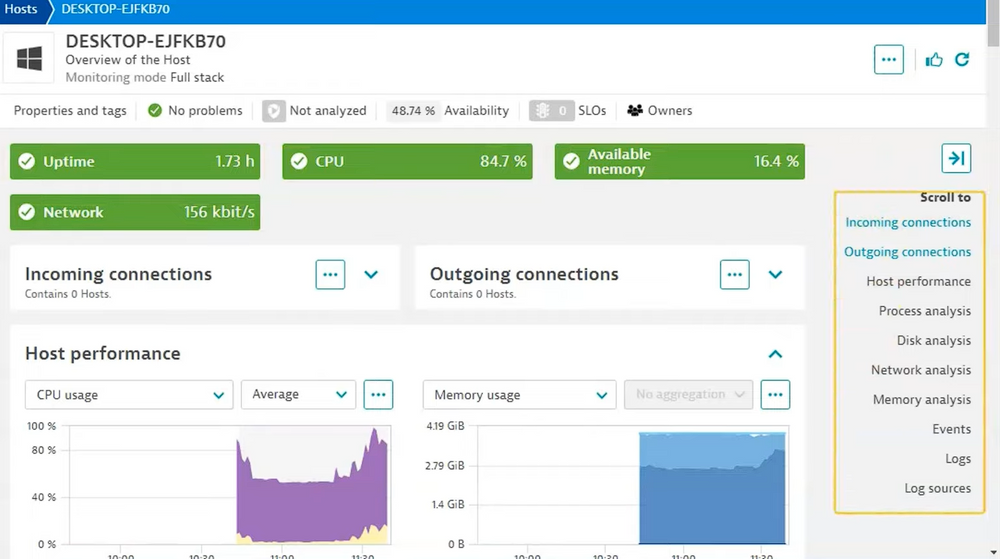
The Host performance analysis provides detailed information on CPU usage, memory usage, traffic, and disk throughput. Depending on needs, additional information such as swap usage, disk latency, and disk space usage can also be accessed.
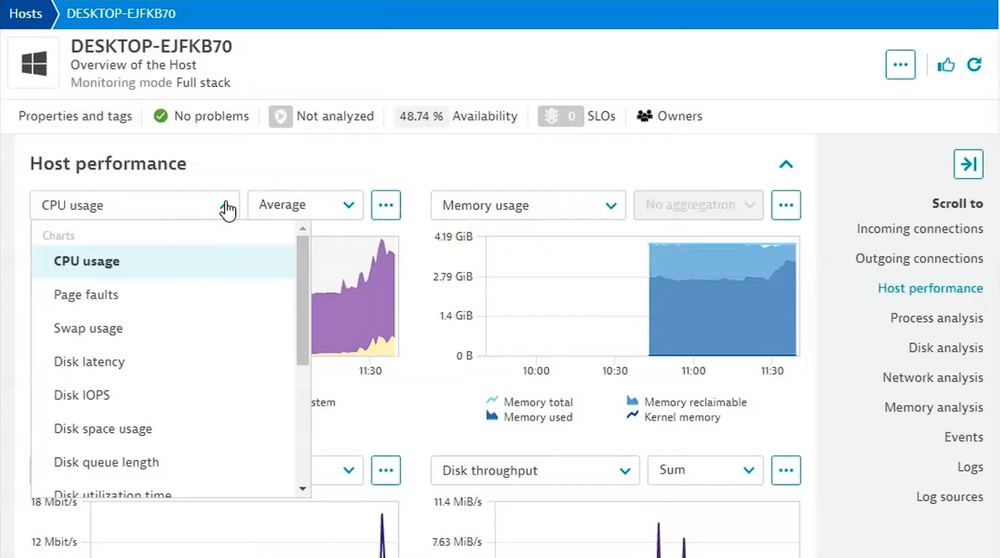
This in-depth details helped me better understand my system’s performance and made it easier to make decisions about resource optimization and management.
Dynatrace is the better choice for detailed infrastructure monitoring with automated insights and easy access to key metrics.
Visualization: Grafana
Grafana is known for its excellent visualization capabilities. It offers a wide range of visualizations, including time series graphs, pie chart, bar charts, heat maps, and more.
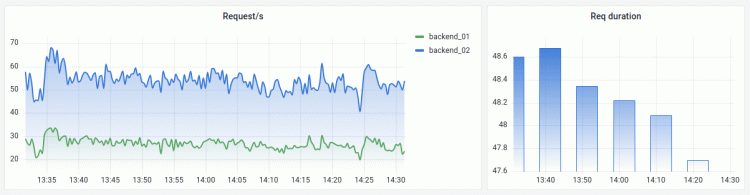
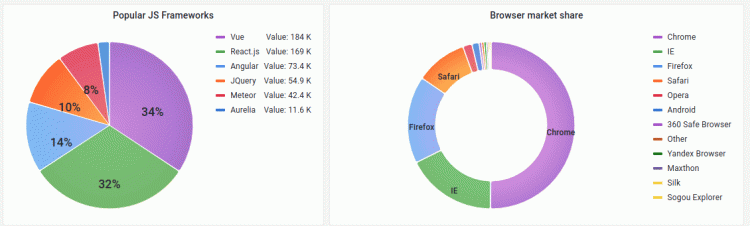
It is highly customizable, allowing users to adjust panels and metrics. Grafana also suggests visualization types based on your data, making it easier to choose the best representation. It is ideal for those who value flexibility and customization.
Dynatrace provides good visualizations for monitoring application and infrastructure performance. It focuses on clear, comprehensive views of real-time and historical data but offers less customization than Grafana.
When comparing Dynatrace vs Grafana in terms of visualization capabilities, Grafana is the preferred choice for users seeking versatile visualizations.
UI/UX: Grafana
I found Dynatrace’s user interface to be difficult to use, as it lacked clarity and wasn’t intuitive. Navigating the platform often required checking the documentation, which made the overall experience less enjoyable.
In contrast, Grafana provides a visually appealing and powerful UI, especially when compared to Prometheus. Its interface is user-friendly and designed for easy navigation and interaction.
Grafana offer great visualization capabilities. If you need more customization or want to visualize data from multiple sources, choose Grafana.
Pricing: Grafana
Grafana, as an open-source platform, is free to use. It also offers a cloud version and an enterprise version to meet different user needs. The Grafana Cloud edition includes a free forever plan, while the enterprise version comes with a 14-day free trial.
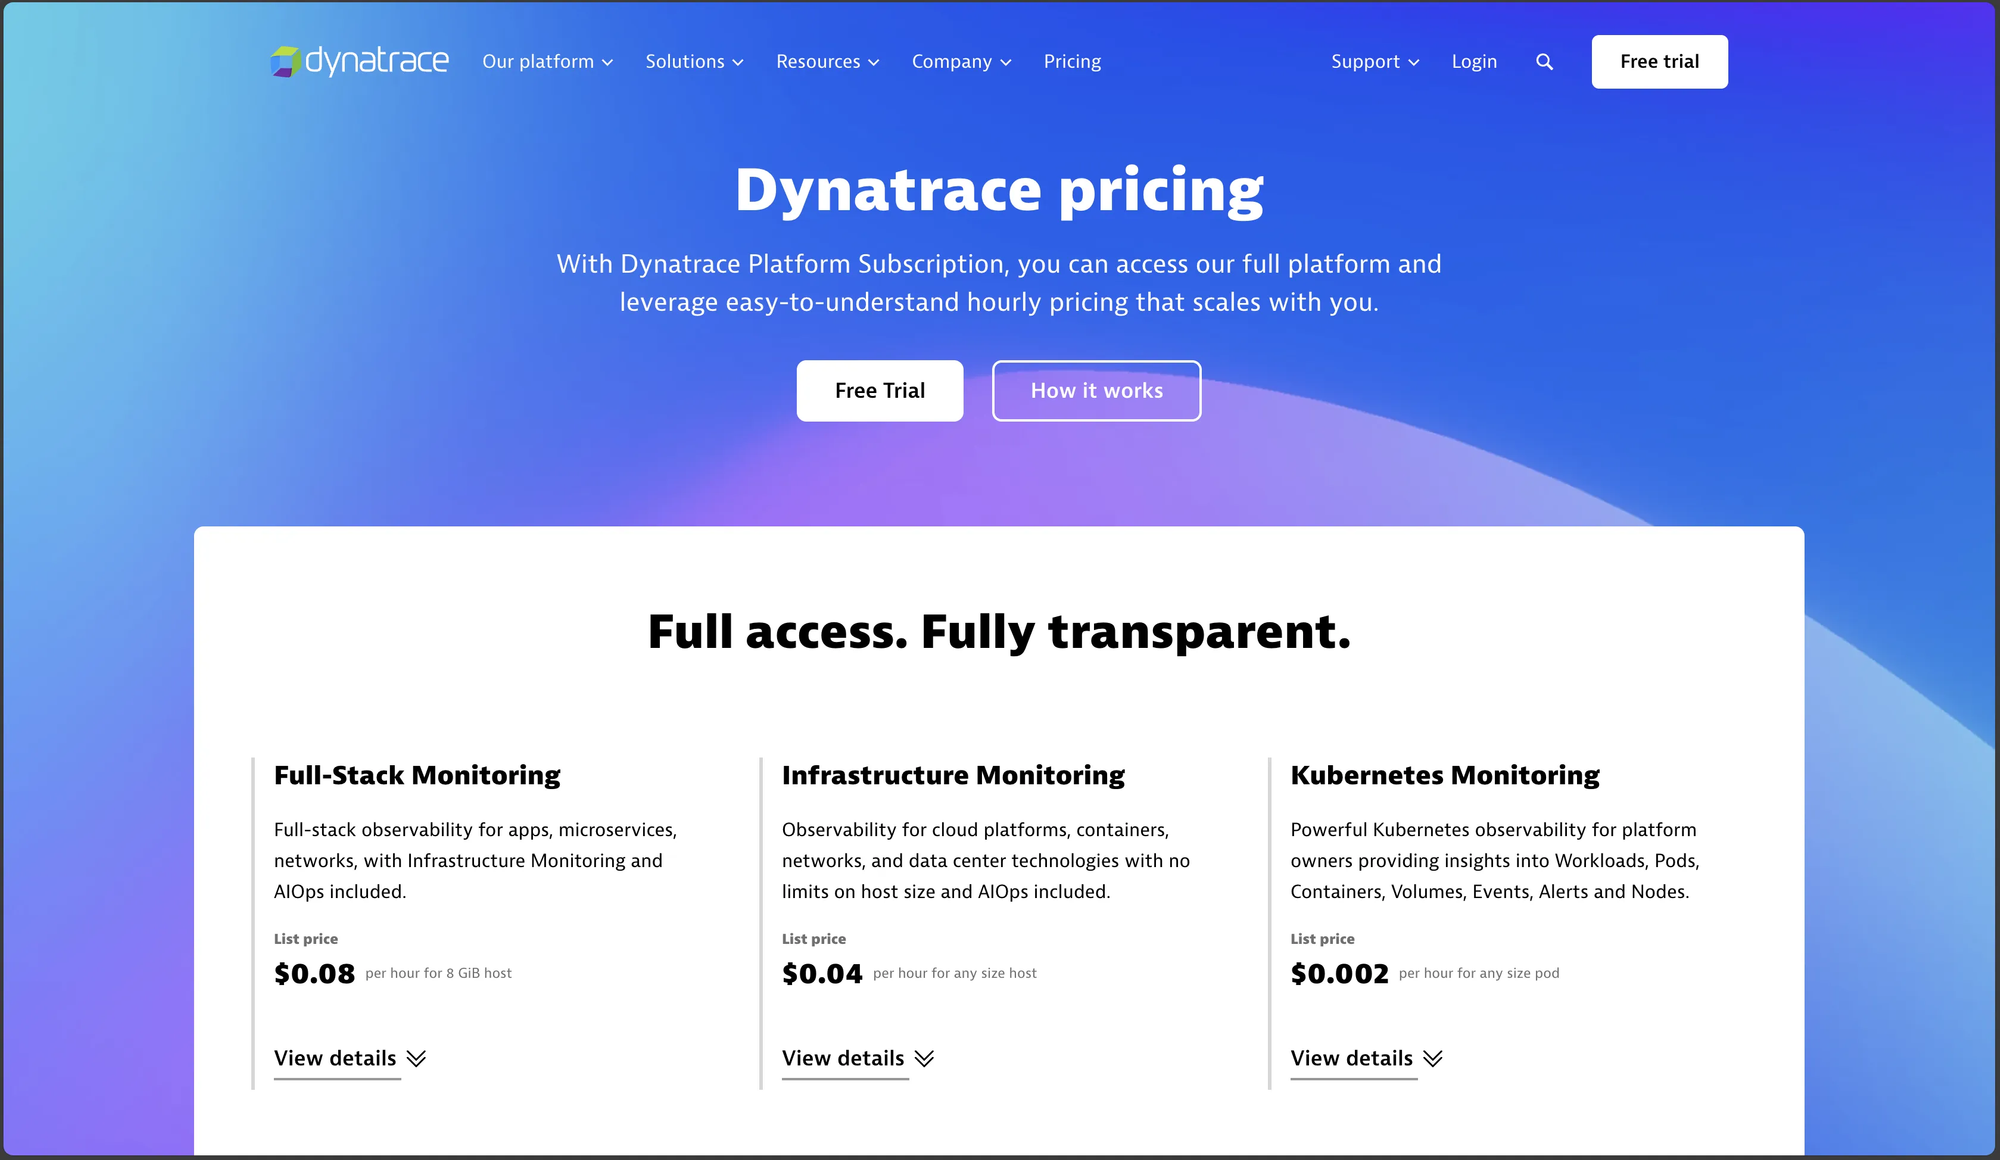
Dynatrace follows a pricing model that varies based on the services used. It offers a 15-day free trial, allowing users to explore the platform’s features.
Both tools provide free and paid plans, but if you are looking for a fully free self-managed solution, the Grafana open-source version is the best choice.
Dynatrace vs Grafana: Final Verdict
If you are trying to decide between Grafana and Dynatrace, it depends on your specific use case and monitoring needs. Here’s a breakdown of when each tool is the better choice:
When to Choose Grafana:
- Custom Dashboards & Visualization : If you need highly customizable dashboards with a wide range of data sources, Grafana is ideal.
- Cost-Effective Monitoring : Grafana, especially with Loki for logs and Prometheus for metrics, provides a budget-friendly open-source solution.
- Flexible Infrastructure Monitoring : It integrates seamlessly with cloud platforms like AWS, Kubernetes, and databases, making it great for distributed environments.
When to Choose Dynatrace:
- AI-Driven Automation : Dynatrace provides automatic anomaly detection and root cause analysis, reducing manual troubleshooting efforts.
- Comprehensive Observability : With APM, log management, infrastructure monitoring, and security in a single platform, it offers an all-in-one solution.
- Minimal Manual Setup : Unlike Grafana, which requires manual integration with data sources, Dynatrace’s OneAgent automates data collection and monitoring.
Still not sure? Atatus offers a balanced alternative with APM, log management, and infrastructure monitoring in a single, cost-effective platform.
A better Dynatrace and Grafana Alternative: Atatus
Atatus is a full-stack application performance monitoring and observability tool that serves as an excellent Dynatrace and Grafana alternative.
Here are a few reasons why you can consider Atatus as an alternative to Dynatrace and Grafana:
- All in one platform: Atatus, as a full-stack monitoring solution, offers complete visibility into your logs, metrics, and traces from a single interface. It eliminates the need for additional tools or integrations, providing seamless monitoring for both your applications and infrastructure.
- Custom Dashboards: Atatus provides a user-friendly interface for creating custom dashboards to display metrics, alerts, and other data, making it easy for organizations.
- APM (Application Performance Monitoring): Identify and fix spikes in endpoint failures and monitor application performance in real-time. Gain in-depth insights into transaction details, slow database queries, poor-performing network calls, and more.
- Log Management: Atatus provides a flexible log management solution with an out-of-the-box UI. Correlate logs with APM traces and errors for a comprehensive view.
- Distributed Tracing: Gain end-to-end visibility into microservices, perform root cause analysis with trace data, map service dependencies, and correlate logs with traces for a detailed understanding of your system.
If you are not yet an Atatus customer, sign up for a 14-day free trial.
#1 Solution for Logs, Traces & Metrics
![]() APM
APM
![]() Kubernetes
Kubernetes
![]() Logs
Logs
![]() Synthetics
Synthetics
![]() RUM
RUM
![]() Serverless
Serverless
![]() Security
Security
![]() More
More


![Splunk vs Prometheus: A Side-by-Side Comparison [2025 Guide]](/blog/content/images/size/w960/2024/08/Datadog-vs-sentry--13-.png)