Integrating Distributed Tracing in Node.js Application
Node.js runs JavaScript code in a single-threaded event loop, which handles I/O operations asynchronously without blocking the execution of other code.
This architecture allows Node.js to handle thousands of concurrent connections with low overhead, making it highly efficient for building high-performance web servers and microservices.
With many such systems adopting microservices and going for a distributed architecture, the necessity to monitor them has also increased. It is difficult to monitor every transaction and how it interacts with other services, so a distributed tracing system deserves a lot of attention here.
In this blog, we will look at how we can implement Distributed tracing in our Node.js application using two different agents - Atatus Node.js Monitoring and OpenTelemetry.
Table Of Contents:-
- What are Microservices and How to Debug them?
- What is Distributed Tracing?
- Distributed Tracing Concepts
- Setting up a Sample Node.js Application
- Instrumentation for Distributed Traces
- Visualizing Metrics with Atatus Dashboard
What are Microservices?
Microservices represent a modern approach to software architecture, breaking down complex applications into smaller, independent services. When many such microservices are working together, we call them Distributed Architecture.
- Scalability - demand-based scaling of individual services
- Reliability - failure in one component will not bring down the entire application
- Maintainability - dividing services helps in maintaining them more easily
With services communicating over networks and dependencies between them, identifying and resolving issues becomes complex, necessitating specialized tools and strategies to ensure the performance of the entire system. Debugging plays a crucial role in this process, helping developers identify and understand issues, such as software bugs, errors, or unexpected behavior, that arise during development or in production environments.
One of the primary challenges in microservices debugging is tracing the flow of requests as they traverse multiple services and components. Unlike monolithic applications where debugging typically involves examining a single codebase, debugging in a microservices environment requires tracking requests across various services, each potentially running on different hosts or containers. This complexity underscores the need for continuous debugging practices to ensure the smooth operation of distributed systems.
What is Distributed Tracing?
As we just saw, monitoring a distributed microservices architecture is hard. Keeping track of all the traces between several microservices would demand an enormous amount of time and energy. This is where distributed tracing comes in.
Distributed tracing is a method used to monitor and profile applications, especially those built on microservices architecture. It involves tracking the flow of requests as they traverse through multiple services and components.
With Distributed tracing, you can track all the spans (metadata containing information on timestamps, service identifiers, and operation names) occurring within a transaction across the distributed architecture. When you look at all these traces together, you will get a complete picture of what is happening in your system, which components are not functioning properly and much more.
Distributed Tracing Concepts
There are a few important concepts associated with Distributed tracing you must keep in mind:
What are Spans in Distributed Tracing?
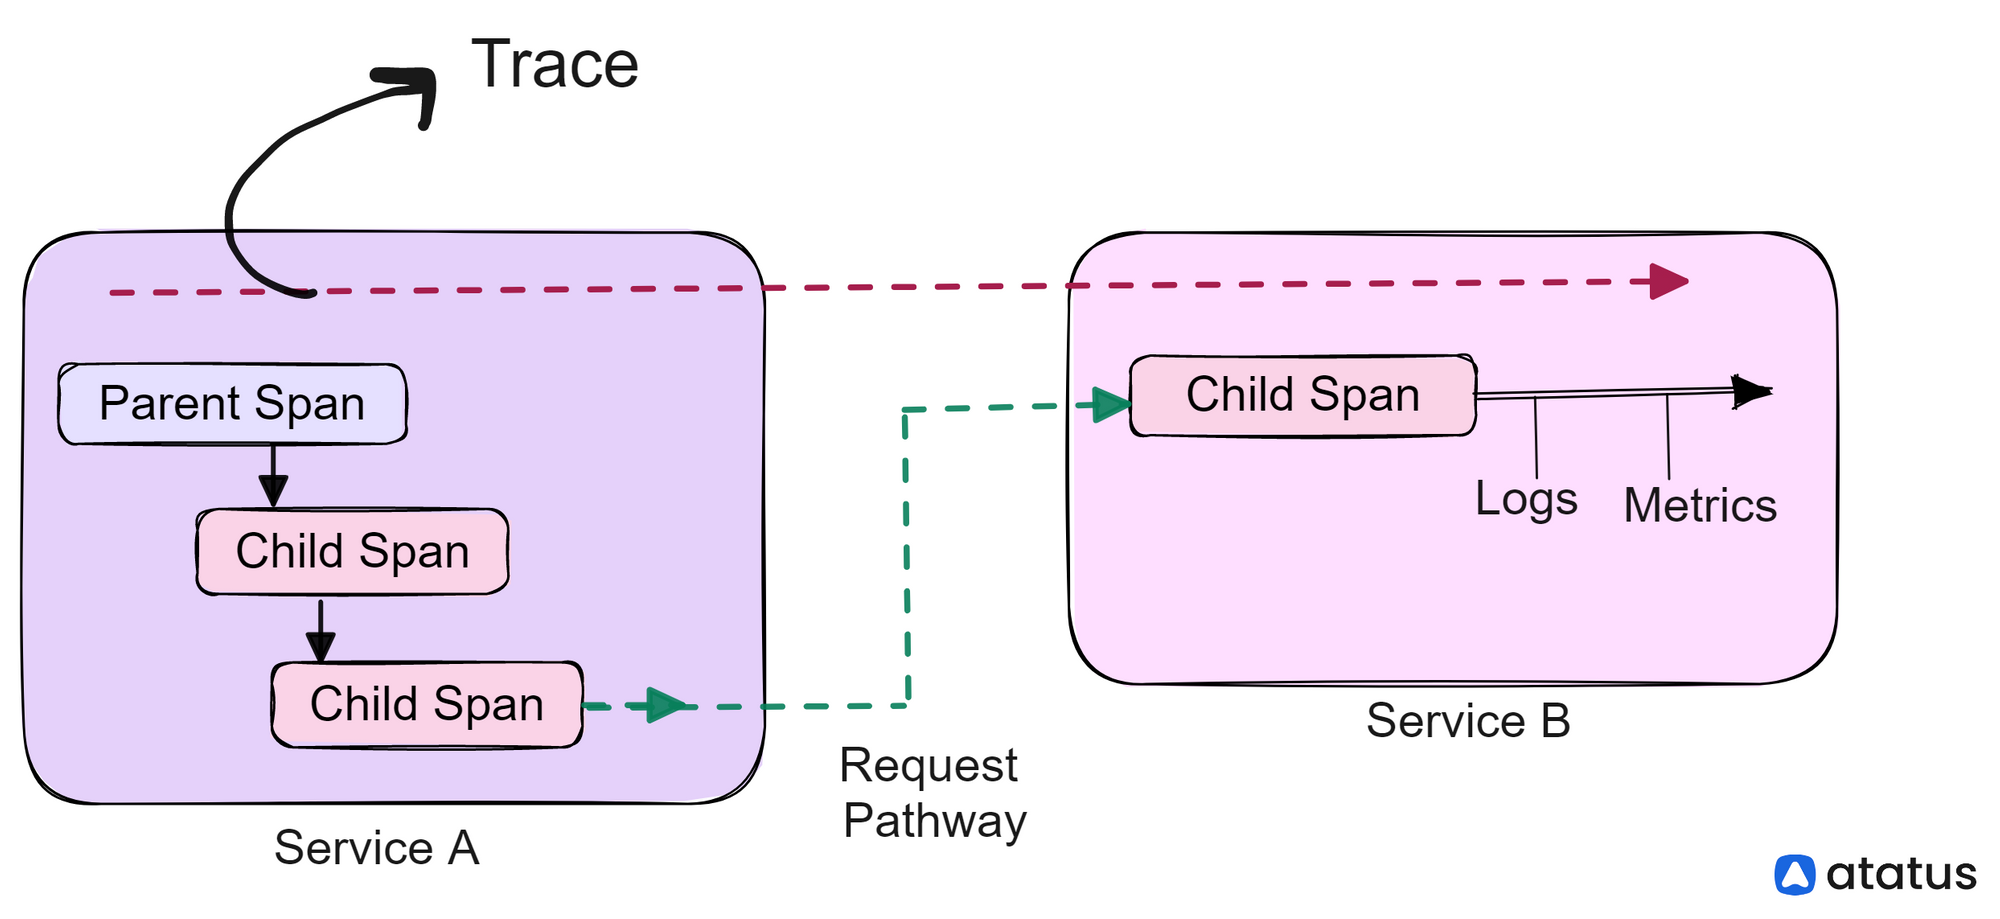
A span represents a unit of work performed within a distributed system. It encapsulates information about a specific operation, such as an HTTP request, database query, or function call. Spans contain metadata such as start and end timestamps, duration, operation name, and optional tags and attributes. Spans can also be nested within each other to represent parent-child relationships.
For example, imagine a user browsing an online food delivery website and placing an order for pizza. When the user clicks the "Place Order" button, we start a span to represent this action. This span captures information such as the start time, the name of the action (e.g., Place Order), and any relevant metadata (e.g., user ID, order ID).
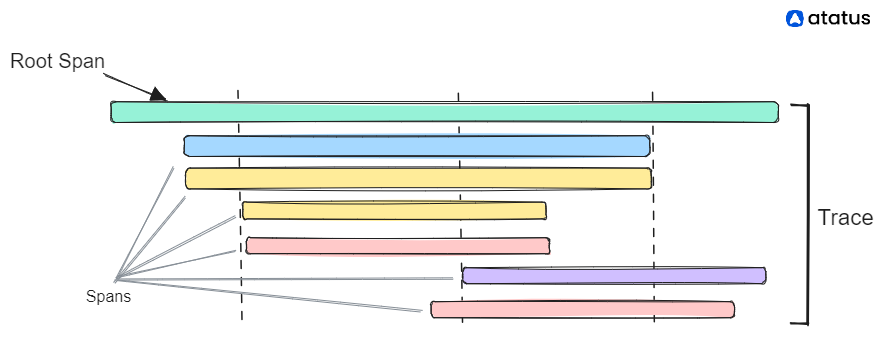
What are Traces in Distributed Tracing?
A trace is a collection of spans that represent the entire lifecycle of a request as it travels through various services and components in a distributed system. A trace starts with an initial span, called the root span, which represents the entry point of the request into the system. As the request propagates through different services, each service creates its own span and adds it to the trace. Traces provide a holistic view of request flow and help visualize the end-to-end path of requests through the system.
Parent-Child Relationships
In a distributed system, Spans in a trace are organized into a hierarchy based on parent-child relationships. When a service receives a request and creates a span to represent its processing of that request, it becomes the parent span. Subsequent spans created by downstream services that handle part of the request become child spans of the parent span. Parent-child relationships allow you to understand the sequence of operations performed by different services in response to a single request and identify dependencies between services.
Setting up a Sample Node.js Application
For setting up a sample Node.js application, you require the following:
- Node.js latest version
- NPM or Yarn
- a MySQL Database
Clone this sample Node.js application from GitHub repo:
git clone https://github.com/atatus/distributed-tracing-nodejs-sample.gitChange your directory to the cloned project folder using:
cd distributed-tracing-nodejs-sample
Install all the required dependencies by running npm install
Since we have created an application with three services - users, payment and orders, we will have to run each of them separately.
npm run users
npm run payment
npm run orders
To view traces in an user-interface, run the below commands:
npm install -g serve
serve ui
(npm serve will convert our current working directory into a virtual directory. It is used to serve static files and test web projects.)
Instrumentation for Distributed Traces
Once you have your application ready, you can start tracing it. Since, here we are looking at Distributed Tracing alone, we are going to focus on two methods through which you can look into your system behavior.
You can employ distributed tracing using two methods:
- Using Atatus Node.js agent
- Using OpenTelemetry agent
1. Instrumentation with Atatus
Atatus is a full-stack observability framework which offers a comprehensive Node.js monitoring agent that includes distributed tracing capabilities. Here's how you can implement distributed tracing using Atatus:
Let’s begin by installing the Atatus Node.js agent in your Node.js application using npm or yarn:
npm install --save atatus-nodejsNext, initialize the agent in your application code, typically at the entry point: This involves requiring the atatus-nodejs module and invoking the start() method with your Atatus API key and the name of your application:
// It must be placed above all other 'require' statements
var atatus = require("atatus-nodejs");
atatus.start({
    licenseKey: "YOUR_LICENSE_KEY",
    appName: "YOUR_APP_NAME",
    tracing: "true"
});
Atatus automatically instruments your code to capture traces across various services and components. You can also customize your Node.js APM agent with the following configurations.
Once you’ve configured it, just restart your server, and you can view your Node.js application from the web or mobile application.
2. Instrumentation with OpenTelemetry
OpenTelemetry is an open-source observability framework that simplifies the process of instrumenting your Node.js application to capture distributed traces. It provides APIs and libraries that enable developers to add instrumentation code to their applications, allowing them to create spans to trace the flow of requests across services and components.
OTel supports various instrumentation libraries for popular Node.js frameworks and libraries, making it easy to integrate distributed tracing into your existing applications. Additionally, OTel offers compatibility with multiple observability backends, such as Jaeger, Zipkin, and Prometheus, allowing you to choose the backend that best suits your monitoring infrastructure.
Installation: Start by installing the necessary OpenTelemetry packages using npm or yarn:
npm install @opentelemetry/sdk-node \
    @opentelemetry/api \
    @opentelemetry/exporter-trace-otlp-http \
    @opentelemetry/auto-instrumentations-node \
    @opentelemetry/sdk-metrics \
    @opentelemetry/sdk-trace-node
Initialize the OpenTelemetry instrumentation in your application code. This involves importing the required modules, creating a tracer provider, adding a span processor, and registering the provider, but now you can easily auto instrument:
Set up the instrumentation with the following file:
/*instrumentation.js*/
// Require dependencies

const { NodeSDK } = require('@opentelemetry/sdk-node');
const { ConsoleSpanExporter } = require('@opentelemetry/sdk-trace-node');
const { OTLPTraceExporter } = require('@opentelemetry/exporter-trace-otlp-http');
const { getNodeAutoInstrumentations } = require('@opentelemetry/auto-instrumentations-node');
const { PeriodicExportingMetricReader, ConsoleMetricExporter } = require('@opentelemetry/sdk-metrics');

const exporterOptions = {
	url: 'https://otel-rx.atatus.com/v1/traces',
	headers: { 'api-key': '<ATATUS_API_KEY>' }
};

const sdk = new NodeSDK({
	traceExporter: new OTLPTraceExporter(exporterOptions),
	metricReader: new PeriodicExportingMetricReader({
		exporter: new ConsoleMetricExporter(),
	}),
	instrumentations: [getNodeAutoInstrumentations()],
});

sdk.start();
Here, we are exporting the data to Atatus (which is an observability platform and thus would visualize your data). For accessing the Atatus API key, follow the steps listed in the documentation.
Run the instrumented application.
Now run the application with –require flag.
node --require ./instrumentation.js app.js
Restart your server and run the application to see if it is working properly or not.
OpenTelemetry provides various exporters to send traces to observability platforms like Jaeger, Zipkin, or Prometheus for visualization and analysis. You can configure these exporters to suit your monitoring infrastructure and preferences, enabling you to gain insights into your application's behavior and performance.
Visualizing Metrics with Atatus Dashboard
With Atatus you can do much more than just collect metrics. You can visualize these data and see them in pre-configured charts. You can add widgets for different metrics, traces, and service maps, arranging them in a way that provides the most relevant insights at a glance. Custom dashboards empower you to focus on the aspects of your application that matter most to you and your team.
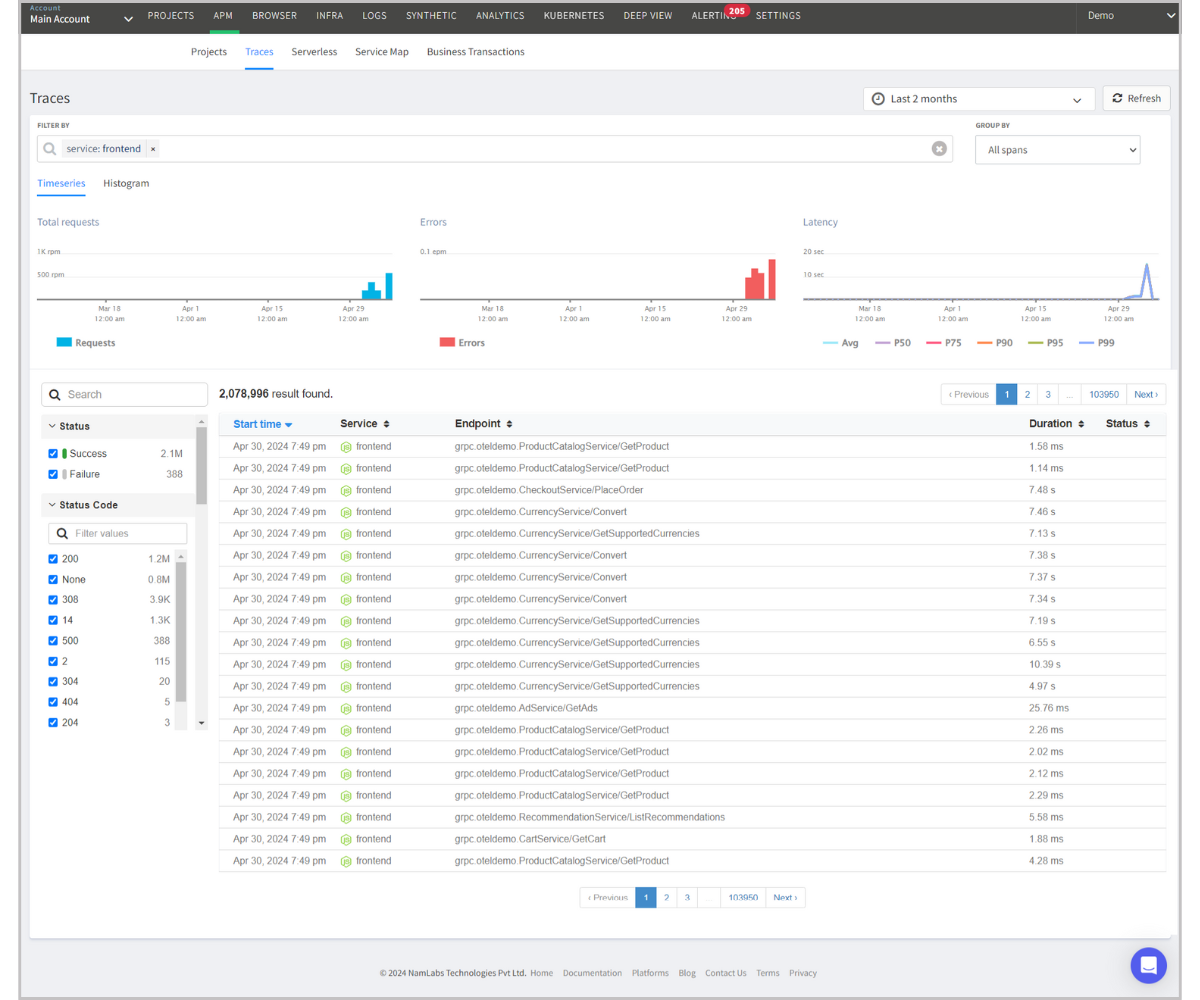
To view the details for the Node.js application that you sampled before, navigate to the Traces tab within the APM dashboard, you'll be able to see an intuitive interface where you can set the time range and filter services for granular analysis.
This tab offers an overview of total requests, errors, and latency, providing valuable insights into the overall health and performance of your application. Additionally, you can filter traces by span groups, including root spans and entry spans, to focus on specific areas of interest.
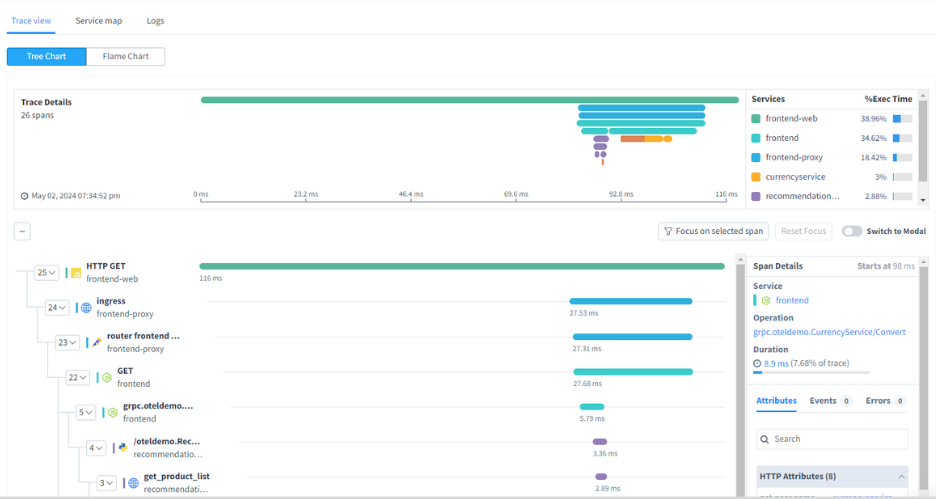
Clicking on individual traces opens up a detailed view in a new tab, presenting trace details through informative charts. Each trace is displayed with detailed information, including the timing of each operation, dependencies between services, and any errors encountered along the way.
You have the flexibility to visualize trace data either in a Gantt chart or a Flame chart, offering different perspectives on request execution flow and timing. This page provides insights into the execution times of each service separately, allowing you to identify bottlenecks and optimize performance.
Additionally, you can explore span details and HTTP attributes, including status codes and methods, while events and errors are conveniently displayed below the span details column for easy reference.
Visualize Traces with Gantt Chart
In a Gantt chart, each task is represented by a horizontal bar, with the length of the bar indicating the duration of the task. Tasks are typically arranged along the vertical axis, while time intervals (days, weeks, months) are displayed along the horizontal axis. Dependencies between tasks are depicted through linking lines, showing which tasks must be completed before others can begin.
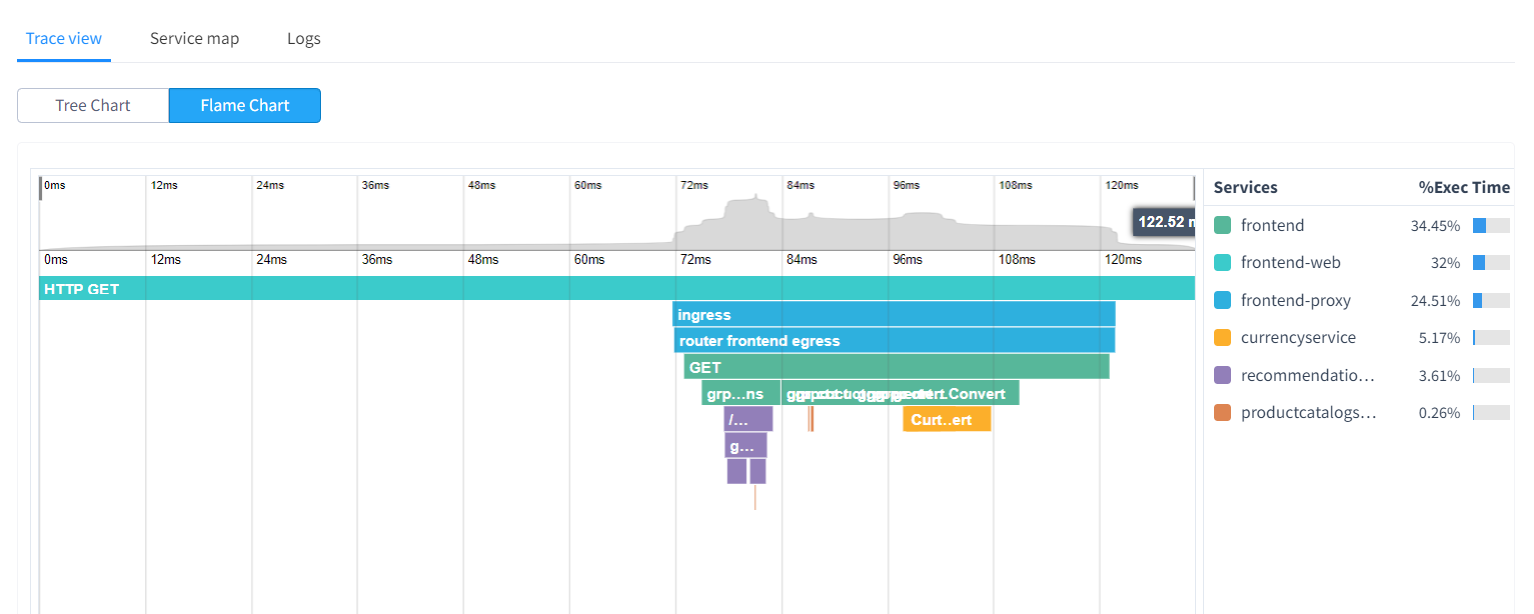
Visualize Traces with FlameChart
In a flamechart, each horizontal bar represents a stack frame or function call, with the width of the bar indicating the duration of the corresponding code execution. The bars are stacked vertically to illustrate the call hierarchy, with each stack level representing a function call and its child functions.
Coming to the Duration, functions or code blocks that appear wider in the flamegraph indicate areas of the code where the application spends more time executing, while narrower sections represent less time-consuming operations. This visualization aids in understanding the overall structure and behavior of the application
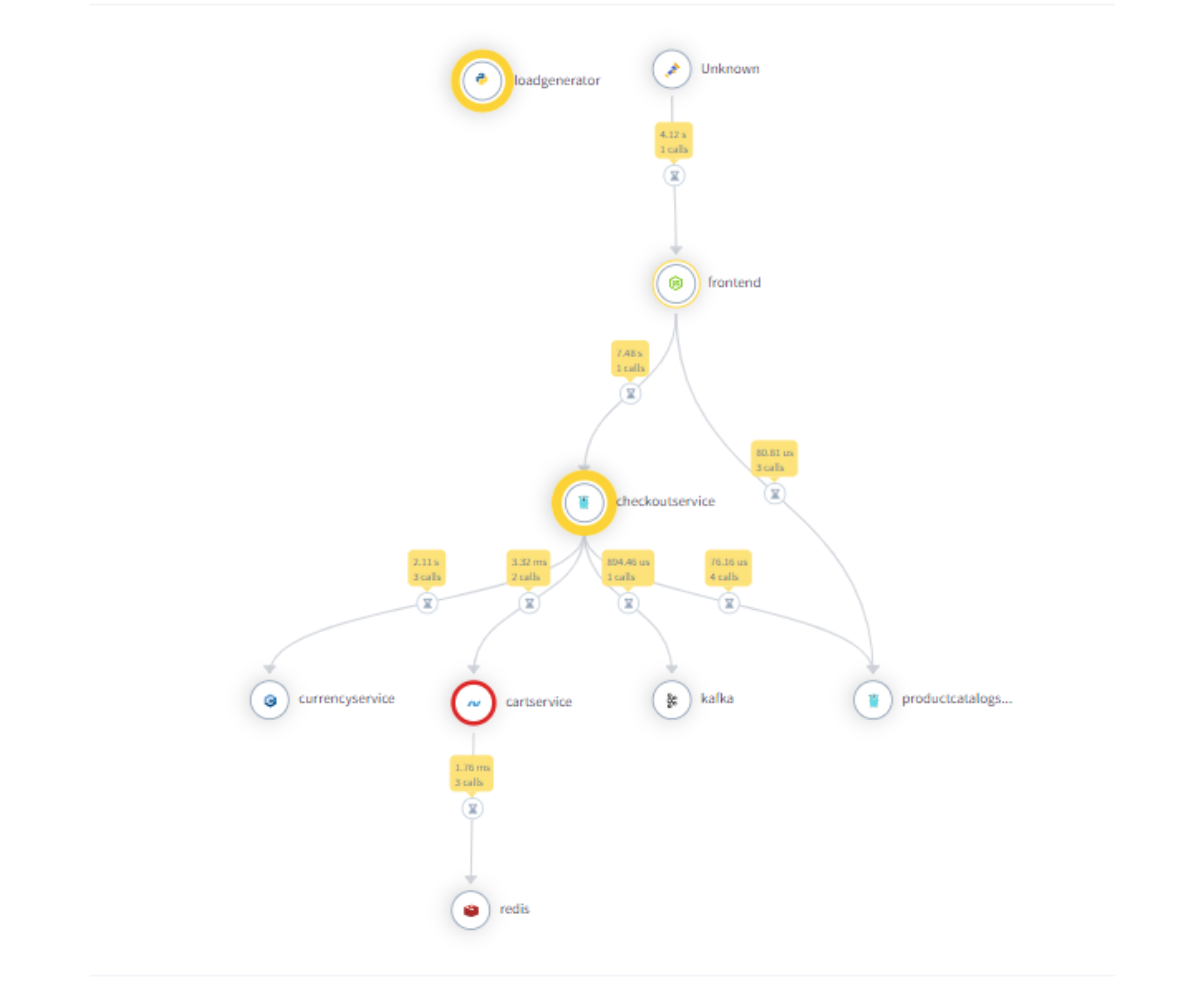
But the exploration doesn't end there. With Atatus' service maps, you gain a bird's-eye view of the intricate pathways traversed by your transactions. Here, you can navigate through each component, inspecting their metrics with meticulous detail. From transaction inception to culmination, Atatus equips you with the insights needed to optimize every facet of your Node.js application's performance and reliability.
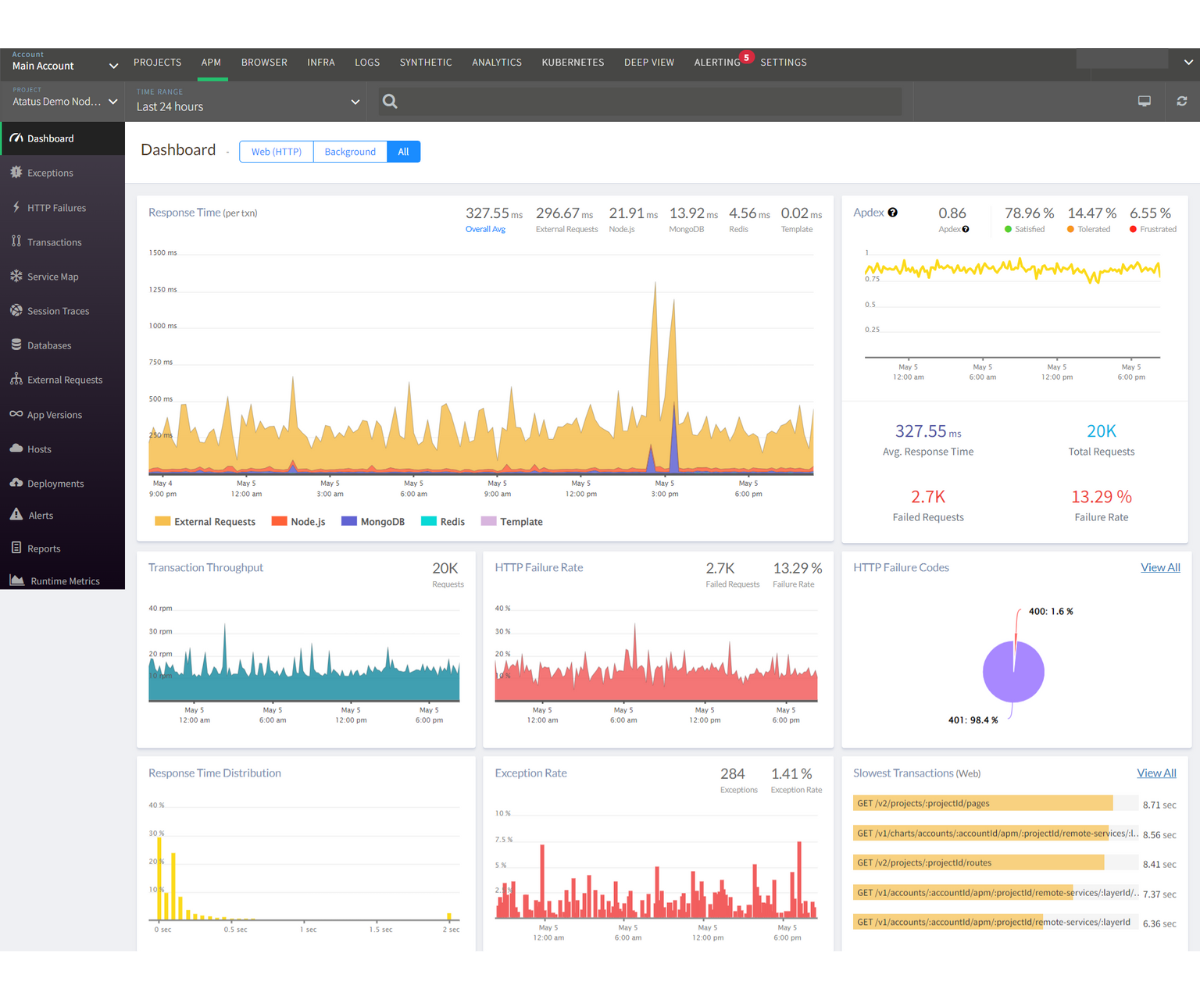
In addition to distributed traces, Atatus offers a range of performance metrics to help you monitor the health of your application. The Atatus APM for Node.js collects response time (per transaction), transaction throughput, HTTP failure rate, HTTP failure codes, Slowest transactions, and Apdex score and visualizes them in easy-to-understand, standout charts.
You can configure alerts to notify you via email, Slack, or other channels when certain conditions are met, enabling proactive monitoring and timely response to potential issues.
Conclusion
In this article, we explored two different methods for implementing distributed tracing in Node.js applications: using the Atatus Node.js monitoring agent and the OpenTelemetry agent. We also discussed why having a tracing system is of great help, especially when you are using a distributed architecture.
Perks of using a Distributed Tracing tool:
- Gain visibility into the workings of all the components within your system.
- Utilize trace data to optimize latency issues, resource usage and so on.
- Implement error handling measures based on observed patterns.
While OpenTelemetry offers good flexibility and customization options for manual instrumentation, Atatus offers more straightforward setup with automatic instrumentation and deep visibility.
Moreover, Atatus seamlessly integrates with OpenTelemetry, allowing users to export metrics collected by OpenTelemetry instrumentation to other compatible systems or directly to Atatus. This integration provides users with a comprehensive view of all transactions occurring across their system, enabling 360-degree visibility into system performance and behavior.
By combining Atatus and OpenTelemetry, teams can maximize their insights into the performance of their Node.js applications, enabling them to identify and resolve errors directly in the production environment.
#1 Solution for Logs, Traces & Metrics
![]() APM
APM
![]() Kubernetes
Kubernetes
![]() Logs
Logs
![]() Synthetics
Synthetics
![]() RUM
RUM
![]() Serverless
Serverless
![]() Security
Security
![]() More
More