Datadog vs Sentry - key features, differences and alternatives
Are you struggling to choose between Datadog and Sentry for your application monitoring needs? Datadog and Sentry are widely recognized for their roles in monitoring applications. Although they share some common features, they serve distinct purposes.
Datadog excels in overseeing application performance and providing comprehensive system observability, while Sentry specializes in pinpointing and reporting application errors.
In this blog post, I have compared Datadog and Sentry side-by-side across their key features such as error monitoring, application performance monitoring(APM), alerting capabilities, differences, and alternatives.
If you are deciding between Datadog and Sentry, this comparison will help you understand their strengths and choose the right fit for your needs.
List of Topics
- Datadog vs Sentry: Overview
- Setup
- Error Monitoring
- Application Performance Monitoring
- Alerting and Notifications
- Ease of Use
- Pricing
- Atatus - An Alternative to Datadog and Sentry
Datadog vs Sentry: Overview
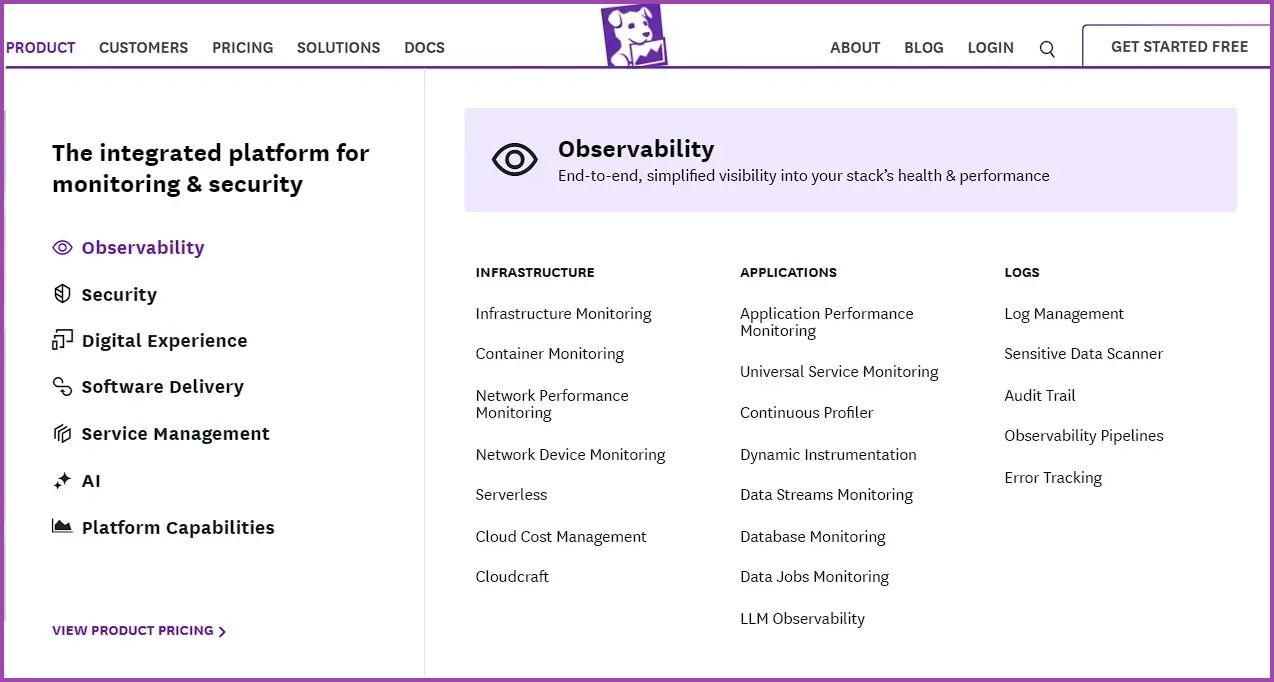
Datadog is a comprehensive monitoring and analytics platform offering features like infrastructure monitoring, application performance monitoring (APM), and log management, providing full-stack observability for modern applications.
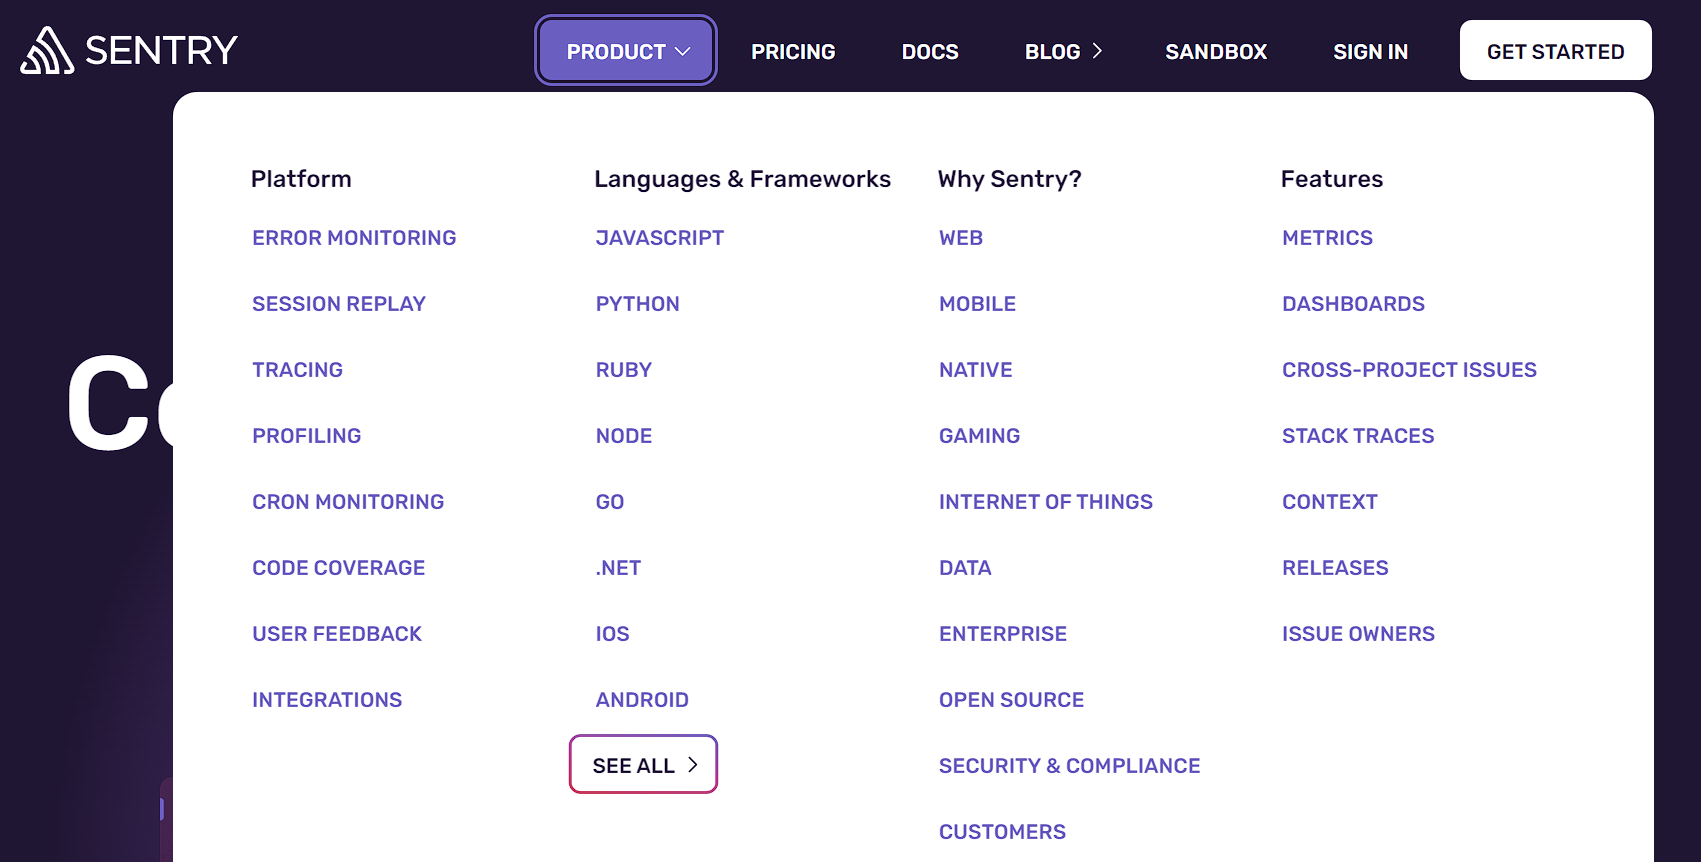
Sentry, on the other hand, is a software monitoring tool focused on helping developers identify and fix code-related issues. It provides error tracking and performance monitoring with detailed, code-level insights to diagnose and resolve problems quickly.
Here’s a brief summary of the key features and functionality of Datadog and Sentry.
| Features | Datadog | Sentry |
|---|---|---|
| APM | ✅ | ✅ |
| Error Monitoring | ✅ | ✅ |
| Infrastructure Monitoring | ✅ | ❌ |
| Log Monitoring | ✅ | ❌ |
| Cloud Monitoring | ✅ | ❌ |
| Session Replay | ✅ | ✅ |
| Profiling | ✅ | ✅ |
| Security | ✅ | ❌ |
| Open-Source | ❌ | ✅ |
| Alerting | ✅ | ✅ |
| Real User Monitoring | ✅ | ✅ |
| 14-days Free Trial | ✅ | ✅ |
Setup
Sentry:
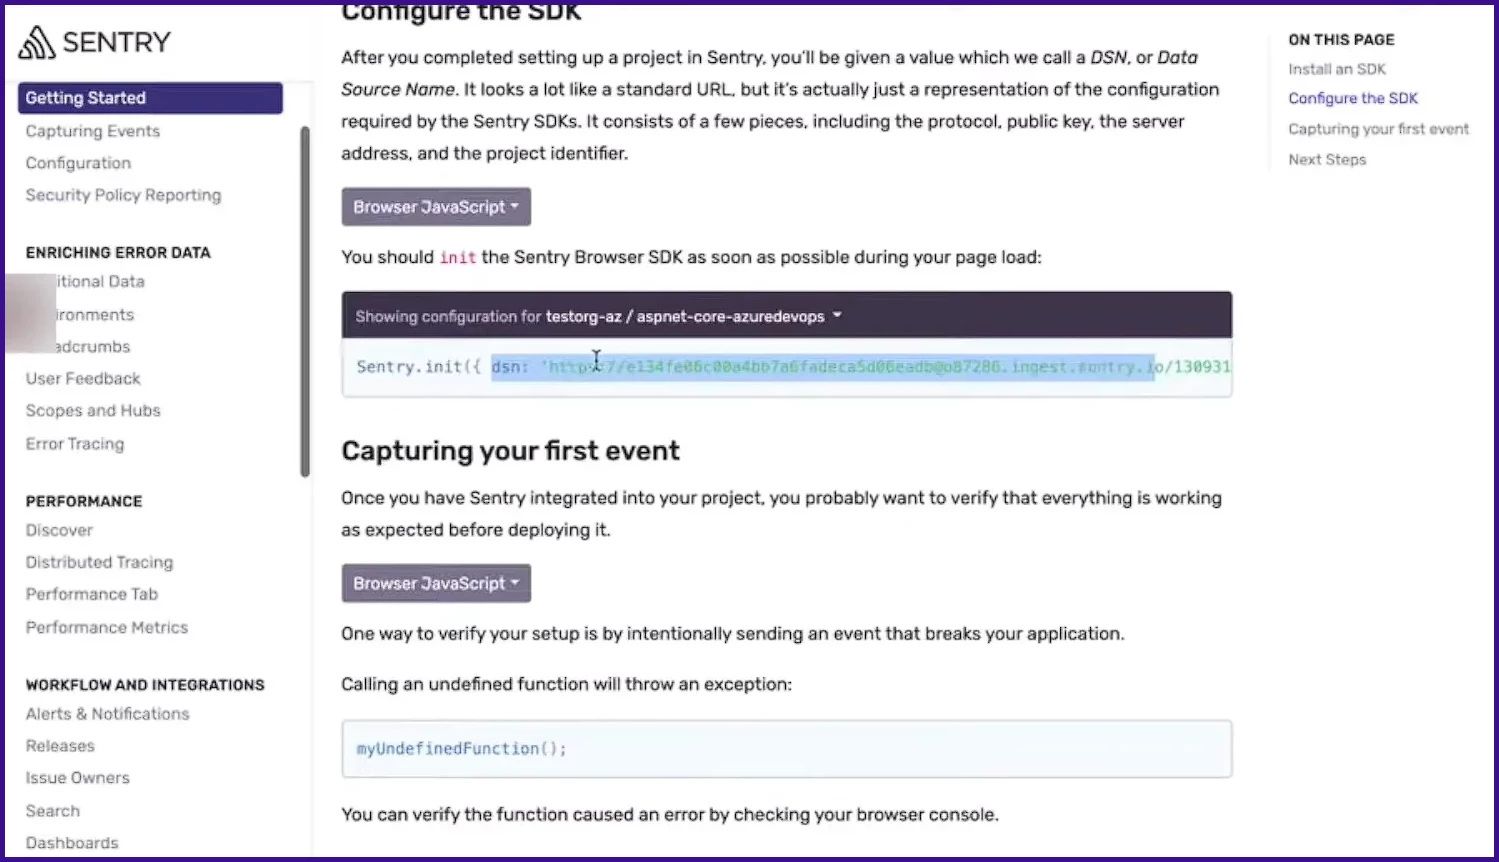
When I integrated Sentry into a react-based tool store app with a python backend, the process was smooth. After creating a project in Sentry, it provided a DSN key, which I added to my source code. This simple step ensured that all errors were automatically sent to the Sentry account. The setup was quick and required minimal effort, making it ideal for getting started without extensive configuration.
Datadog:
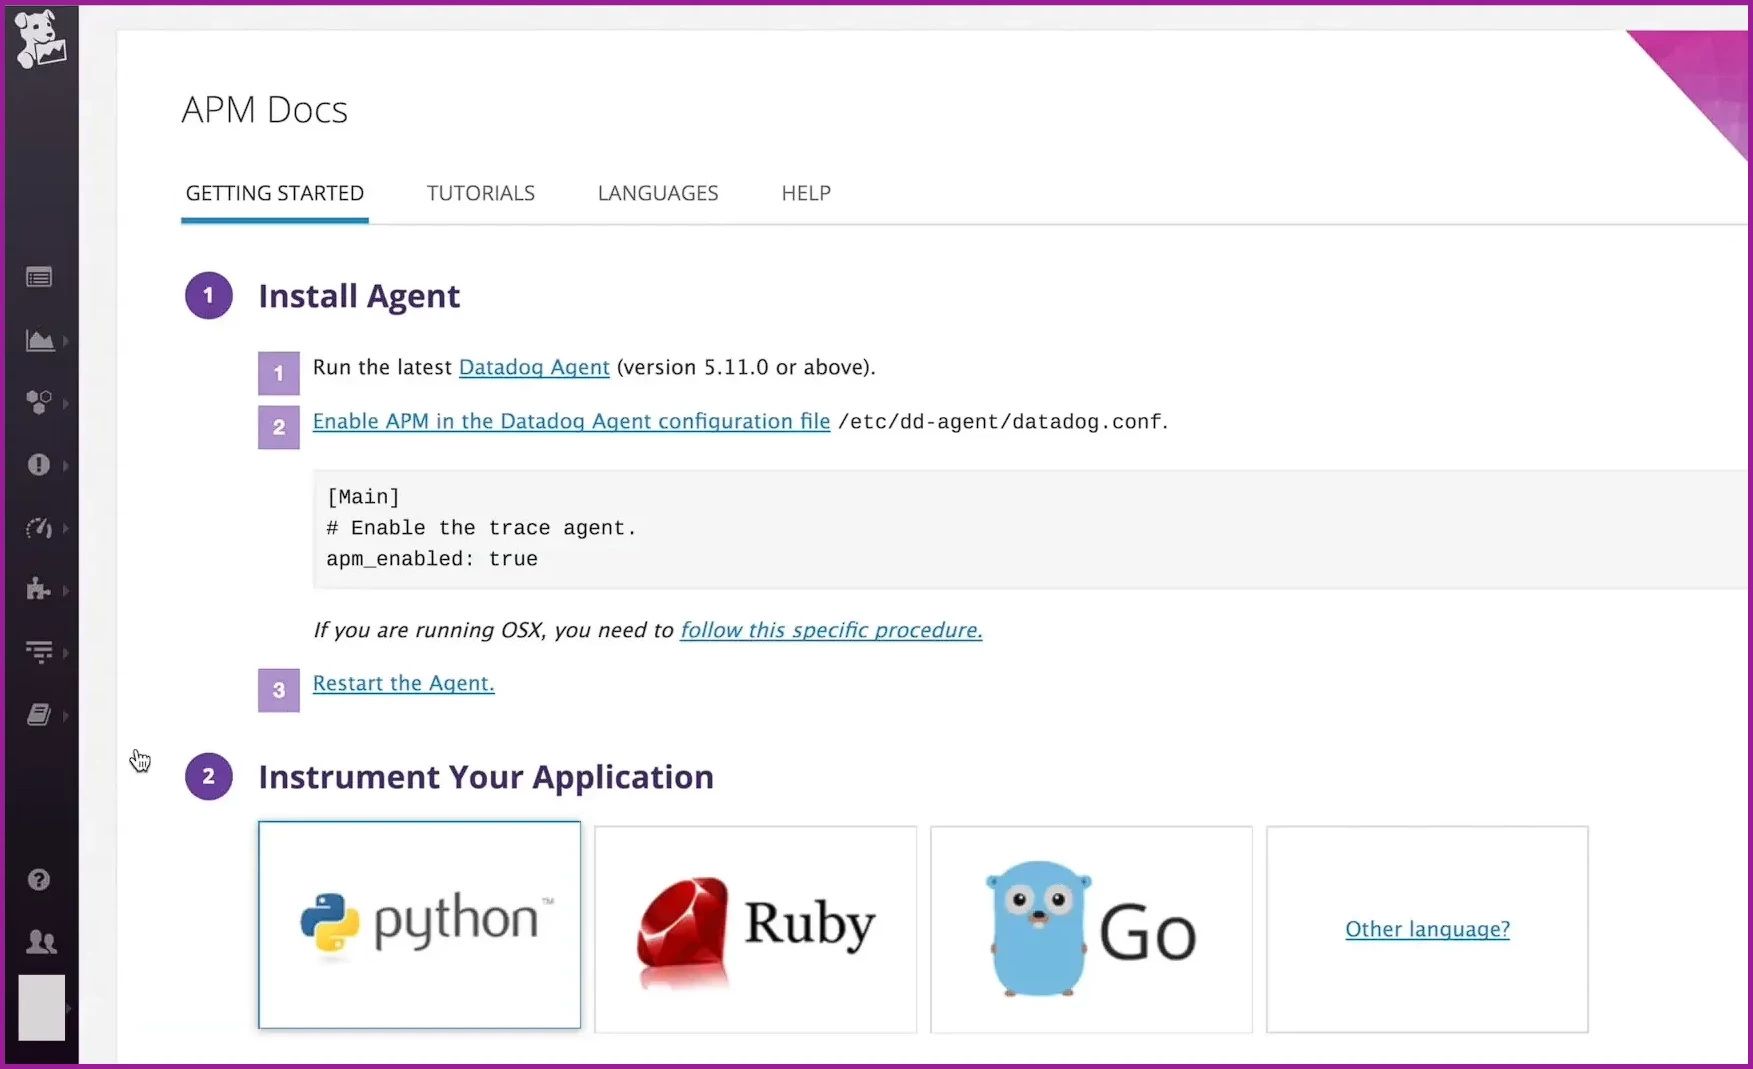
Setting up Datadog required more steps and configuration compared to Sentry. I had to install the Datadog Agent and configure additional instrumentation for error tracking. While Datadog supports a wide range of environments, including cloud infrastructure and servers, the initial setup took more time compared to Sentry.
For a straightforward, minimal-effort setup, Sentry is a clear choice. If you are okay with a more time-consuming setup for more extensive monitoring, then Datadog is better.
Error Monitoring
Sentry:
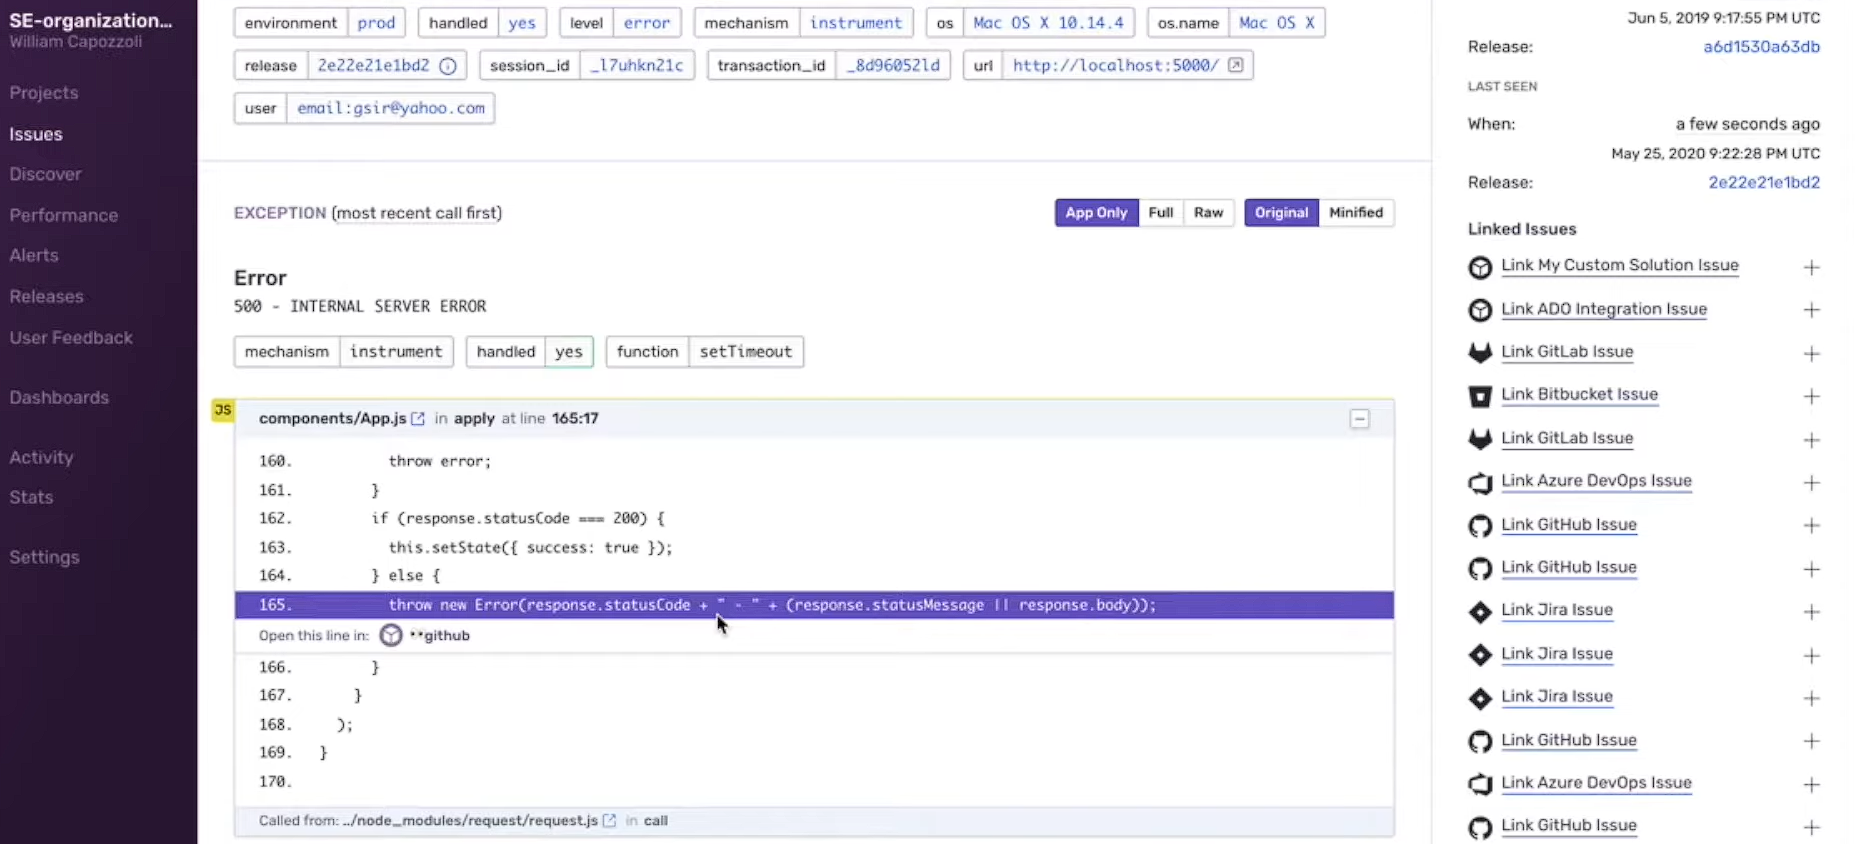
In the Tool Store app, I encountered an error during the purchase process. Sentry captured this error and provided detailed insights, including the error type, message, stack trace, and additional context like user actions and environment details.
The stack trace pinpointed the exact line of code causing the error, which was invaluable for debugging. Also Sentry grouped similar errors into issues, which allowed me to manage and prioritize them effectively.
Datadog:
Using Datadog for a different project, I found that it tracked errors alongside application performance metrics, offering a holistic view of the application’s health.
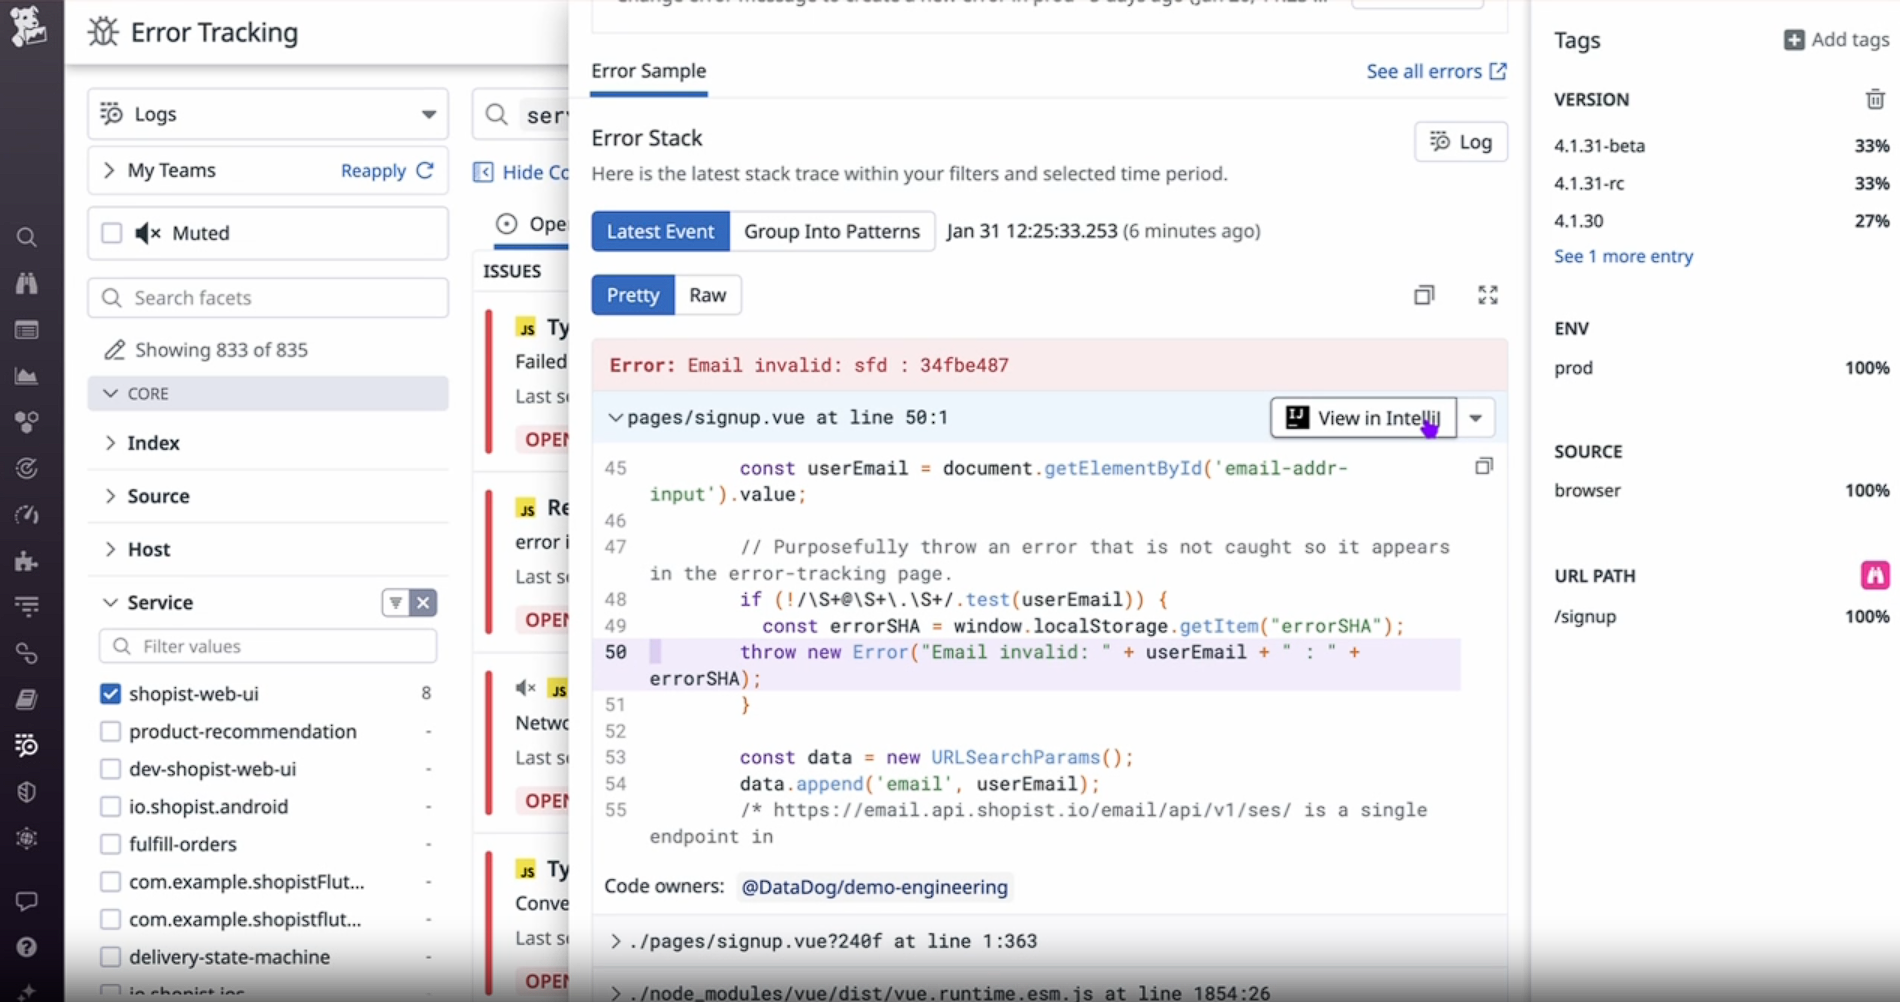
Datadog’s error grouping and filtering capabilities were flexible, allowing us to manage issues based on custom tags and attributes. The additional context provided by Datadog, including infrastructure and performance, helped correlate errors with underlying performance issues.
Based on my experiences with both Sentry and Datadog, for dedicated error tracking and quick debugging, I highly recommend Sentry. Its detailed error insights, and efficient error grouping make it the best option for developers looking to quickly and effectively manage application errors.
Based on my experiences with both Sentry and Datadog, for dedicated error tracking and quick debugging, I highly recommend Sentry. Its detailed error insights, and efficient error grouping make it the best option for developers looking to quickly and effectively manage application errors.
Application Performance Monitoring
Sentry:
When I used Sentry's Application Performance Monitoring (APM), I found it straightforward and helpful. It allowed me to identify slow code and trace issues to specific API calls or database queries.
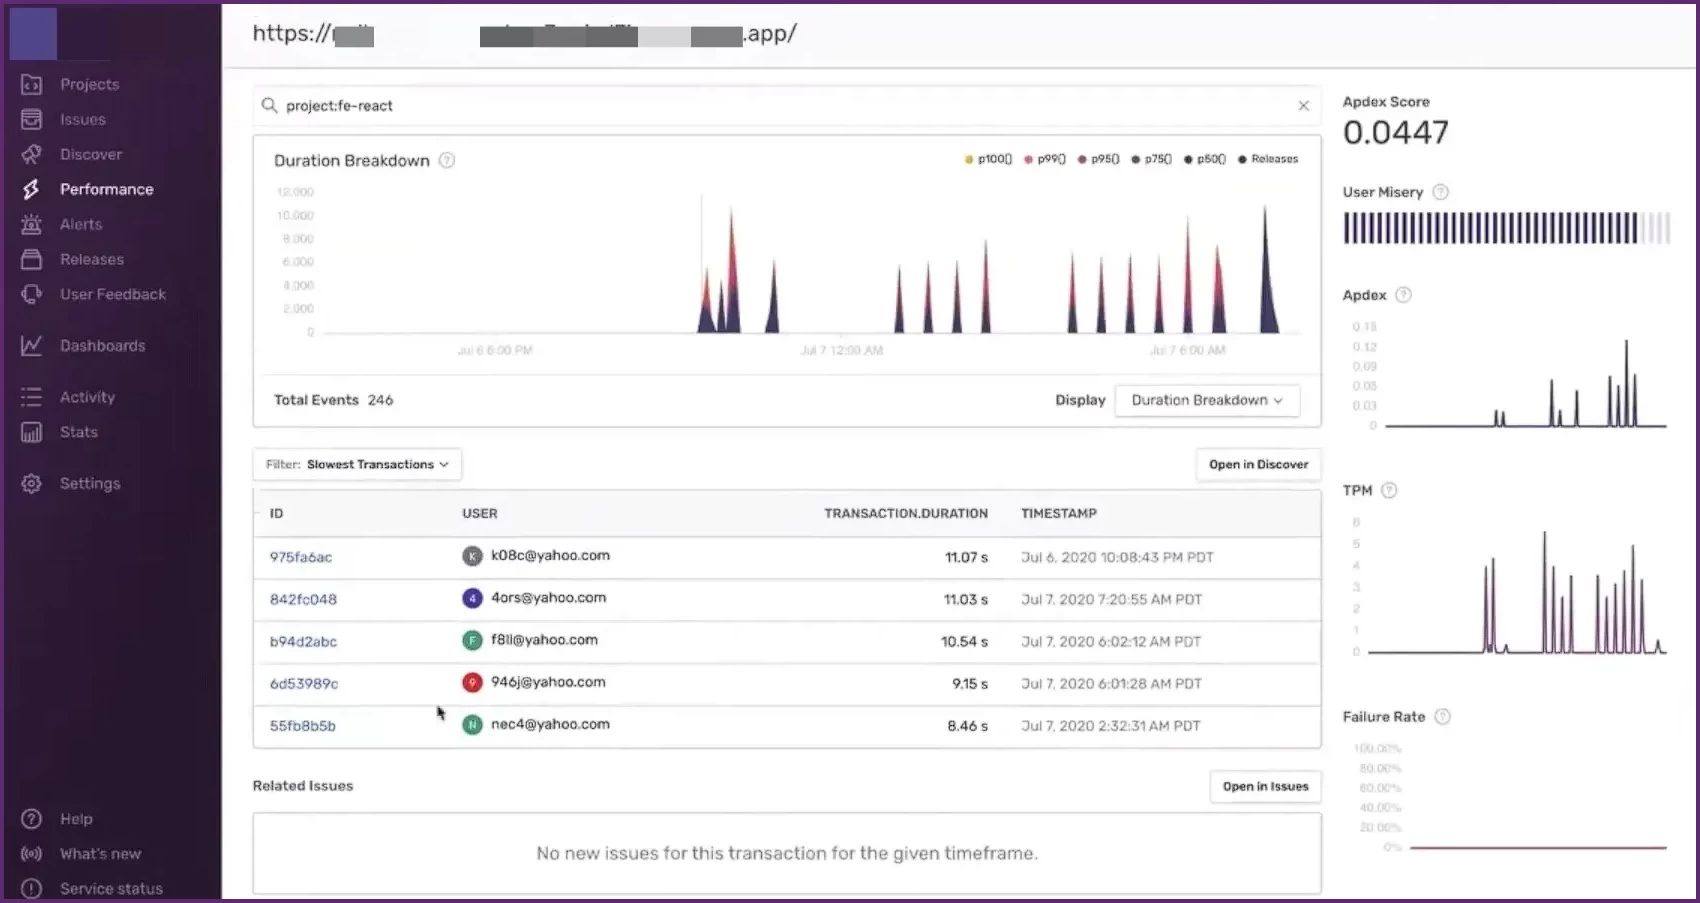
The automatic alerts for latency problems affecting users meant I could address urgent issues promptly. Sentry provided clear visualizations of performance bottlenecks, which made it easier for me to understand and fix problems. While it covered the basics well, I felt it lacked some advanced features and integrations needed for more complex environments.
Datadog:
When I used Datadog's Application Performance Monitoring (APM), I found it to be great for tracing performance across various layers of applications. The AI-powered distributed tracing feature was particularly impressive, as it allowed me to track requests seamlessly from frontend interactions through backend services and databases.
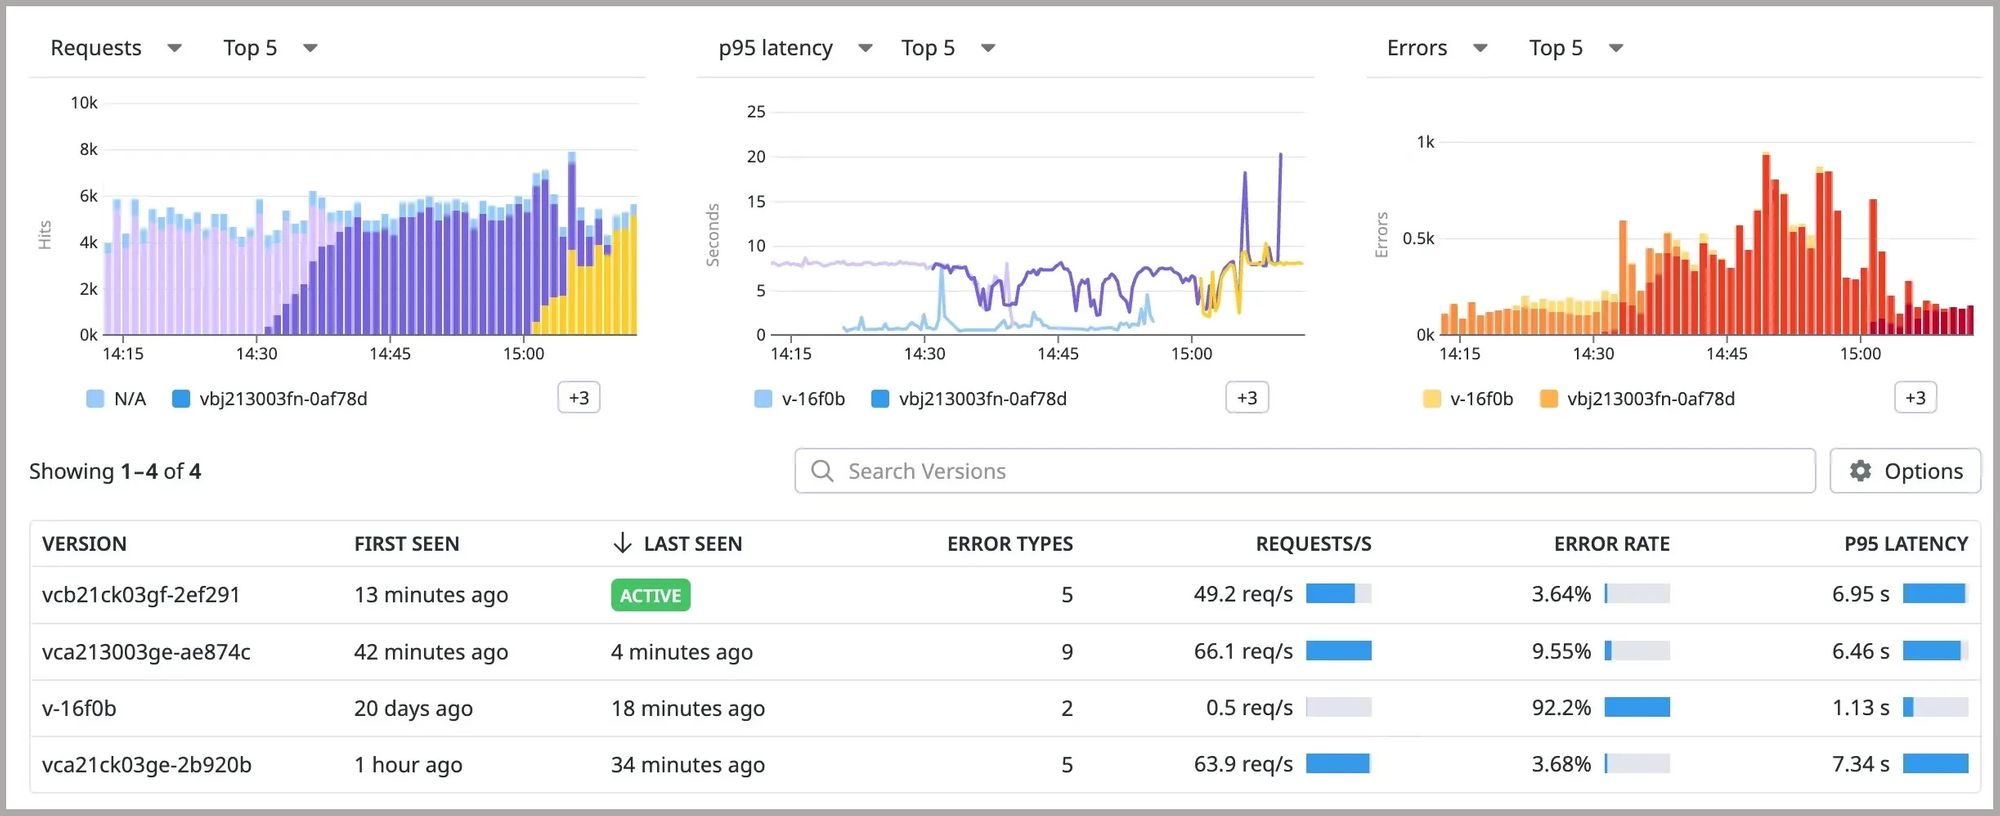
Integrating these traces with infrastructure metrics and live processes provided a comprehensive view of application performance. One of the standout features of Datadog's APM is its flexibility and control. I was able to customize metrics collection to suit my specific needs.
Datadog is the preferred choice for APM due to its specialized focus on comprehensive performance monitoring across applications, infrastructure, and user experiences, making it ideal for organizations seeking thorough application performance insights.
Alerting and Notifications
Sentry:
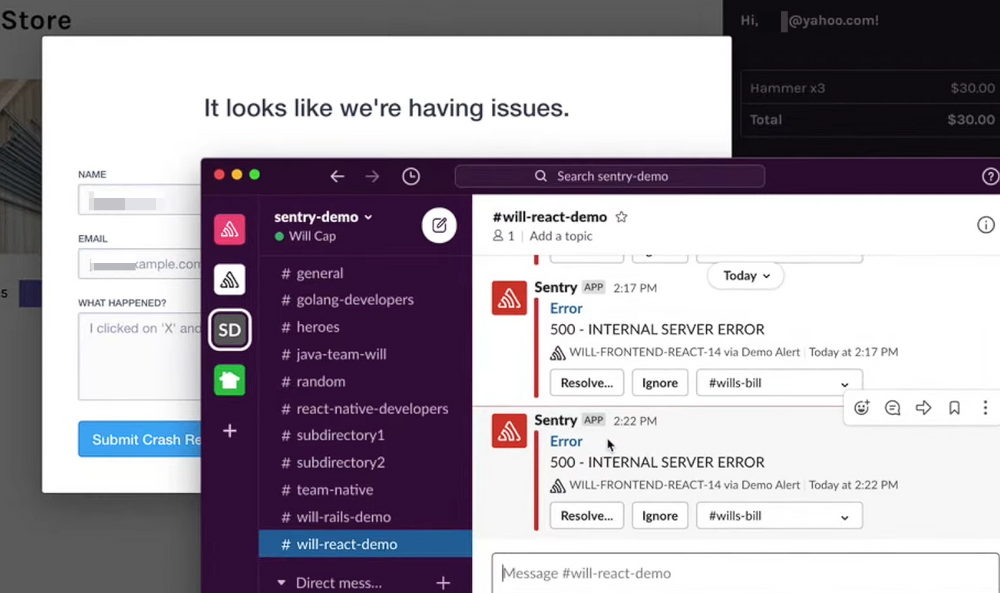
With Sentry, I configured real-time alerts via Slack and email. This ensured my team was immediately notified of any critical issues. The customizable alerting options allowed me to set alerts based on error frequency and severity. This immediate notification system was crucial for our response times.
Datadog:
Datadog’s alerting capabilities are extensive. I set up alerts to notify us through Slack, PagerDuty, and email. Datadog’s advanced alerting conditions and anomaly detection provided robust monitoring capabilities, ensuring we were alerted to both expected and unexpected issues. The customization options for alerts were powerful, allowing for complex conditions to be set.
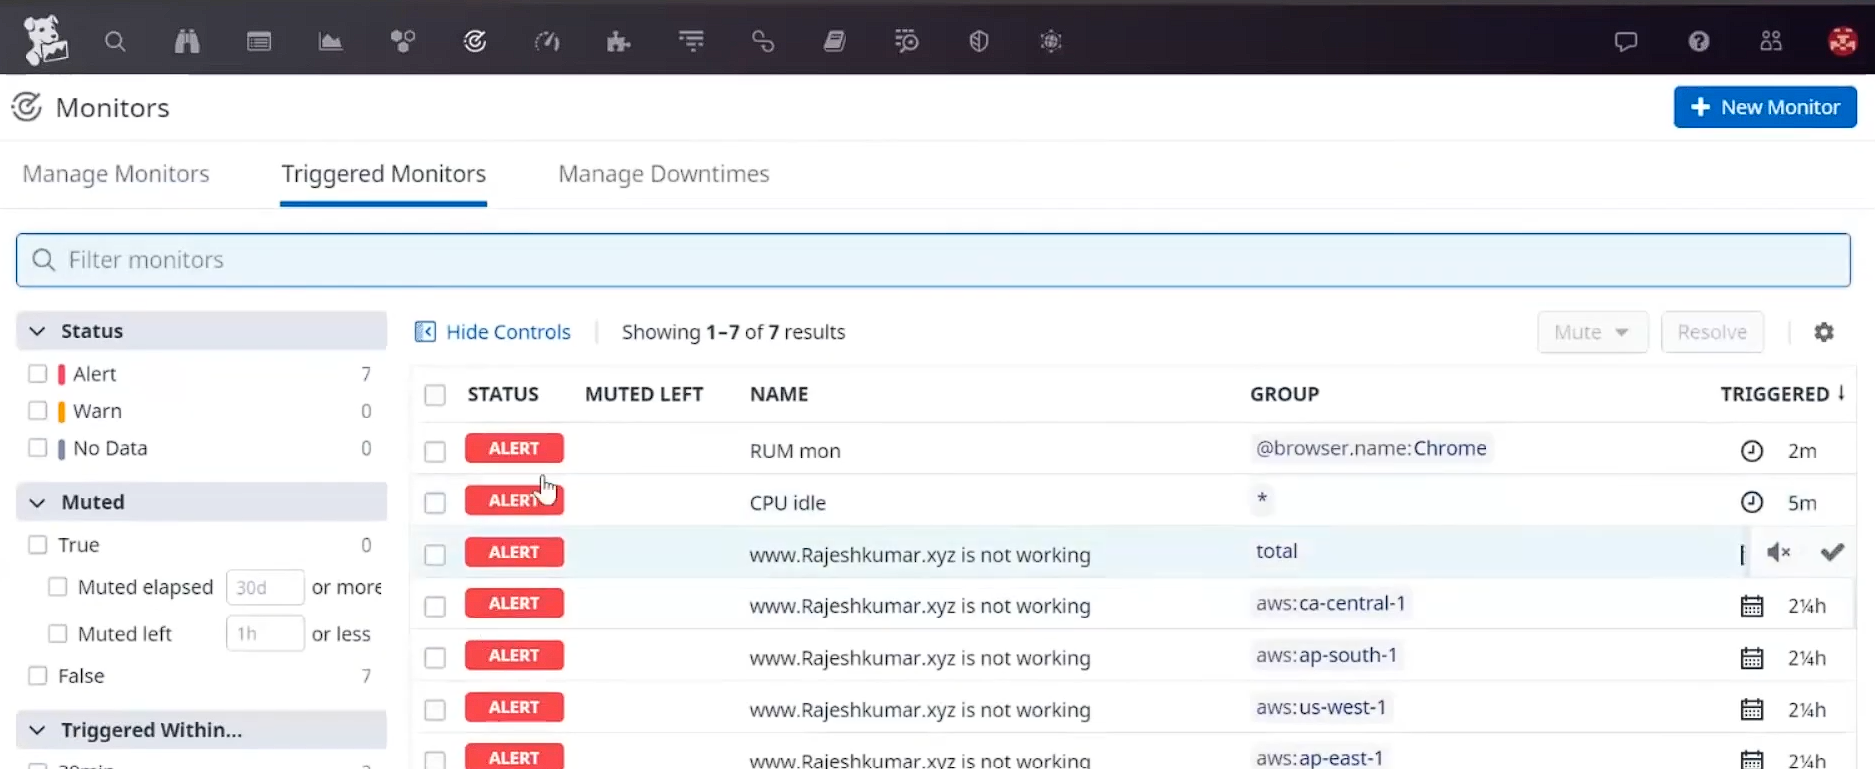
It's a tie between Sentry and Datadog for alerting capabilities. From my experience, I found no difficulty with either Sentry or Datadog when it comes to their alerting capabilities.
Ease of Use
Sentry:
Sentry’s user interface is intuitive and focused on error tracking. Navigating through error details, stack traces, and contextual information was straightforward. The learning curve was minimal, allowing me to quickly get up to speed and make use of its features effectively.
Datadog:
Datadog’s user interface is more comprehensive, combining error monitoring with performance, infrastructure, and security monitoring. While powerful, it took some time to get accustomed to navigating through the various features and dashboards. The learning curve was steeper compared to Sentry, but the extensive capabilities made it worthwhile for broader monitoring needs.
When I used Sentry, I found it very easy to navigate, especially for error tracking, with straightforward access to error details. In contrast, navigating Datadog was a bit more challenging due to its comprehensive interface covering multiple aspects. Moreover Sentry's clear documentation provided better guidance, whereas Datadog's documentation felt poorly structured.
Pricing
Sentry:
Sentry operates on a pricing model structured around user seats and monthly rates, featuring various tiers. I have found Sentry's pricing to be transparent, making it easy to understand and predict costs. Plus, there is a 14-day free trial, allowing you to explore the platform's features without any initial investment.
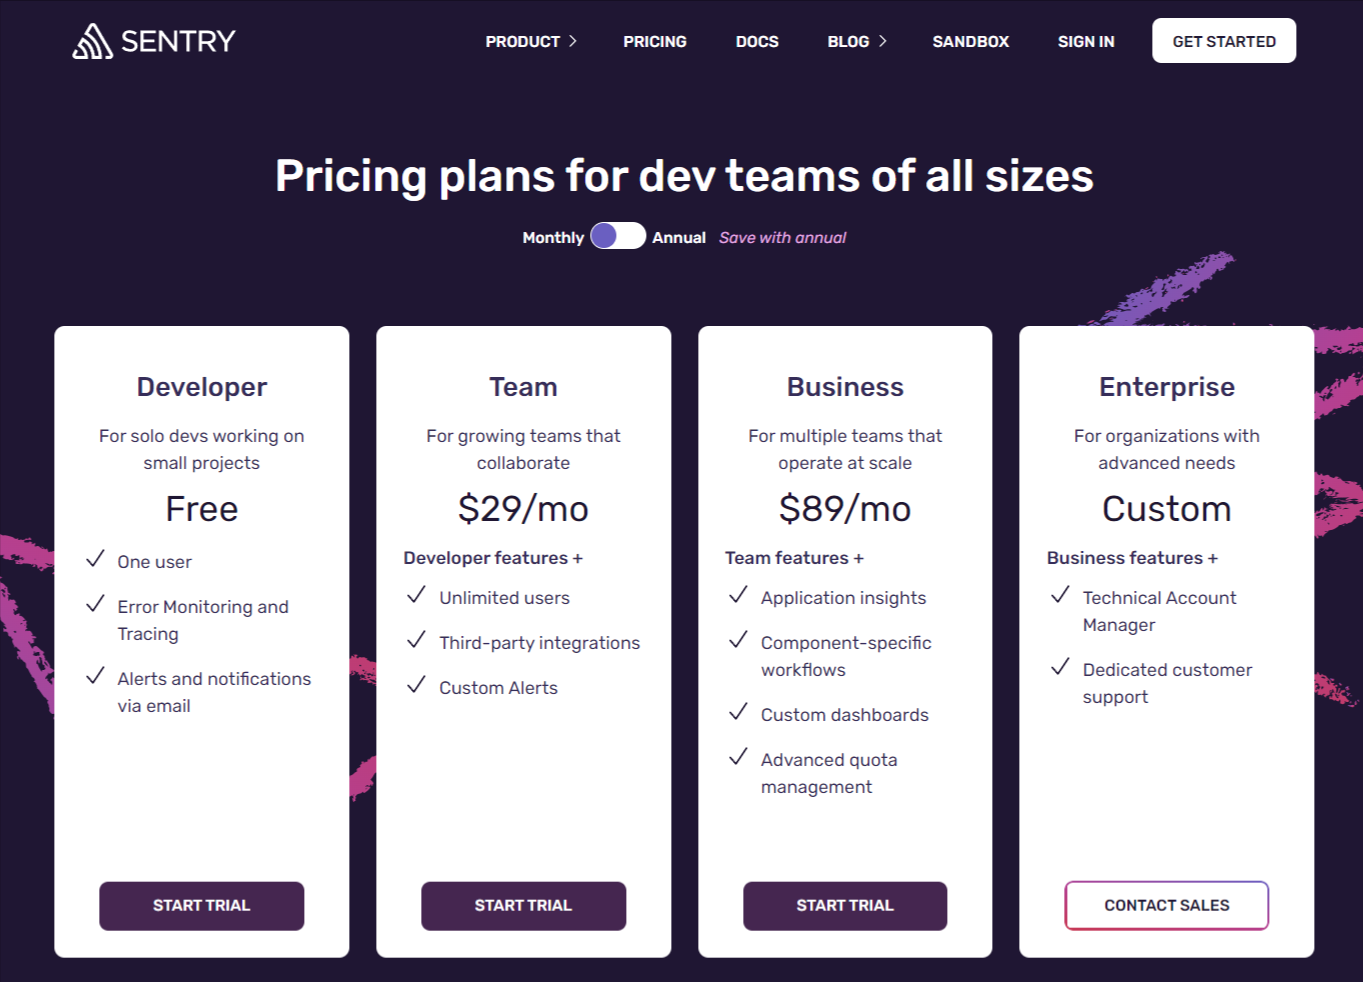
One of Sentry's standout features is its visualization tool, which allowed me to foresee expenses upfront and avoid surprises by month-end. Additionally, I appreciate their spike protection feature, which prevented accidental overspending.
Datadog:
When I first started using Datadog, I found its pricing structure a bit complex. Datadog's pricing is divided into three major categories:
- Host-Based Pricing: This charges based on the number of hosts you monitor.
- Volume-Based Pricing: This charges based on the volume of data ingested, such as logs and traces.
- User-Based Pricing: This charges based on the number of users accessing Datadog.
While these models are straightforward, each has its exceptions and add-ons that can complicate things.
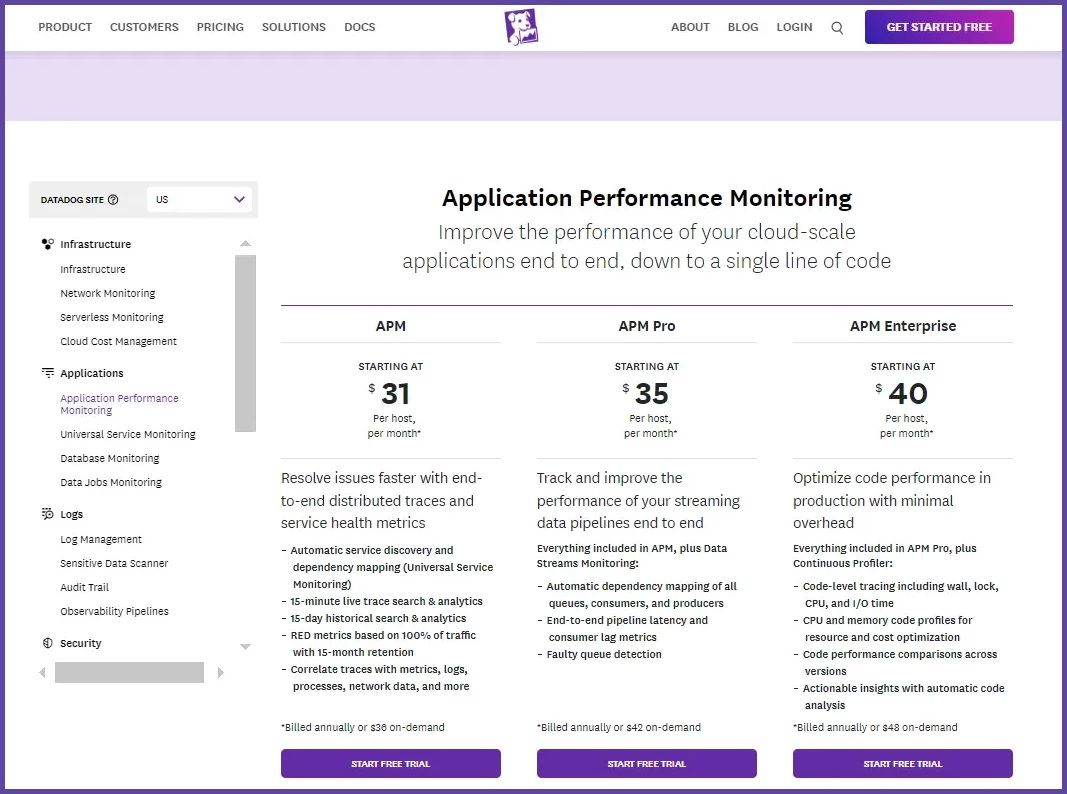
Each Datadog product, like APM, logs, or infrastructure monitoring, has its own pricing, which made it tricky to calculate the exact expenses. Due to the difficulty in predicting monthly expenses accurately, you might encounter unexpected spikes in your Datadog bill.
Sentry's pricing based on clear monthly rates, along with a 14-day free trial, made cost prediction straightforward. However, in my experience, navigating Datadog's pricing complexity across different products often resulted in unexpected spikes in expenses, making cost management and forecasting more challenging.
Atatus - An Alternative to Datadog and Sentry
Atatus is a comprehensive Observability solution that provides an excellent alternative to Datadog and Sentry. Atatus unified platform includes Application Performance Monitoring, Infrastructure Monitoring, Database Monitoring, Logs Monitoring, Real User Monitoring, API Analytics, and Uptime Monitoring (Synthetics).
Atatus Application Performance Monitoring (APM) offers in-depth insights into your applications, allowing you to pinpoint performance bottlenecks, resolve issues, and enhance your services. Atatus APM ensures optimal performance and user experience for your applications.
Atatus APM offers the following features:
- Transaction Performance Monitoring
- Database Monitoring
- Network Performance Monitoring
- API Failures Monitoring
- Error Monitoring
- Deployment Tracking

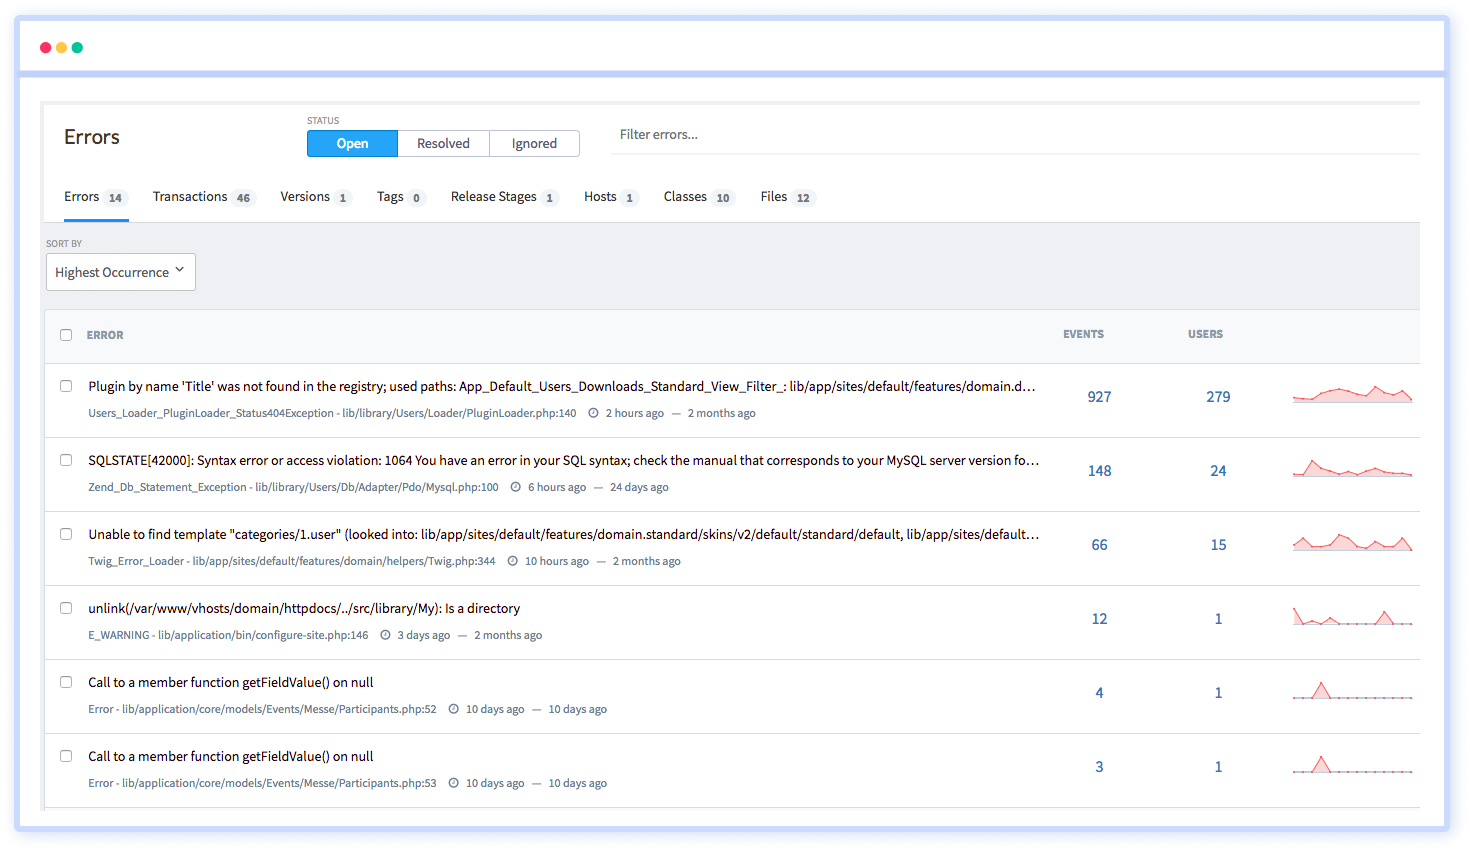
Atatus allows you to monitor and resolve errors in real-time, providing complete visibility into errors and allowing you to maintain high-speed development without compromising user experience.
With Atatus, you can access full stack traces, telemetry, and error context seamlessly mapped to your source code.
Key Features of Atatus includes,
- Comprehensive Observability: Atatus combines Metrics, Logs, and Traces in one platform for holistic visibility.
- Advanced Error Tracking: Pinpoints backend errors to exact code locations, facilitating quick resolution.
- User-Friendly Interface: Intuitive setup and easy-to-navigate interface reduce complexity.
- Transparent Pricing: No hidden costs or special pricing for custom metrics.
- Free Trial: Explore features risk-free with a 14-day trial.
Atatus empowers teams to focus on delivering exceptional user experiences without operational overhead, making it an ideal choice for modern observability needs. Don't just take my word for it - listen to what our customers have to say. Look at these G2 reviews.
#1 Solution for Logs, Traces & Metrics
APM
Kubernetes
Logs
Synthetics
RUM
Serverless
Security
More



![New Relic vs Splunk - In-depth Comparison [2025]](/blog/content/images/size/w960/2024/10/Datadog-vs-sentry--19-.png)
![New Relic vs Sentry - Which Monitoring Tool to Choose? [2025]](/blog/content/images/size/w960/2024/10/VS--1-.png)