Datadog vs Prometheus | A Comparison
Imagine you're managing an e-commerce website that experiences occasional performance issues, resulting in slow page loading times and irregular outages. Without a monitoring tool, you're left in the dark about the root cause of these disruptions, leading to frustrated customers, lost sales, and damage to your brand reputation. Your team struggles to troubleshoot the problem, but without visibility into the infrastructure and application performance, they struggle to identify and resolve the issue efficiently.
This is where monitoring tools like Datadog and Prometheus come into play. Datadog provides full-stack observability for modern applications with cloud-scale monitoring and analytics. It offers monitoring, alerting, and visualization capabilities for infrastructure, applications, logs, and traces, helping organizations optimize performance, troubleshoot issues, and deliver better user digital experiences.
Open-source monitoring and alerting toolkit Prometheus collects and analyzes time-series data. You can collect and store metrics from various systems and applications, query the data using PromQL, and set up alerts to notify you of exceptions or performance degradation. With Prometheus' powerful querying and alerting capabilities, you can pinpoint issues quickly and take proactive measures to ensure the reliability and performance of your infrastructure and applications.
Let's compare Datadog vs Prometheus across the specified features.
- Data Collection
- Data Visualization
- Full Stack Observability
- Set Up
- Documentation and Support
- Pricing
- Comparison Table
1. Data Collection
Datadog: Datadog uses pre-built connectors to assist in data collection from various sources within your infrastructure and applications. These connectors, also known as agents, are lightweight software components deployed across your environment to gather metrics, logs, traces, and other telemetry data. With pre-built connectors, Datadog simplifies the data collection process, allowing users to quickly onboard new data sources without extensive configuration or development effort. These connectors are designed to integrate with popular technologies and services, providing out-of-the-box support for cloud platforms, containers, databases, networking devices, and more.
Prometheus: Prometheus uses exporters as its primary mechanism for data collection. Exporters are specialized software components that expose metrics in a format that Prometheus can scrape and ingest. Unlike pre-built connectors, exporters require manual configuration and deployment to instrument endpoints and expose metrics endpoints. Prometheus users must identify and install the appropriate exporters for each data source they wish to monitor, which may involve additional setup and management overhead. While exporters offer flexibility and customization options, they require more effort to implement than Datadog's pre-built connectors.
In data collection among Datadog vs Prometheus - Datadog Wins
Datadog wins in this feature due to its pre-built connectors, offering simplicity and ease of use for data collection.
Why not Prometheus?While flexible, Prometheus's use of exporters requires more manual configuration and management, making it less user-friendly and more complex for users without extensive technical expertise.
2. Data Visualization
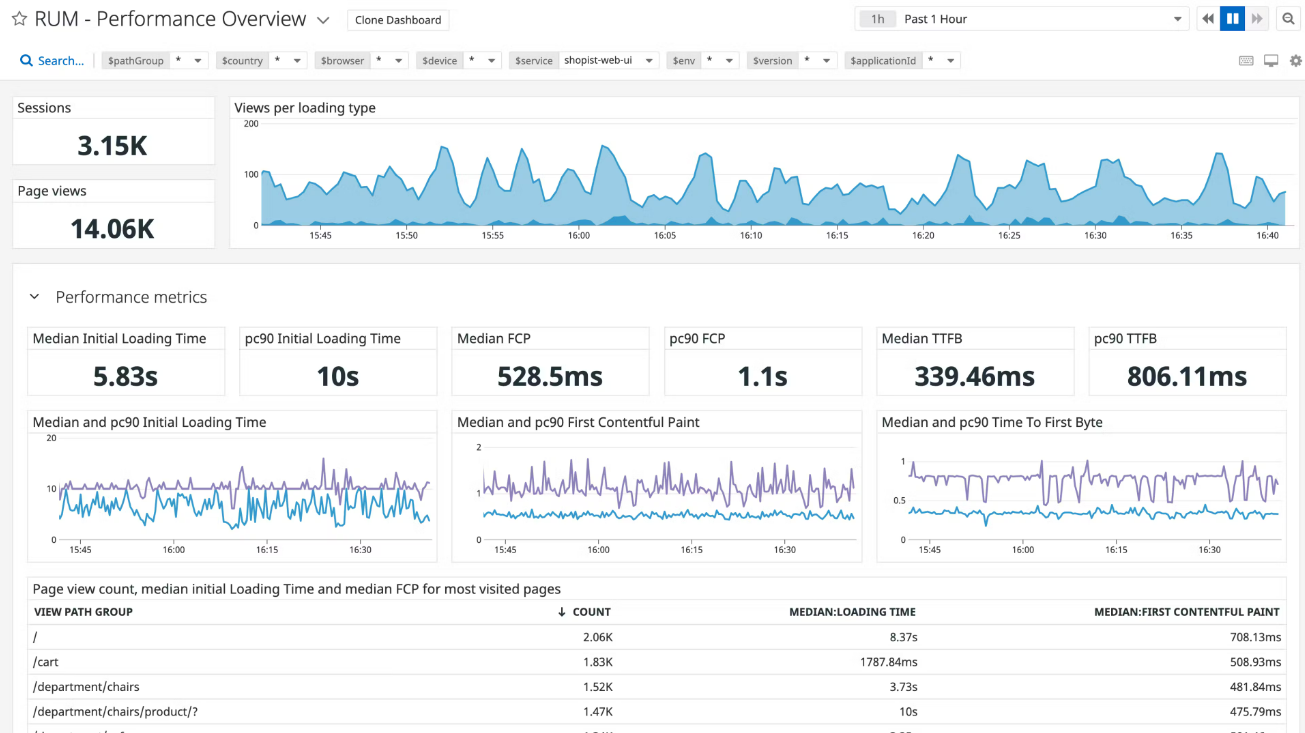
Datadog: Datadog offers both pre-built and custom visualizations, providing a wide range of options to visualize their monitoring data. With pre-built visualizations, users can quickly create charts, graphs, and dashboards using built-in templates customized to common use cases and metrics. Additionally, Datadog allows for customization, enabling users to design their own visualizations using a drag-and-drop interface and a variety of chart types, styles, and widgets. This flexibility allows users to customize visualizations to their specific monitoring needs and preferences, whether they're monitoring infrastructure metrics, application performance, or business KPIs.
Prometheus: Prometheus features a built-in expression browser for visualizing time-series data directly within the Prometheus web interface. Users can write PromQL queries to explore and analyze metrics data and view the results as graphs and charts. While the expression browser provides basic visualization capabilities, it lacks the extensive customization options and pre-built templates Datadog offers. Users may need to invest more time and effort into crafting and refining their visualizations using PromQL queries, which can be challenging for users unfamiliar with the query language or lacking visualization expertise.
In data visualization among Datadog vs Prometheus - Datadog Wins
Datadog wins in this feature due to its combination of pre-built and custom visualizations, offering versatility and ease of use.
Why not Prometheus?Prometheus's reliance on a built-in expression browser provides basic visualization capabilities but lacks the extensive customization options and pre-built templates offered by Datadog, making it less user-friendly and adaptable.
3. Full Stack Observability
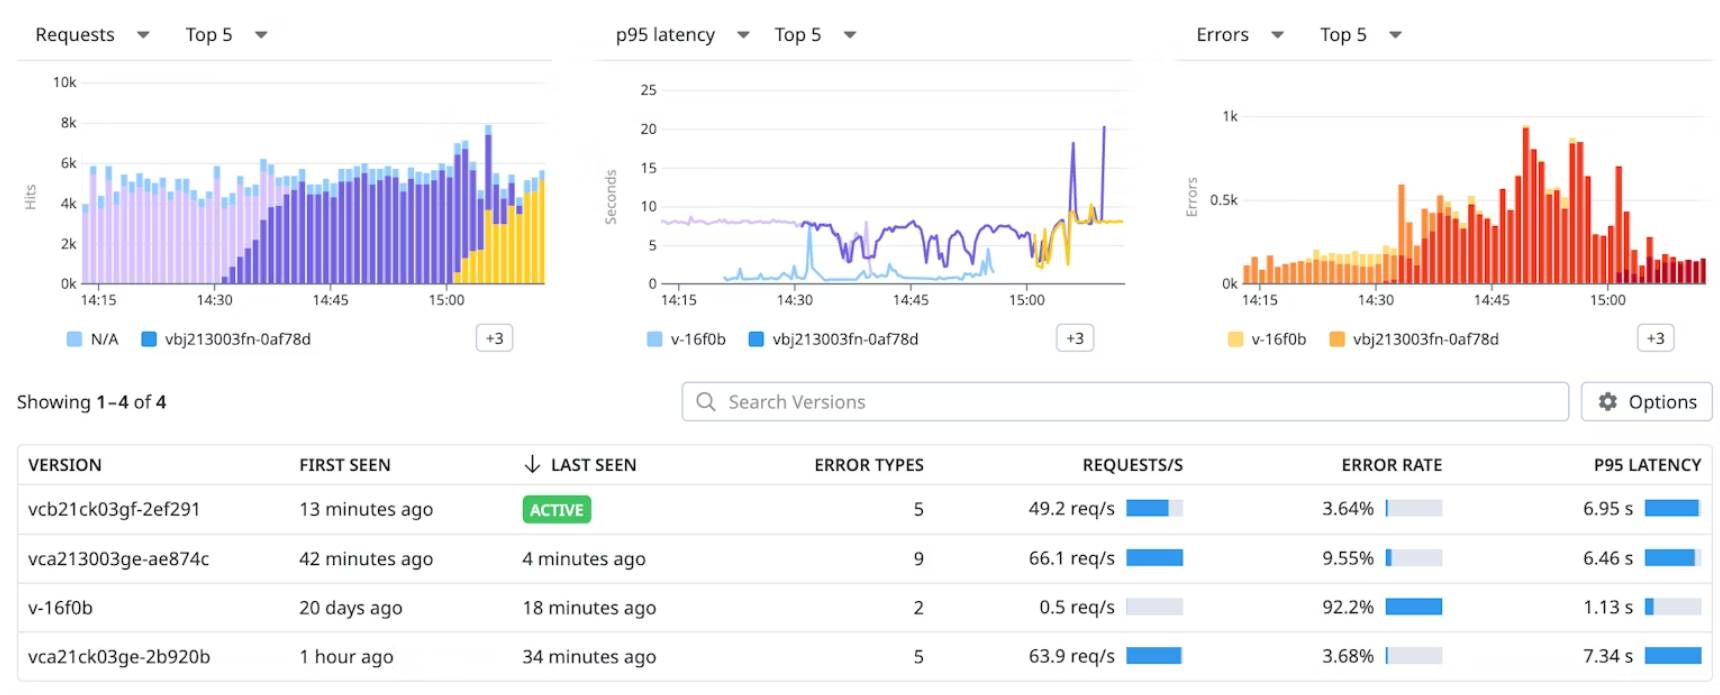
Datadog: Datadog provides complete, full-stack monitoring capabilities. Its agents, deployed throughout the infrastructure, continuously collect and analyze telemetry data. This offers users a holistic understanding of system performance, application behavior, and operational metrics. Datadog's Full Stack Observability empowers proactive issue detection and rapid incident response, ensuring organizations maintain the reliability and availability of their digital services.
Prometheus: Prometheus uses a pull-based model for real-time monitoring, where it periodically scrapes metrics from instrumented endpoints at defined intervals. This model allows Prometheus to gather metrics with minimal delay, providing near real-time visibility into system health and performance. However, due to the inherent latency introduced by the pull-based approach, Prometheus may not offer the same level of real-time monitoring capabilities as Datadog, particularly for environments requiring highly responsive and low-latency monitoring.
In full stack observability among Datadog vs Prometheus - Datadog Wins
Datadog wins in this feature due to its provision of real-time monitoring capabilities with low-latency data ingestion and processing
Why not Prometheus?Prometheus's reliance on a pull-based real-time monitoring model introduces latency, potentially impacting its effectiveness in scenarios requiring immediate and low-latency monitoring.
4. Set Up
Datadog: Datadog offers a cloud-based Software-as-a-Service (SaaS) solution for deployment, providing users with a hassle-free and fully managed monitoring platform. With Datadog's cloud-based deployment model, users can quickly sign up for an account, configure their monitoring settings, and start collecting and analyzing telemetry data without the need for manual setup or infrastructure provisioning. Datadog handles the management of servers, databases, and other underlying infrastructure components, allowing users to focus on monitoring their systems and applications rather than managing the monitoring platform itself. This deployment approach offers scalability, reliability, and ease of use, for organizations seeking a streamlined monitoring solution.
Prometheus: Prometheus, primarily distributed as open-source software, requires manual download and installation for deployment. Users must download the Prometheus binary and configure it to run on their infrastructure, which may involve setting up servers, databases, and other dependencies. While Prometheus provides flexibility and control over deployment configurations, it requires users to manage and maintain the monitoring infrastructure, including updates, patches, and scaling. This manual deployment approach can be time-consuming and complex, particularly for organizations lacking dedicated DevOps or infrastructure teams.
In set up among Datadog vs Prometheus - Datadog Wins
Datadog wins in this feature because its cloud-based SaaS solution offers a hassle-free and fully managed deployment experience.
Why not Prometheus?Prometheus's manual download and installation process requires users to handle deployment and maintenance tasks themselves, making it more complex and time-consuming.
5. Documentation and Support
Datadog: Datadog provides complete documentation along with email and chat support to assist users in utilizing its platform effectively. The documentation covers various topics, including setup instructions, configuration guides, API references, and troubleshooting tips. Additionally, users can contact Datadog's support team via email for assistance with various questions or issues they encounter. The combination of extensive documentation and responsive support channels makes sure that users have access to the resources and assistance they need to maximize the value of the Datadog platform and address any challenges they may encounter.
Prometheus: Prometheus offers documentation and community support to assist users in deploying and using the monitoring toolkit. The documentation includes installation guides, configuration references, and usage examples to help users get started with Prometheus. Additionally, Prometheus benefits from an active user community, where users can search for help, share knowledge, and collaborate on troubleshooting efforts. While Prometheus lacks dedicated support channels like email or chat, its community-driven support model provides valuable resources and assistance to users through forums, mailing lists, and online communities.
In documentation and support among Datadog vs. Prometheus - Datadog Wins
Datadog wins in this feature due to its documentation and dedicated email and chat support, providing users with robust resources and personalized assistance.
Why not Prometheus?Prometheus relies on documentation and community support, which may not offer the same level of responsiveness or personalized assistance, making it less user-friendly for those needing direct support.
6. Pricing
Datadog: Datadog operates on a cloud-based pricing model, where users pay for the services they consume based on usage metrics such as the volume of data ingested, the number of monitored hosts, and additional features utilized. It offers various pricing plans customized to different use cases and requirements, with pricing based on the functionality and support required. While Datadog's pricing structure involves a monetary cost, it provides users with a feature-rich monitoring platform and dedicated support and maintenance services.
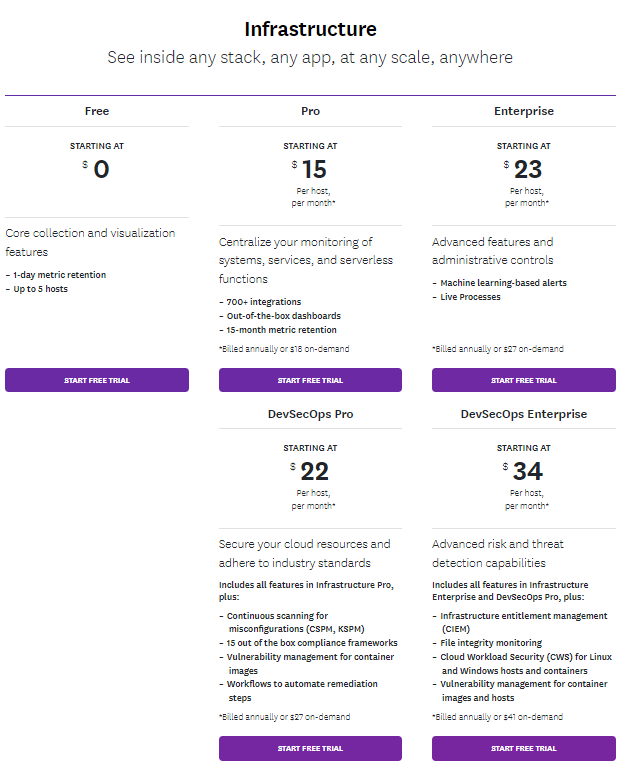
Prometheus: In contrast, Prometheus follows an open-source and free pricing model. Users can download, install, and use Prometheus without any licensing fees or subscription costs, making it a better option for organizations seeking a cost-effective monitoring solution. However, while Prometheus itself is free to use, users may still incur expenses associated with infrastructure, maintenance, and support, particularly for managing and scaling the monitoring environment.
In pricing among Datadog vs Prometheus - Prometheus Wins
Prometheus wins in pricing against Datadog due to its open-source nature, offering free access and community-driven development..
Why not Datadog?Datadog costs money to use, while Prometheus is free. This can make Datadog less attractive for people or organizations looking for cheaper options.
Comparison Table
Let's see the comparison of Prometheus monitoring vs Datadog in review table.
| Feature | Datadog | Prometheus |
|---|---|---|
| Data collection | ⭐️⭐️⭐️⭐️⭐️ | ⭐️⭐️ |
| Data visualization | ⭐️⭐️⭐️⭐️⭐️ | ⭐️ |
| Full Stack Observability | ⭐️⭐️⭐️⭐️⭐️ | ⭐️ |
| Set Up | ⭐️⭐️⭐️⭐️⭐️ | ⭐️⭐️ |
| Documentation | ⭐️⭐️⭐️⭐️⭐️ | ⭐️⭐️⭐️⭐️⭐️ |
| Pricing | ⭐️⭐️ | ⭐️⭐️⭐️⭐️ |
Conclusion
In summary, the choice between Prometheus vs Datadog depends on your specific requirements, budget, and need for customization and integration.
Why choose Datadog?
- Complete monitoring capabilities covering infrastructure, applications, logs, and more.
- Intuitive interface for easy setup and navigation.
- Powerful visualization tools for quick insights.
- Scalability to support large-scale deployments.
- Consistent integration with a wide range of tools and services.
Why choose Prometheus?
- Free and open-source, offering cost-effective monitoring solutions.
- Highly customizable, allowing users to tailor monitoring setups to their specific needs.
- Community-driven development, fostering continuous improvement and innovation.
- Scalable architecture, capable of handling large-scale deployments without additional costs.
- Extensive ecosystem with integrations for various platforms and services.
Whether you choose Datadog or Prometheus depends on your individual preferences, priorities, and technical capabilities. If you're looking for a hassle-free, out-of-the-box solution, Datadog offers convenience and simplicity.
However, if you prefer a more hands-on approach and value flexibility and control, Prometheus allows you to customize your monitoring environment to suit your unique needs. The choice between Prometheus vs Datadog comes down to finding the right balance between convenience and customization that aligns with your monitoring goals.
Why choose Atatus over Datadog and Prometheus?
Atatus stands out as a top choice over Prometheus monitoring vs Datadog, offering a Full Stack Observability Platform that lets you review problems as if they happened in your application. Instead of guessing why errors happen or asking users for screenshots and log dumps, Atatus lets you replay the session to quickly understand what went wrong.
We offer Application Performance Monitoring, Real User Monitoring, Server Monitoring, Logs Monitoring, Synthetic Monitoring, Kubernetes Monitoring, Container Monitoring, Serverless Monitoring and API Analytics. It works perfectly with any application, regardless of framework, and has plugins to monitor data from different resources.

Atatus can be beneficial to your business, which provides a comprehensive view of your application, including how it works, where performance bottlenecks exist, which users are most impacted, and which errors break your code for your frontend, backend, and infrastructure.
Atatus offers competitive pricing plans, ensuring cost-effectiveness without compromising on quality.
If you are not yet an Atatus customer, you can sign up for a 14-day free trial.
#1 Solution for Logs, Traces & Metrics
![]() APM
APM
![]() Kubernetes
Kubernetes
![]() Logs
Logs
![]() Synthetics
Synthetics
![]() RUM
RUM
![]() Serverless
Serverless
![]() Security
Security
![]() More
More


![Splunk vs Prometheus: A Side-by-Side Comparison [2025 Guide]](/blog/content/images/size/w960/2024/08/Datadog-vs-sentry--13-.png)