Top Datadog Competitors and Alternatives in 2026
Datadog is widely recognized for its comprehensive range of products and tools, making it quite a challenge to find a suitable alternative. When seeking an alternative to Datadog, it's essential to conduct a thorough comparison of features, performance, limitations, and other vital aspects. This task requires a deep dive into the details, and it might not be as straightforward as it seems at first glance.
This blog is specifically crafted to provide support in this process. Throughout the content, we will review all the features, assessing their practical significance and determining whether they effectively address user needs or they simply are a visual enhancement. We will also examine their comprehensive pricing package because, at the end of the day if we can make a good deal, who isn't happy?
- What does Datadog Do?
- Why Switch to Datadog Altenatives?
- Top 10 Datadog Competitors:
- Summing it Up!
- Why Choose Atatus over other Datadog Alternatives?
What does Datadog Do?
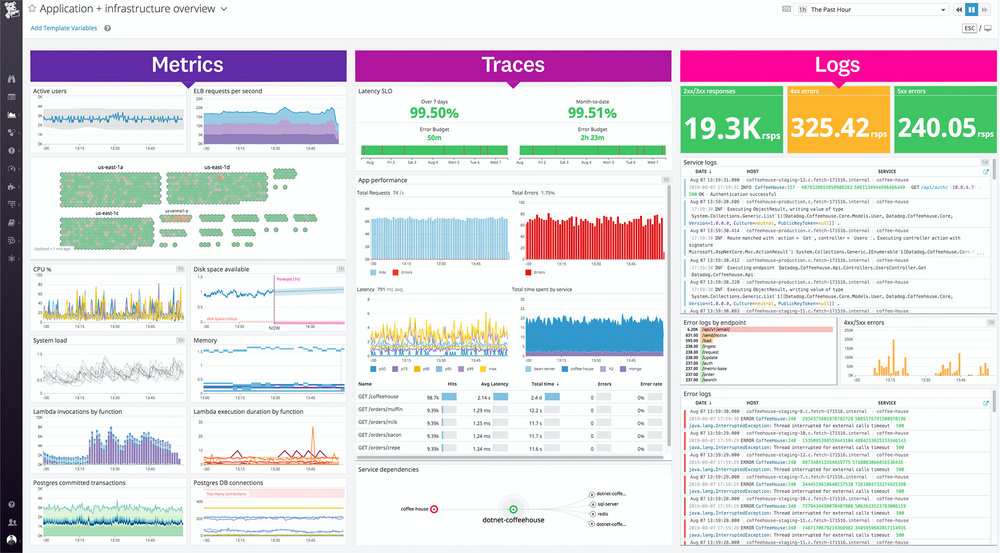
Datadog is an Observability platform specially designed for cloud based applications. It provides comprehensive insights into the infrastructure, logs, and application performance. It also monitors and analyzes databases, tools, and servers. Users can visualize the metrics collected (metrics, logs, and traces) and create customizable dashboards.
Datadog has now expanded a lot, adding AWS, Microsoft Azure, VMWare, Red Hat OpenShift, Google Cloud Platform, Kubernetes, Docker, and OpenStack to its platforms. Currently, Datadog can be integrated with 700 integrations. They are available as Open-Source, and you can access them through the Datadog API keys. Being a cloud based platform, if all the integrations are correctly configured, the data is treated the same, whether it is available online or in a data center.
Datadog Log management captures and sends all your application's log details in real time but without indexing them. The perk is that you can ingest all the log data but then filter out and index only those you absolutely require.
Further, Datadog's APM or Tracing provides granulated insights into the application's performance and behavior. You can monitor request volume, latency, and traces of individual requests. Datadog shows you precise results on what happens to a request once a transaction is passed. Similarly, with Infrastructure Monitoring, Datadog automatically categorizes and tags your servers. You can filter the tags, see stats for any of them in real time, and view them via Host Maps.
Apart from this, it has Network Performance Monitoring, Real User Monitoring (RUM), and Session Replay. We have listed out a detailed comparison on all the features in our Datadog vs New Relic article, you can refer them in case you are planning to zero in on any one of these solutions.
Why Switch to Datadog Alternatives?
The main reasons why users leave Datadog, in a very broad sense, are:
- Cost
- Complexity setting up
- Integration challenges
- Limited customization
- Learning curve
Datadog is a fantastic platform that provides Monitoring and analytics services to businesses and organizations. However, some users have reported encountering pain points while using the platform. For instance, the cost of Datadog can be a concern for some businesses. Datadog can be relatively expensive, especially for large-scale deployments or organizations with a high volume of monitored resources. The pricing model, which is based on the volume of data ingested and the features used, can lead to unexpected costs for some users.
Additionally, configuration and customization can be tricky for some users. Setting up and configuring Datadog, particularly for complex environments, can be challenging. Users may find it difficult to navigate the various features and customize the platform to their specific needs.
Datadog's comprehensive feature set may result in a steep learning curve for new users.
Understanding the platform's capabilities might take time. Although Datadog provides a wide range of features, some users may find its customization options to be limited. For example, advanced users may want more flexibility in creating custom dashboards or defining complex alerting conditions.
While Datadog integrates with many technologies and services, it is possible that users can face difficulty with certain proprietary or less commonly used systems.
Finally, some users have expressed concerns about the reliability and accuracy of Datadog's data collection, which can impact the effectiveness of the analytics and monitoring tools. However, we will not pursue this point because it would be downplaying their effort. Despite these challenges, Datadog remains a powerful tool for those who can navigate its complexities and unlock its full potential.
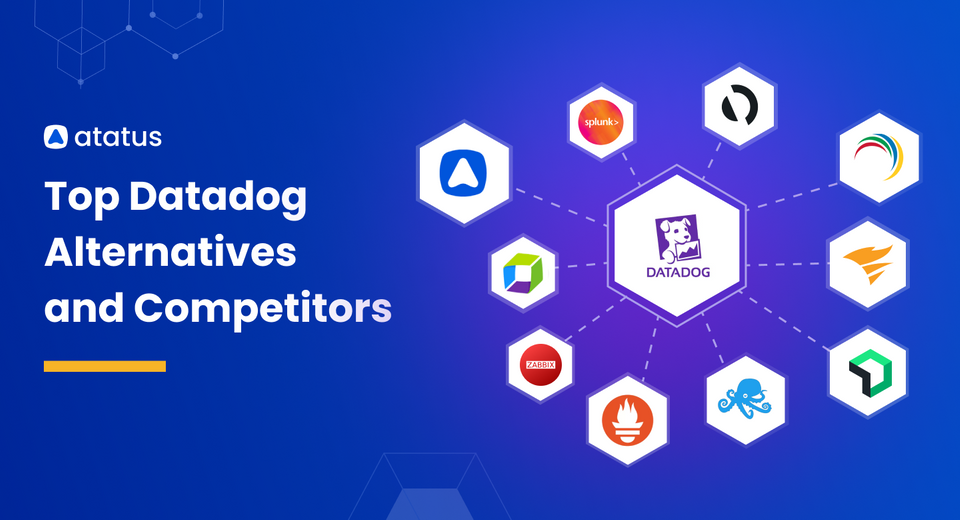
Top 10 Datadog Competitors:
1. Atatus
Atatus is a full-stack monitoring and observability platform. It is an all-in-one observability platform that combines Monitoring, tracing, and error reporting, eliminating the need for separate visualization tools. With its easy-to-set-up and intuitive interface, it captures every minute's metrics of your application platform.
Atatus provides a user-friendly alternative to similar tools with easy installation and minimal configuration, such as Datadog, Prometheus, Nagios, etc. You can take control of your application's performance and swiftly identify and resolve issues to ensure peak efficiency with Atatus set up in your environment.
Atatus supports a range of programming languages, including Java, PHP, Node.js, Ruby, Python, and React. Along with this, tools such as Slack, Jira, GitLab, Asana, PagerDuty, Codeship, VictorOps, and others are all integrated with Atatus. Additionally, the Atatus APM integration allows for seamless server and application monitoring.
Atatus auto-instruments your app code, reducing dev workload. You can get intelligent alerts with real-time anomaly detection and customizable dashboards to stay ahead of any errors or issues. Plus, their flexible pricing options are an added advantage.
Atatus Features
Discover the wide range of features provided by Atatus Monitoring Tool:
- Application Performance Monitoring feature gives you deep visibility into the performance of your application's components, such as databases, third-party services, and other infrastructure components. It enables you to identify and resolve issues quickly before they impact your users.
- Real User Monitoring provides full visibility into AJAX requests, showing individual metrics for each network call, including response times, transfer sizes, and errors. It tracks API throughput, measuring the rate at which requests are processed by the API.
- Infrastructure Monitoring feature provides real-time visibility into the health and performance of your servers, containers, and other infrastructure components. This feature helps you identify and resolve issues before they impact your users.
- Synthetic Monitoring is a feature that tests your applications from various locations and devices to simulate real-world user experiences. Multistep API tests check all API endpoints in your application and identify potential performance issues.
- Logs Monitoring collects and analyzes logs from various sources, including applications, servers, and other infrastructure components. It helps identify real-time errors, performance issues, and other critical events.
- API Analytics collects usage data, including user identification and utilization patterns, revealing how products or services are used. It includes metrics such as response time, external and database counts.
- Kubernetes Monitoring offers comprehensive insights into your Kubernetes environment, covering cluster metrics, pod metrics, and Kubernetes events metrics. Gain visibility into pod health, container status, resource consumption, and trace events to ensure optimal performance and availability. Along with all this, you can also access APM driven session traces.
- Serverless Monitoring involves automatically capturing logs, metrics, and traces from your serverless applications. It provides crucial metrics on execution duration, invocation count, and error rates, allowing you to pinpoint bottlenecks and optimize them easily.
- Docker Monitoring automatically discovers containers and provides real-time insights with traces, metrics, logs and image details of each container. Apart from this you can view general metrics on resource utilization, inbound and outbound traffic, swap memory and more.
2. AppDynamics
AppDynamics is a cloud-based application performance monitoring and analytics platform that monitors and manages your system and applications in local, cloud, or hybrid environments. It provides visibility into the performance of infrastructure, applications and user experience. It monitors key metrics such as response time, throughput, error rate, and resource utilization across distributed environments.
One of AppDynamics's key features is its Application Performance Monitoring (APM) capabilities. These provide deep insights into the performance of applications and microservices, allowing organizations to trace transactions across distributed systems, identify code-level performance issues, and find out the impact of application performance on business metrics. With APM, organizations can proactively detect and resolve performance issues before they impact end users.
In addition to APM, AppDynamics offers several other products and features to address different aspects of application monitoring and management. End User Monitoring (EUM) enables organizations to monitor and analyze user interactions with their applications in real-time, including page load times, click paths, and error rates, helping organizations optimize their applications' usability and performance.
AppDynamics Infrastructure Monitoring provides visibility into the performance and health of infrastructure components such as servers, databases, and networks. Their Business Analytics Platform tracks key business metrics such as revenue, conversion rates, and customer satisfaction, which helps IT firms with business objectives and prioritize efforts to maximize ROI.
AppDynamics leverages machine learning and AI-driven analytics to provide intelligent alerting and anomaly detection capabilities. With this, you can set thresholds and monitor breaches anytime.
3. Manage Engine
ManageEngine is a comprehensive suite of IT management software solutions designed with a focus on simplicity. They offer products, including network monitoring, server management, help desk ticketing, and more.
One of the key products in the ManageEngine lineup is OpManager, a network monitoring solution. OpManager offers features such as network discovery, bandwidth monitoring, performance analysis, and customizable alerts, enabling IT teams to identify and address network issues proactively.
Another flagship product is ServiceDesk Plus, a comprehensive IT service management (ITSM) solution that helps organizations streamline their help desk operations and improve service delivery. ServiceDesk Plus offers features such as incident management, problem management, change management, asset management, and self-service portals, empowering IT teams to efficiently manage and resolve IT issues while enhancing user satisfaction.
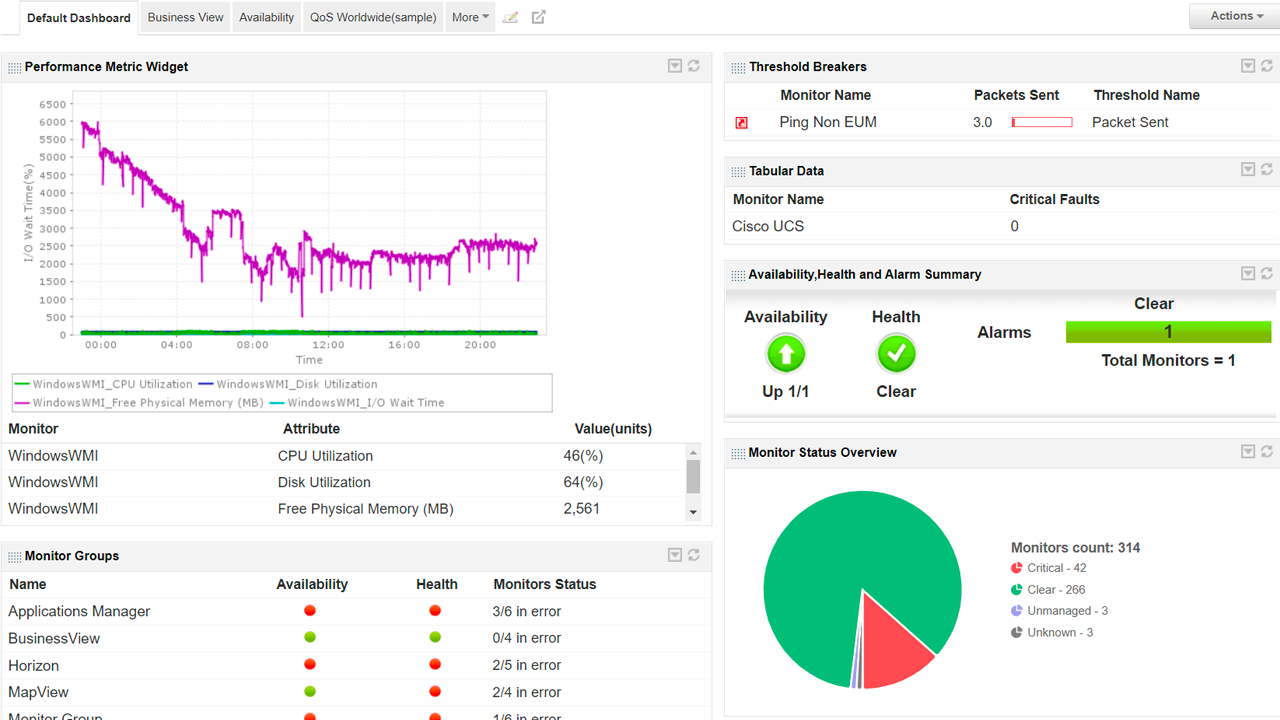
ManageEngine also offers solutions for server management, such as Applications Manager, which provides end-to-end Monitoring and performance management for applications, servers, and databases. Applications Manager offers features such as server monitoring, application performance monitoring (APM), database monitoring, and synthetic transaction monitoring, helping IT teams ensure the optimal performance and availability of critical business applications.
In addition to network and server management, ManageEngine provides solutions for endpoint management, security management, identity and access management, and more.
4. SolarWinds
SolarWinds' suite of products covers a wide range of functions, including Network Monitoring, Server Monitoring, Application Monitoring, and Database management.
SolarWinds Network Performance Monitor (NPM) monitors the performance and availability of their network infrastructure. It provides real-time insights into network health, bandwidth usage, and device performance. NPM includes features such as network mapping, custom alerts, and deep packet inspection for troubleshooting network issues efficiently.
SolarWinds Server & Application Monitor (SAM) monitors the performance of servers and applications across hybrid environments and provides visibility into server health, resource utilization, and application performance metrics.
SolarWinds Database Performance Analyzer (DPA) helps users optimize their databases' performance. It provides insights into SQL query performance, database wait times, and resource utilization. DPA offers real-time Monitoring, historical analysis, and recommendations for improving database performance and efficiency.
SolarWinds Service Desk streamlines service delivery and support processes. It offers incident management, change management, asset management, and self-service portal capabilities and integrates with other SolarWinds products for seamless IT operations management.
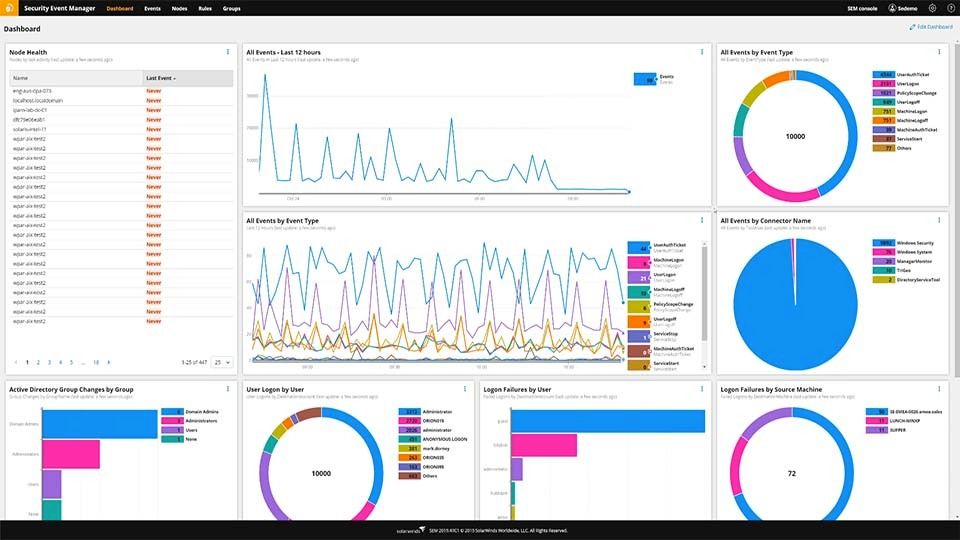
SolarWinds Security Event Manager (SEM) provides real-time threat detection, security analytics, and log management capabilities. SEM consolidates security logs from across the network and offers advanced correlation and analysis features for threat detection and incident response.
5. Sematext
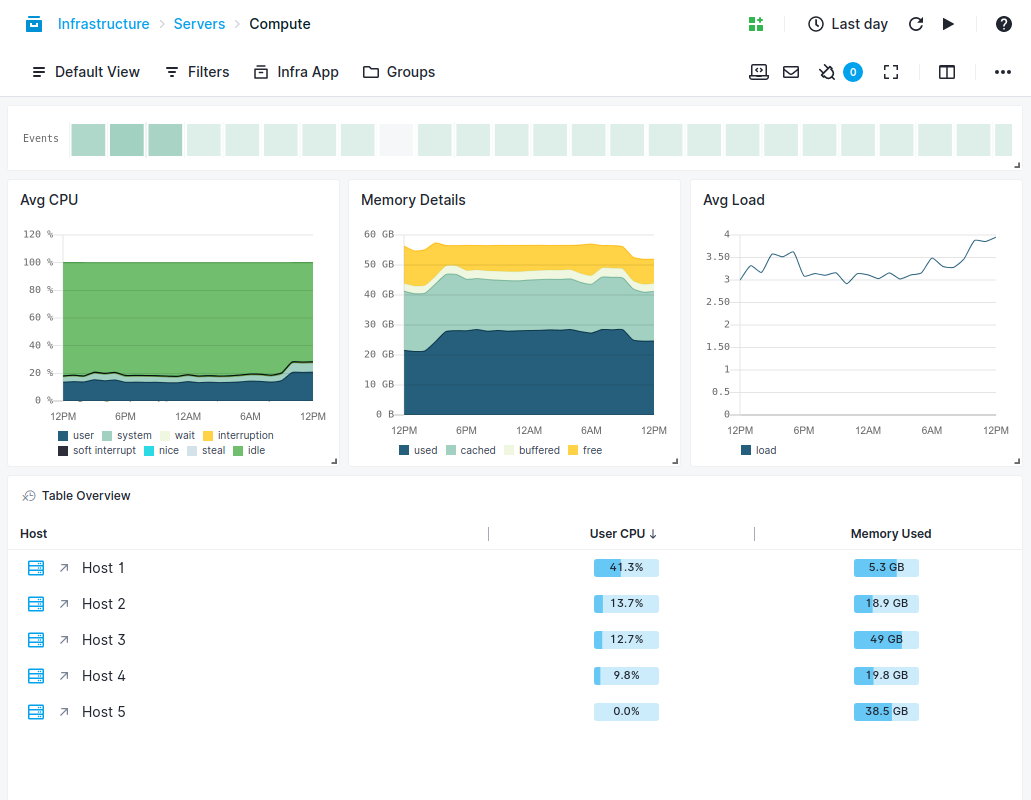
Sematext is a comprehensive observability platform designed to help organizations monitor, troubleshoot, and optimize their applications and infrastructure. With a suite of integrated products, Sematext offers lots of products for modern IT environments.
One of Sematext's flagship products is Sematext Cloud, a fully managed observability platform that provides Monitoring, logging, and tracing capabilities. With Sematext Cloud, users can collect and analyze metrics, logs, and traces from their applications and infrastructure in real time. Sematext Cloud also includes comprehensive logging capabilities, allowing users to aggregate, analyze, and correlate logs from various sources, with support for structured and unstructured logs, as well as full-text search and filtering capabilities.
In addition to monitoring and logging, Sematext offers distributed tracing capabilities through its Tracer product. We have covered this under Distributed Tracing Tools; check it out!
Sematext also provides specialized solutions for specific use cases and technologies. For example, Sematext offers solutions for monitoring Kubernetes clusters, Docker containers, and serverless architectures. These specialized solutions provide deep visibility into the performance and health of these environments, helping organizations ensure the reliability and scalability of their containerized and cloud-native applications.
6. Prometheus
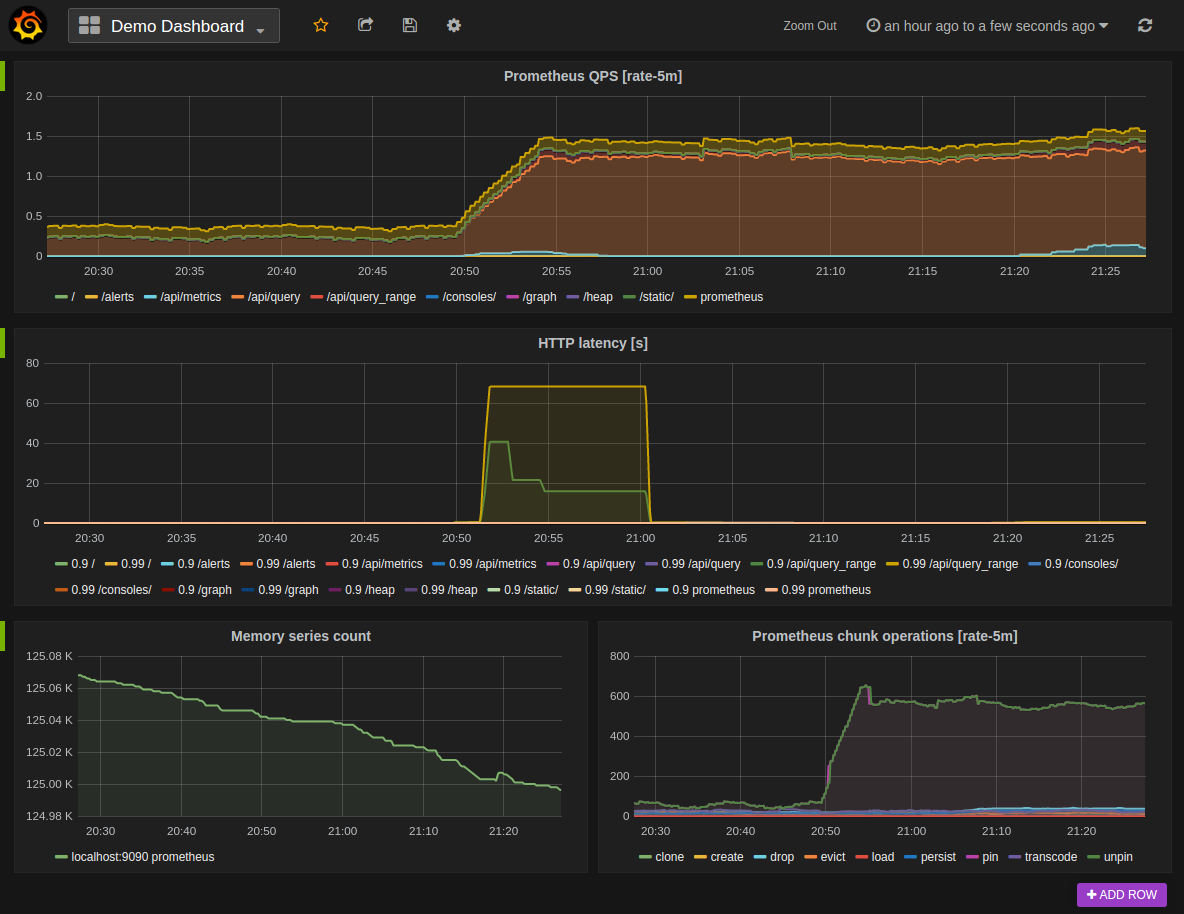
Prometheus is an open-source monitoring and alerting toolkit originally built at SoundCloud and now maintained by the Cloud Native Computing Foundation (CNCF). It offers a comprehensive set of features for monitoring both infrastructure and applications, making it a popular choice for organizations adopting containerized and microservices architectures.
At its core, Prometheus collects time-series data through a pull-based model, where it periodically scrapes metrics from instrumented targets such as servers, containers, databases, and applications and stores These metrics are stored in a time-series database optimized for high ingestion rates and efficient querying. To complement its core monitoring capabilities, Prometheus easily integrates with several tools—for example, Grafana for visualization, Thanos for long-term storage, etc.
One of Prometheus's key features is its powerful querying language, PromQL, which enables users to perform complex queries and aggregations on collected metrics. PromQL supports a wide range of functions for filtering, grouping, and manipulating time-series data, allowing users to gain deep insights into their systems' performance and behavior.
Prometheus offers robust alerting capabilities, allowing users to define alerting rules based on predefined thresholds or custom conditions. When an alert is triggered, Prometheus can send notifications via various channels such as email, PagerDuty, or Slack, enabling timely response to incidents and anomalies.
7. Zabbix
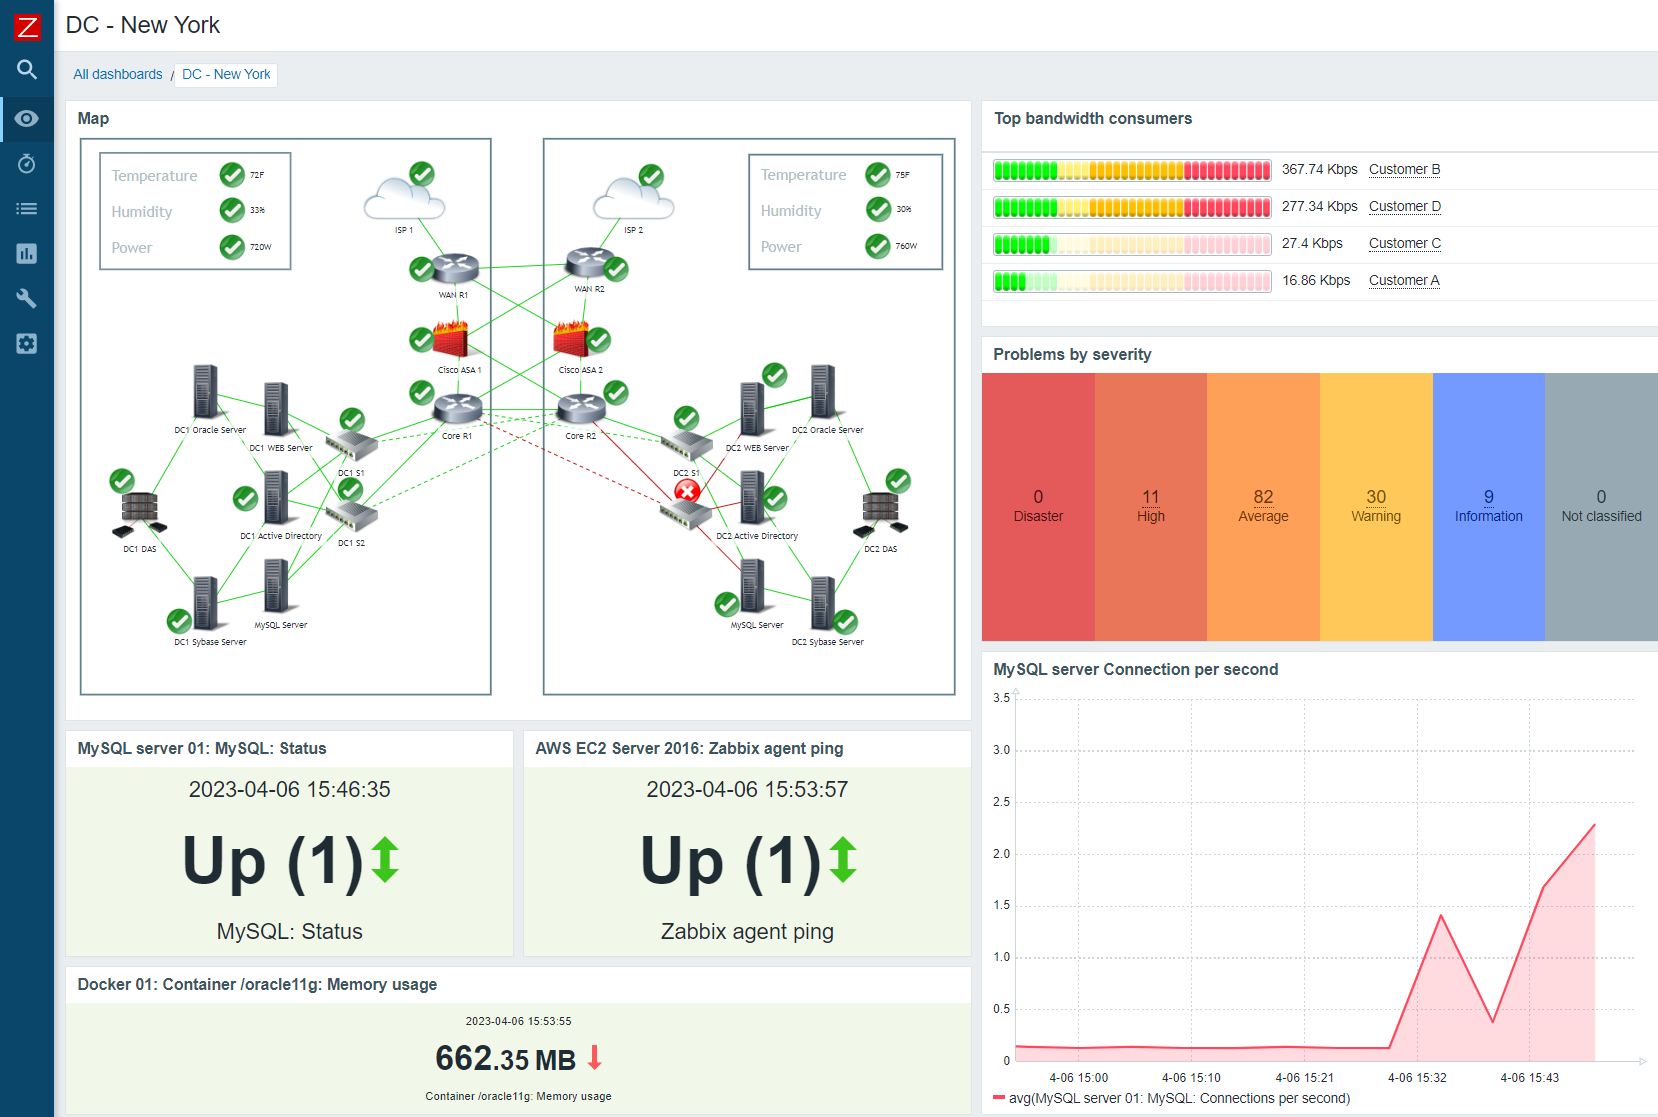
Zabbix is an open-source, cloud-based monitoring software suite that monitors and manages IT resources like servers, virtual machines, networks, and applications. Zabbix supports both agent-based and agentless Monitoring, which allows users to choose the most suitable approach for their environment.
Zabbix includes auto-discovery capabilities that automatically detect and add new devices to the monitoring system. It is designed to scale automatically from small environments to large distributed infrastructures and integrates with some third-party systems and technologies, such as VMware, AWS, Docker, and more.
Zabbix offers robust alerting functionality to help you encounter any threshold breaches. When an issue is detected, Zabbix sends notifications via email, SMS, or other channels to alert administrators and stakeholders, ensuring timely response to incidents.
In addition to its core monitoring capabilities, Zabbix offers several products and extensions that enhance its functionality:
- The Zabbix Agent is a lightweight monitoring agent that runs on monitored devices to collect performance data and send it to the Zabbix server for processing.
- Zabbix Proxy is a component that can be deployed in remote locations to collect monitoring data on behalf of the Zabbix server. It helps reduce network traffic and improve scalability in distributed environments.
- Zabbix offers specialized templates and modules for monitoring network devices like switches, routers, and firewalls. These modules provide out-of-the-box Monitoring for common network protocols and services.
- The Zabbix API allows users to interact with the Zabbix server programmatically, enabling automation and integration with other systems and tools.
8. Splunk
Splunk is a leading platform for Monitoring, searching, analyzing, and visualizing machine-generated data. The Splunk Enterprise platform enables users to collect, index, and search large volumes of data from diverse sources in real time. It provides powerful search capabilities, allowing users to quickly find and analyze data to gain insights into their systems, applications, and business operations. Splunk Enterprise supports a wide range of data types, including logs, metrics, events, and more, making it a versatile solution for Monitoring and troubleshooting.
In addition to Splunk Enterprise, Splunk offers several specialized products to address specific use cases and requirements. One such product is Splunk IT Service Intelligence (ITSI), which provides advanced analytics and insights for IT operations. ITSI leverages machine learning and predictive analytics to detect and prioritize incidents, helping organizations improve the performance and availability of their IT services.
Another key offering from Splunk is Splunk Cloud, a fully managed cloud service that delivers the capabilities of Splunk Enterprise in a scalable and secure cloud environment. Splunk Cloud allows organizations to offload the burden of managing infrastructure and maintenance tasks, enabling them to focus on deriving value from their data.
Splunk also offers solutions for security and compliance, including Splunk Enterprise Security and Splunk Phantom. These products help organizations detect and respond to security threats in real time, automate security operations, and ensure compliance with regulatory requirements.
Furthermore, Splunk's ecosystem includes a wide range of apps and integrations that extend the platform's capabilities and allow seamless integration with third-party tools and technologies. Splunkbase, the Splunk app marketplace, offers thousands of apps and add-ons developed by Splunk and its community of users, providing additional functionality for Monitoring, analytics, security, and more.
9. New Relic
New Relic is probably the most popular tool in this niche, and I don't think I need to explain how common it is among developers.
New Relic APM provides detailed visibility into application code, transactions, and dependencies, helping organizations identify and troubleshoot performance issues quickly. With features like transaction tracing, error analytics, and distributed tracing, New Relic APM enables developers and operations teams to optimize application performance and deliver better user experiences.
New Relic Infrastructure extends monitoring capabilities to the underlying infrastructure components supporting applications. Integration with cloud platforms like AWS, Azure, and Google Cloud enables seamless Monitoring of hybrid and multi-cloud environments.
New Relic Browser focuses on monitoring web application performance from the end user's perspective. It provides visibility into page load times, JavaScript errors, and user interactions, helping organizations understand how their applications perform across different browsers and devices. The browser also boasts RUM and Synthetic Monitoring capabilities.
New Relic Insights is a powerful analytics platform that allows organizations to analyze and visualize data from across their entire technology stack. It provides custom dashboards, advanced querying capabilities, and real-time alerts, empowering teams to gain actionable insights into application performance, infrastructure health, and user behavior. With New Relic Insights, organizations can make data-driven decisions and drive continuous improvement across their digital business.
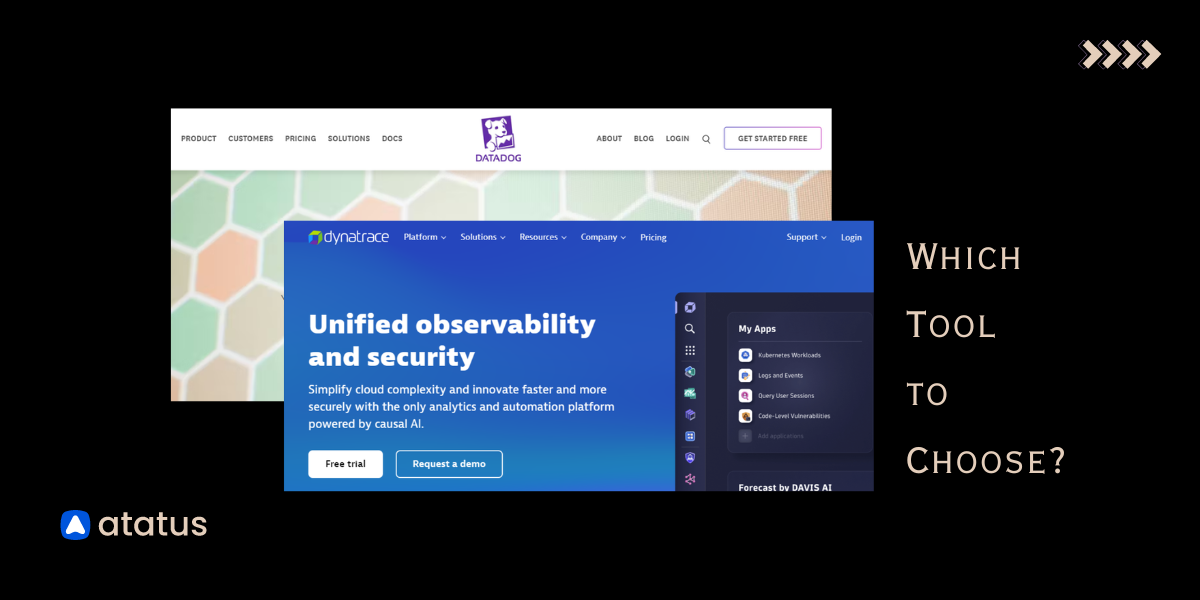
10. Dynatrace
Dynatrace is an AI-powered observability platform that provides comprehensive Monitoring, observability, and automation solutions for modern cloud-native environments. Its suite of products offers end-to-end visibility into applications, microservices, containers, infrastructure, and user experiences.
Dynatrace's Application Performance Monitoring (APM) provides deep insights into the behavior and performance of microservices. It automatically discovers and maps application dependencies, tracks requests across distributed systems, and identifies performance bottlenecks and optimization opportunities. With advanced analytics and visualization capabilities, APM enables organizations to pinpoint issues, streamline troubleshooting, and optimize resource utilization.
In addition to APM, Dynatrace offers Infrastructure Monitoring capabilities for servers, virtual machines, containers, and cloud services across hybrid and multi-cloud environments. Dynatrace's observability platform extends beyond traditional Monitoring to include Digital Experience Monitoring (DEM), which enables organizations to monitor and optimize the experiences of end-users interacting with their applications and services. DEM provides insights into user behavior, performance metrics, and errors across web and mobile applications, improving user satisfaction.
Another key offering from Dynatrace is its Autonomous Cloud Management solution, which leverages artificial intelligence and automation to optimize cloud resources, streamline operations, and reduce costs.
Furthermore, Dynatrace's platform includes security observation capabilities. By correlating security events with performance and user experience data, Dynatrace helps organizations identify abnormal behavior, mitigate risks, and ensure the integrity and compliance of their systems and applications.
Summing it Up!
While Datadog remains a popular choice for monitoring, a variety of other alternatives offer distinct features that may be advantageous to your particular needs. Even in this blog we saw how Prometheus, with its powerful time-series database and open-source flexibility, is ideal for those seeking deep customization within monitoring. Meanwhile, for enterprises requiring extensive scalability and reliability, New Relic provides a comprehensive suite of monitoring tools with strong APM capabilities. Similarly, Splunk’s robust analytics and log management capabilities make it suitable for organizations needing advanced data analysis and security features.
When comparing these Datadog alternatives, users should consider factors such as features, ease of use, scalability, performance, and cost. Each platform has its strengths and weaknesses, so it's necessary to evaluate them based on specific use cases and requirements. Additionally, users may benefit from trial periods or proof-of-concept deployments to assess how well each platform meets their needs before making a decision.
Why Choose Atatus over other Datadog Alternatives?
After examining the primary reasons behind developers switching from Datadog, we also explored alternative options. When it comes to alternatives, Atatus is a standout choice for several compelling reasons, including:
i.) Cost-Effective Solution
Atatus offers unbeatable value for your monitoring budget. We provide comprehensive features at a fraction of the cost compared to other solutions. With Atatus, you get premium monitoring without breaking the bank, making it perfect for startups and SMBs looking to save on expenses.
ii.) Easy Setup
We understand the importance of simplicity. Setting up Atatus is quick and painless. Our user-friendly interface ensures that you can start monitoring your applications and infrastructure within minutes, avoiding the complexity and headaches often associated with other alternatives.
iii.) Seamless Integration
Atatus seamlessly integrates with a wide range of third-party services and tools. Whether you're using cloud services, databases, or other monitoring tools, Atatus ensures smooth integration, minimizing compatibility issues and ensuring that you can easily incorporate it into your existing tech stack.
iv.) Gentle Learning Curve
We've prioritized ease of use in every aspect of our product. Our intuitive interface and comprehensive documentation make it easy for users to get up to speed quickly. With Atatus, there's no need for extensive training or steep learning curves. You can start leveraging our platform's full potential right away.
Atatus offers a 14 day free trial period without the need to register your card. All you have to do is sign up and get started.
If you want to learn more about our features and the customizations we offer, connect with us on a demo call, and let us explore how we can help you optimize your applications in the most cost-effective and efficient way.
#1 Solution for Logs, Traces & Metrics
![]() APM
APM
![]() Kubernetes
Kubernetes
![]() Logs
Logs
![]() Synthetics
Synthetics
![]() RUM
RUM
![]() Serverless
Serverless
![]() Security
Security
![]() More
More