Prometheus vs Grafana - A Comparative Guide to Key Differences
Prometheus and Grafana are both great observability solutions. Although they share some overlapping features, both Prometheus and Grafana have different priorities. Prometheus focuses on data acquisition, allowing users to select and aggregate time series data in real-time. Grafana, on the other hand, specializes in data visualization.
Together, they form a powerful monitoring system effectively. But how well do these tools perform individually? In this article, let us compare the key features and differences of each tool separately, focusing on categories like data collection, data visualization, pricing, and more.
Table of Contents
- Prometheus vs Grafana: The Key differences
- Prometheus vs Grafana: A Quick Overview
- Data Collection: Prometheus wins
- Data Storage: Grafana wins
- Visualization: Grafana wins
- Data Query: Tie
- Log Management: Grafana wins
- Application Performance Monitoring: Grafana wins
- Alerting: Tie
- UI/UX: Grafana wins
- Documentation: Tie
- Pricing: Prometheus wins
- Prometheus vs Grafana: Final Verdict
- An alternative to Prometheus and Grafana
- Prometheus vs Grafana vs Atatus
Prometheus vs Grafana: The Key differences
| Aspect | Prometheus | Grafana |
|---|---|---|
| Primary Function | Monitoring and alerting toolkit | Data visualization and analytics platform |
| Data Collection | Pull-based, scrapes metrics from endpoints | Does not collect data; focuses on visualization |
| Data Storage | Time-series database | Does not store data; integrates with data sources |
| Query Language | PromQL (Prometheus Query Language) | Query languages depend on data sources |
| Visualization | Limited built-in visualizations | Rich set of visualizations and dashboards |
| Alerting | Built-in alerting through Alertmanager | Alerting through integration with data sources |
| Use Case | Best for collecting, storing, and querying time-series data | Best for visualizing and analyzing data from various sources |
Let us dive deep into each of these differences in detail further in this blog to better understand their implications and use cases.
Prometheus vs Grafana: A Quick Overview
What is Prometheus?
Prometheus is an open-source monitoring and alerting toolkit developed by SoundCloud in 2012. Prometheus is particularly well-suited for monitoring applications and infrastructure due to its powerful data collection and querying capabilities. It is suitable for both machine-centric monitoring and the monitoring of highly dynamic service-oriented architectures.
Key features of Prometheus
- Efficiently collects metrics from multiple sources using a time-series database.
- Collects time series data via a pull model over HTTP.
- Offers PromQL, a flexible query language designed for working with time-series data.
- Supports robust alerting capabilities with Alertmanager, allowing for flexible routing and notification.
- Automatically discovers targets from various sources.
- Supports multiple modes of graphing and dashboarding for visualizing data.
What is Grafana?
Grafana is an open-source visualization and analytical tool. It allows users to visualize their data by creating consolidated charts and graphs, either in a unified dashboard or across multiple dashboards. This capability makes it easier to interpret and understand complex data sets, providing clearer insights and more informed decision-making.
Key features of Grafana
- Supports a wide range of data sources, including Prometheus, Elasticsearch, MySQL, and more.
- Offers rich visualization options with customizable dashboards and panels.
- Provides flexible alerting rules and notifications integrated with various communication channels.
- Each data source has a customized query editor, offering features like auto-completion and visual query building.
- Extensive plugin ecosystem for additional functionalities and custom integrations.
Data Collection
Prometheus
Prometheus follows a pull-based model, where it systematically scrapes data from targets such as applications, services, or infrastructure components that have been instrumented with its client libraries.

It collects data by checking a list of scrape targets, which can include IP addresses and domain names. Prometheus sends an HTTP GET /metrics request to each service on the list to gather metrics. Any application that uses a Prometheus Client and exposes this endpoint can be monitored.
Additionally, Prometheus has a Pushgateway for collecting metrics from short-lived targets. Instead of pulling metrics, the Pushgateway accepts HTTP POST /push requests and then makes these metrics available for Prometheus to scrape.
Grafana
Grafana, in contrast, does not collect data on its own. As a primarily data visualization tool, Grafana relies on integration with external data sources for data collection. It connects seamlessly with various sources, including databases, cloud services, and other monitoring tools. Unlike Prometheus, which actively scrapes and collects data, Grafana fetches data from these integrated sources to create visualizations and dashboards.
Data Collection Comparison: Prometheus vs Grafana
Prometheus wins for data collection with its active pull-based model. Grafana, being a visualization tool, depends on external sources for data, so Prometheus has the advantage here.
Data Storage
Prometheus
Prometheus has an in-built time-series database. It stores collected metrics in this database, which efficiently handles time-stamped data and creates a valuable historical record of system performance.
This historical data is crucial for monitoring, analysing, and optimising system behaviour over time. However, Prometheus lacks long-term data storage capabilities. To manage data over extended periods, it must be integrated with other tools.
Grafana
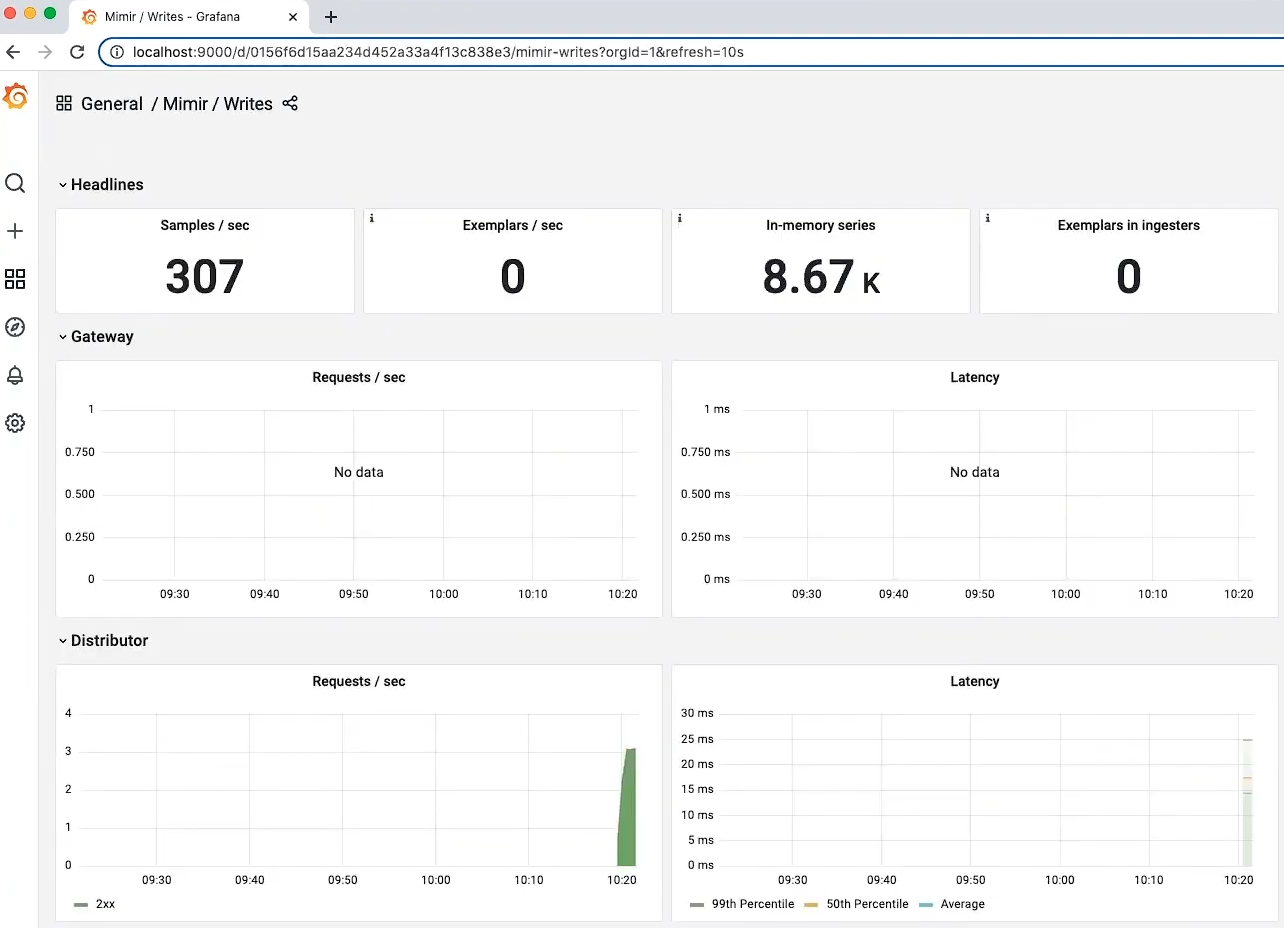
Grafana uses Mimir, a component of the Grafana stack, for metrics storage. Grafana Mimir replicates incoming metrics to ensure no data loss in case of machine failure. Its horizontally scalable architecture allows for restarts, upgrades, or downgrades with zero downtime, ensuring uninterrupted metrics ingestion and querying. Grafana Mimir's horizontally scalable architecture can be run across multiple machines. Internal testing shows that Grafana Mimir handles up to 1 billion active time series.
Data Storage Comparison: Prometheus vs Grafana
Grafana takes the win for storage with Grafana Mimir’s scalable and reliable setup. Prometheus is great but needs extra tools for long-term storage.
Visualization
Prometheus
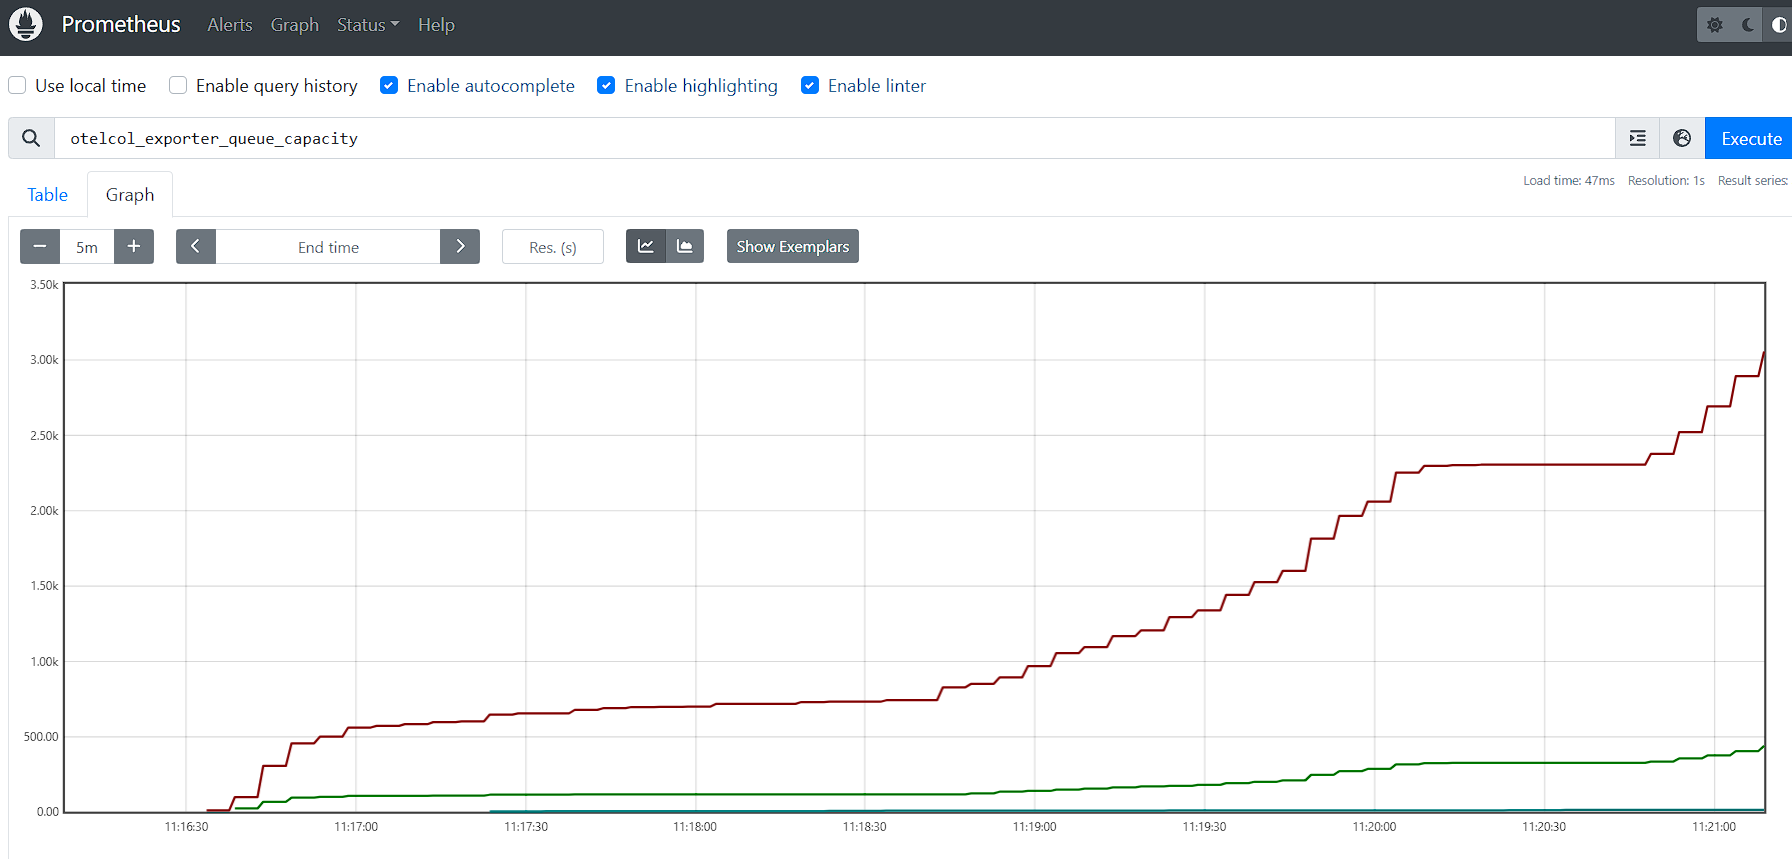
Prometheus offers an expression browser, which allows users to enter any expressions and view results in either a table or a graph. The expression browser is available at /graph on the server. While it can generate basic charts and graphs from collected data, its functionality is limited and less user-friendly.
Grafana
Grafana is well-known for its great visualization features. It offers a variety of built-in visualizations for different use cases. I have included some of the visualization options provided by Grafana, which I find particularly impressive.


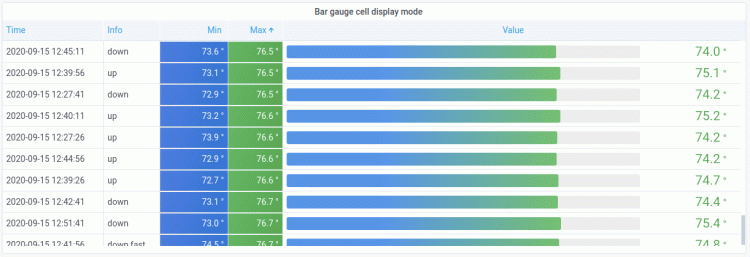
If you are unsure which visualization to choose, Grafana can suggest you options. Suggestions are done based on your panel query. When you select a visualization option, Grafana shows a preview with that visualization applied.
Grafana visualization types and their descriptions:
| Visualization Type | Description |
|---|---|
| Time Series | For time-based line, area, and bar charts. |
| Bar Chart | For categorical data. |
| Stat | Shows one large value with an optional graph sparkline. |
| Gauge | Displays a value related to a min and max range. |
| Table | Shows data in a table layout. |
| Pie Chart | Displays values in a series as they relate to each other. |
| Heatmap | Shows value distribution over time. |
| State Timeline | Shows discrete state changes over time. |
To use Grafana for data visualization, you first need to connect it to an external data source like Prometheus.
Visualization Comparison: Prometheus vs Grafana
Grafana wins for visualizations with its wide range of built-in options like time series, pie charts, and tables, plus helpful suggestions and previews. Prometheus’s expression browser is useful but less user-friendly and limited in comparison.
Data Query
Prometheus
Prometheus not only stores system event data in a time-series format but also offers powerful functionality to query and display real-time snapshots and combined views of this data. It features PromQL (Prometheus Query Language), which enables users to select, filter, aggregate, and transform time series data effectively.
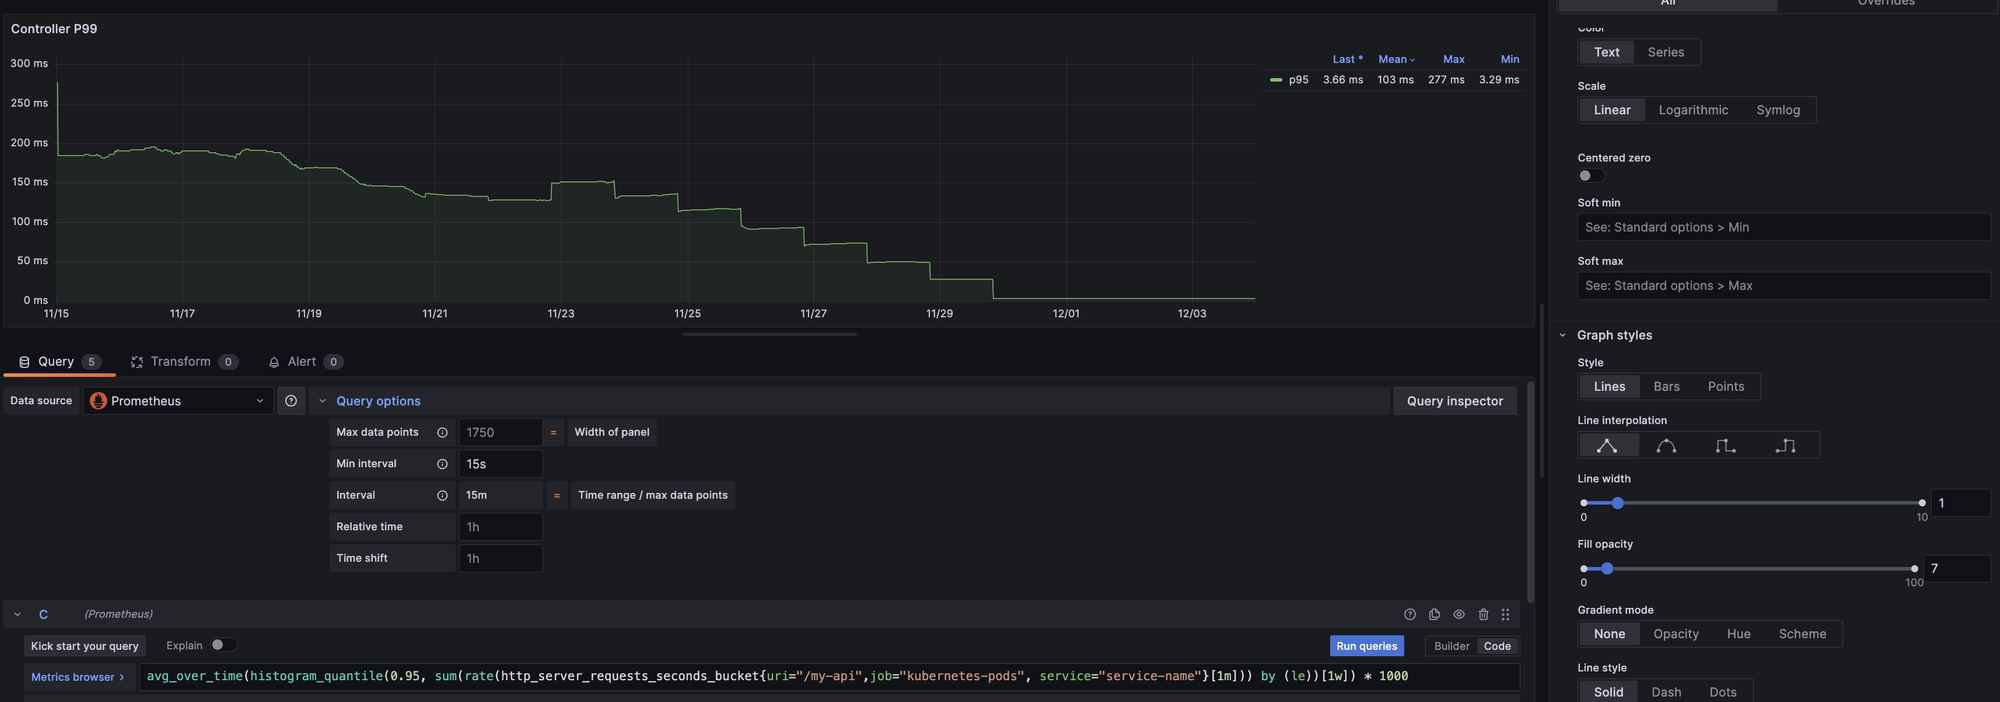
PromQL comes with a handy library of built-in functions that further enhance crafting query. With PromQL, users can monitor system performance, diagnose issues, and make informed, data-driven decisions based on real-time metrics.
Grafana
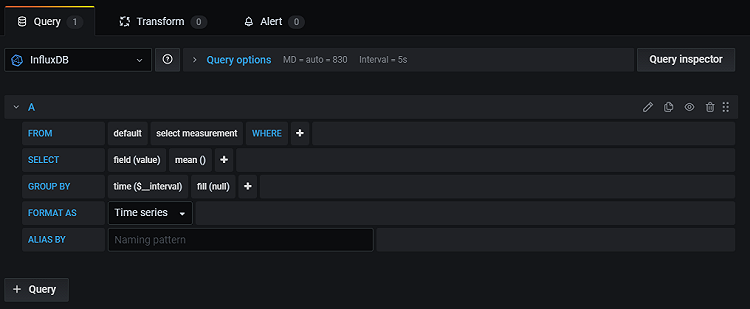
Grafana supports many types of data sources, each with its own query language and specific query editor. The query editor provides a customized interface to help you write queries, offering features like auto-completion, metric names, variable suggestions, or a visual query-building tool, depending on the data source. This functionality allows you to take full advantage of the unique capabilities of each data source.
Data Query Comparison: Prometheus vs Grafana
It’s a tie between Prometheus and Grafana when it comes to data querying. Prometheus excels with its powerful PromQL for real-time metrics, while Grafana shines with its versatile query editors that support multiple data sources and offer great customization.
Log Management
Prometheus
As a metrics-focused tool, Prometheus does not support log management directly. It excels in collecting and querying metrics but lacks native capabilities for log storage, searching, or visualization. To manage logs, Prometheus needs to be used alongside additional tools, as it does not provide built-in log management features.
Grafana
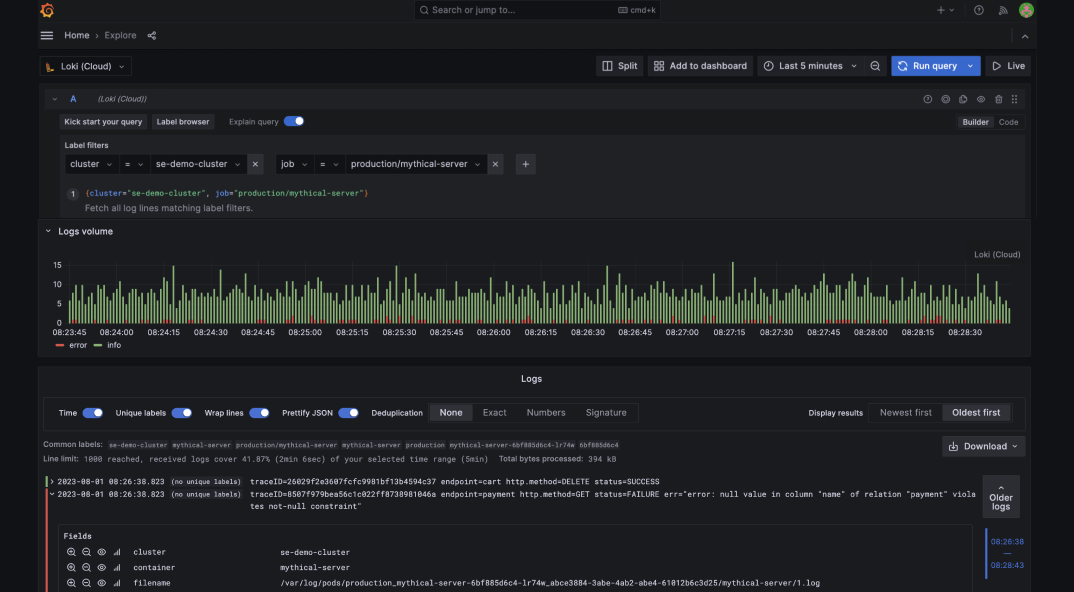
Grafana integrates with Loki for effective log management. Loki uses LogQL, a powerful query language that supports complex queries, field extraction, regular expressions, and pattern matching.
With Grafana Cloud Logs, you can store and query logs from all your applications and infrastructure. It offers native support for out-of-order log ingestion and bursts of logs, ensuring that no logs are lost. It also handles issues like log volume, costs, and storage limits, simplifying the log management process.
Log Management Comparison: Prometheus vs Grafana
In the Prometheus vs Grafana comparison, Grafana is the go-to tool for log management because it works great with Loki for storing and searching logs.
Application Performance Monitoring
Prometheus
Prometheus is great for monitoring metrics like CPU usage and request latency but lacks advanced APM features. It does not offer detailed tracing or code-level insights. If you need detailed insights into application performance, dedicated APM tools like Atatus are the way to go.
Grafana
Grafana's suite of products offers powerful capabilities for monitoring and analysing application performance. Tempo tracks request flows across microservices, Loki handles and organizes log data for error diagnosis, and Mimir stores metrics long-term for trend analysis. Together, these Grafana tools provide a framework for comprehensive application performance monitoring and help troubleshoot issues effectively.
APM Comparison: Prometheus vs Grafana
In the Prometheus vs Grafana comparison, Grafana is the better option for application performance monitoring with its advanced tools.
Cloud Solutions
Prometheus
Prometheus does not provide a cloud service or hosted option. Users must handle the deployment, configuration, and ongoing management of their Prometheus instances themselves. This can provide greater flexibility and control but also requires more effort and expertise compared to using a fully managed monitoring solution.
Grafana
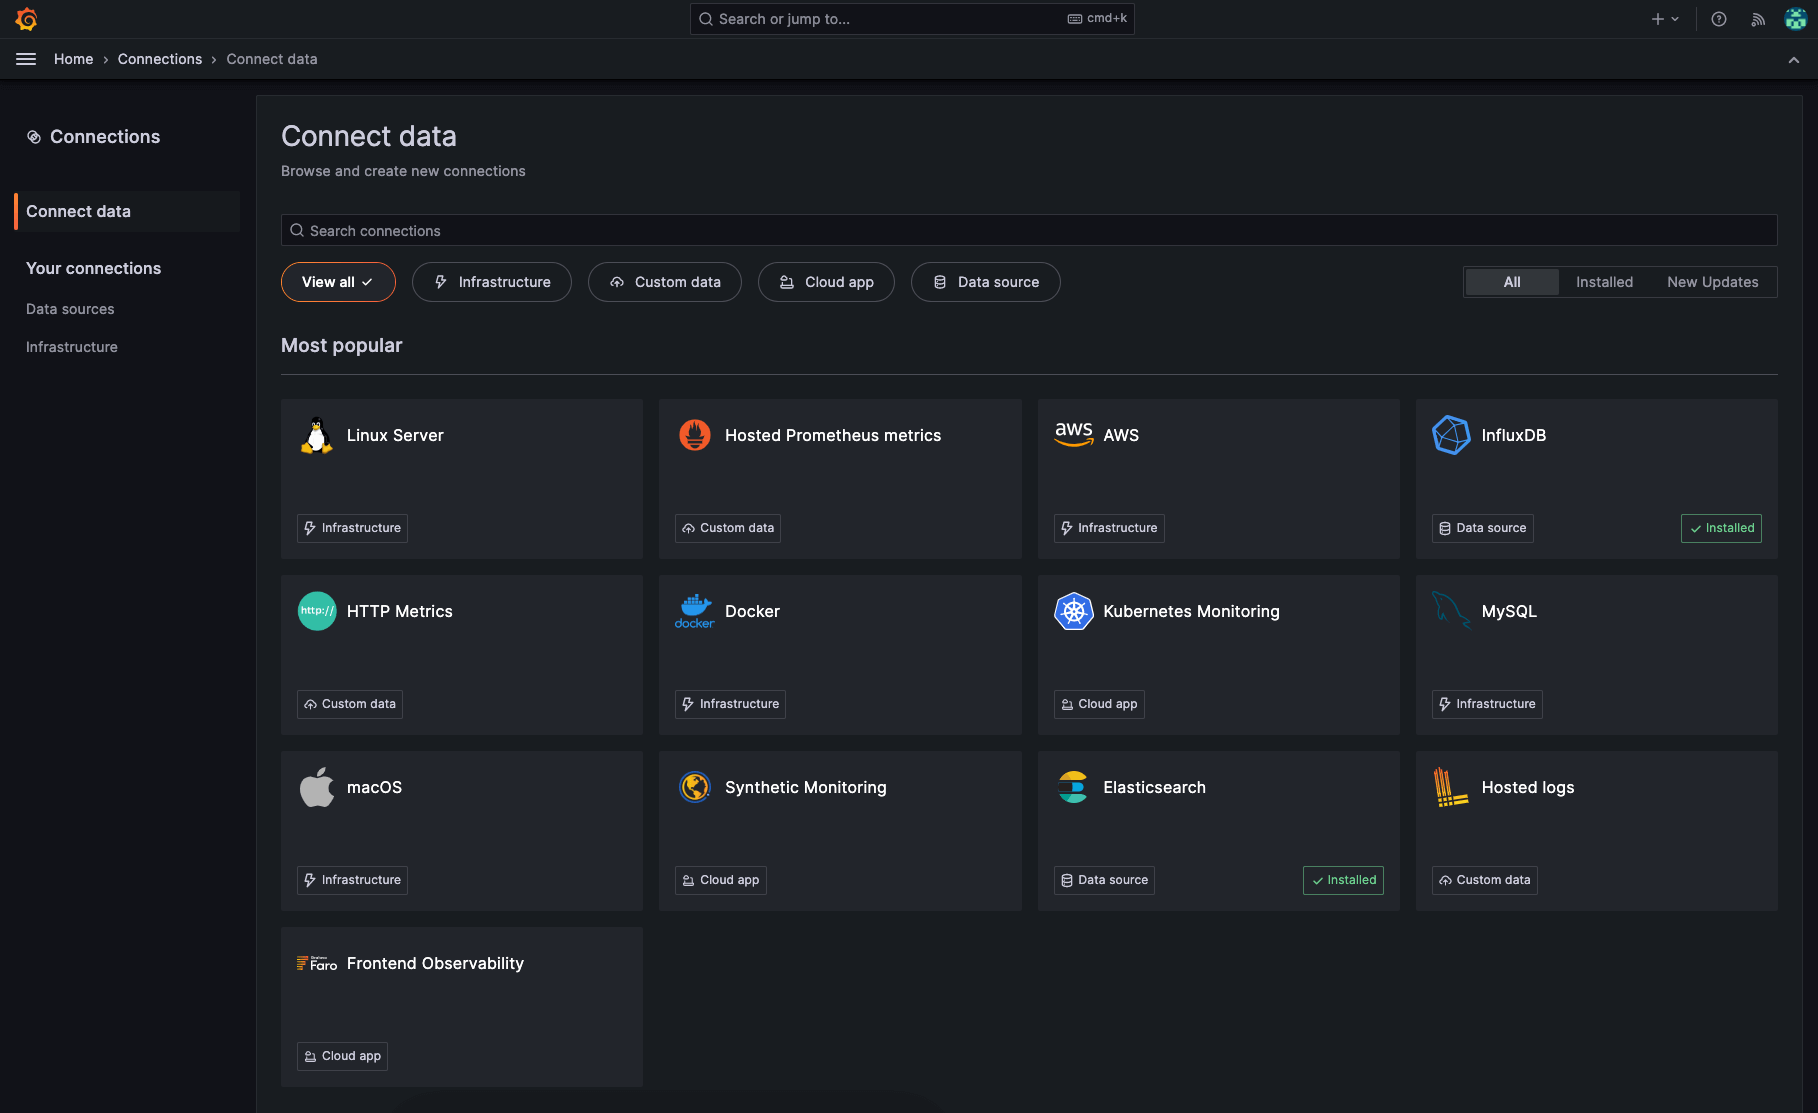
In contrast, Grafana provides a fully managed cloud service called Grafana Cloud. Grafana Cloud is a fully managed, cloud-hosted observability platform ideal for cloud-native environments. It offers a tightly integrated stack for metrics, logs, and traces, all unified within the premier dashboarding platform for data visualization.
Cloud Solution Comparison: Prometheus vs Grafana
Grafana wins with its easy-to-use Grafana Cloud , which takes care of all the setup and maintenance. Prometheus requires more setup and maintenance, making Grafana the more convenient option.
Alerting
Prometheus
Prometheus lacks a native feature for directly configuring alert rules, which are instead managed by a component called Alertmanager. Alerting in Prometheus is divided into two parts: the alerting rules in Prometheus servers, which send alerts to Alertmanager, and Alertmanager itself, which manages those alerts.

Alertmanager is responsible for functions such as silencing, inhibition, aggregation, and sending notifications via various methods like email, on-call notification systems, and chat platforms.
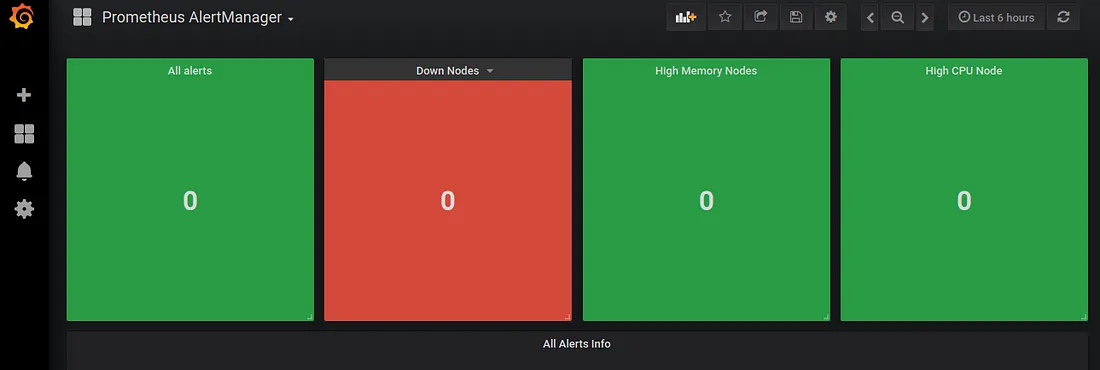
When client applications like the Prometheus server send alerts, Alertmanager handles deduplication, grouping, and routing them to the appropriate receiver integrations such as email, PagerDuty, or OpsGenie. Additionally, it manages the silencing and inhibition of alerts.
Grafana
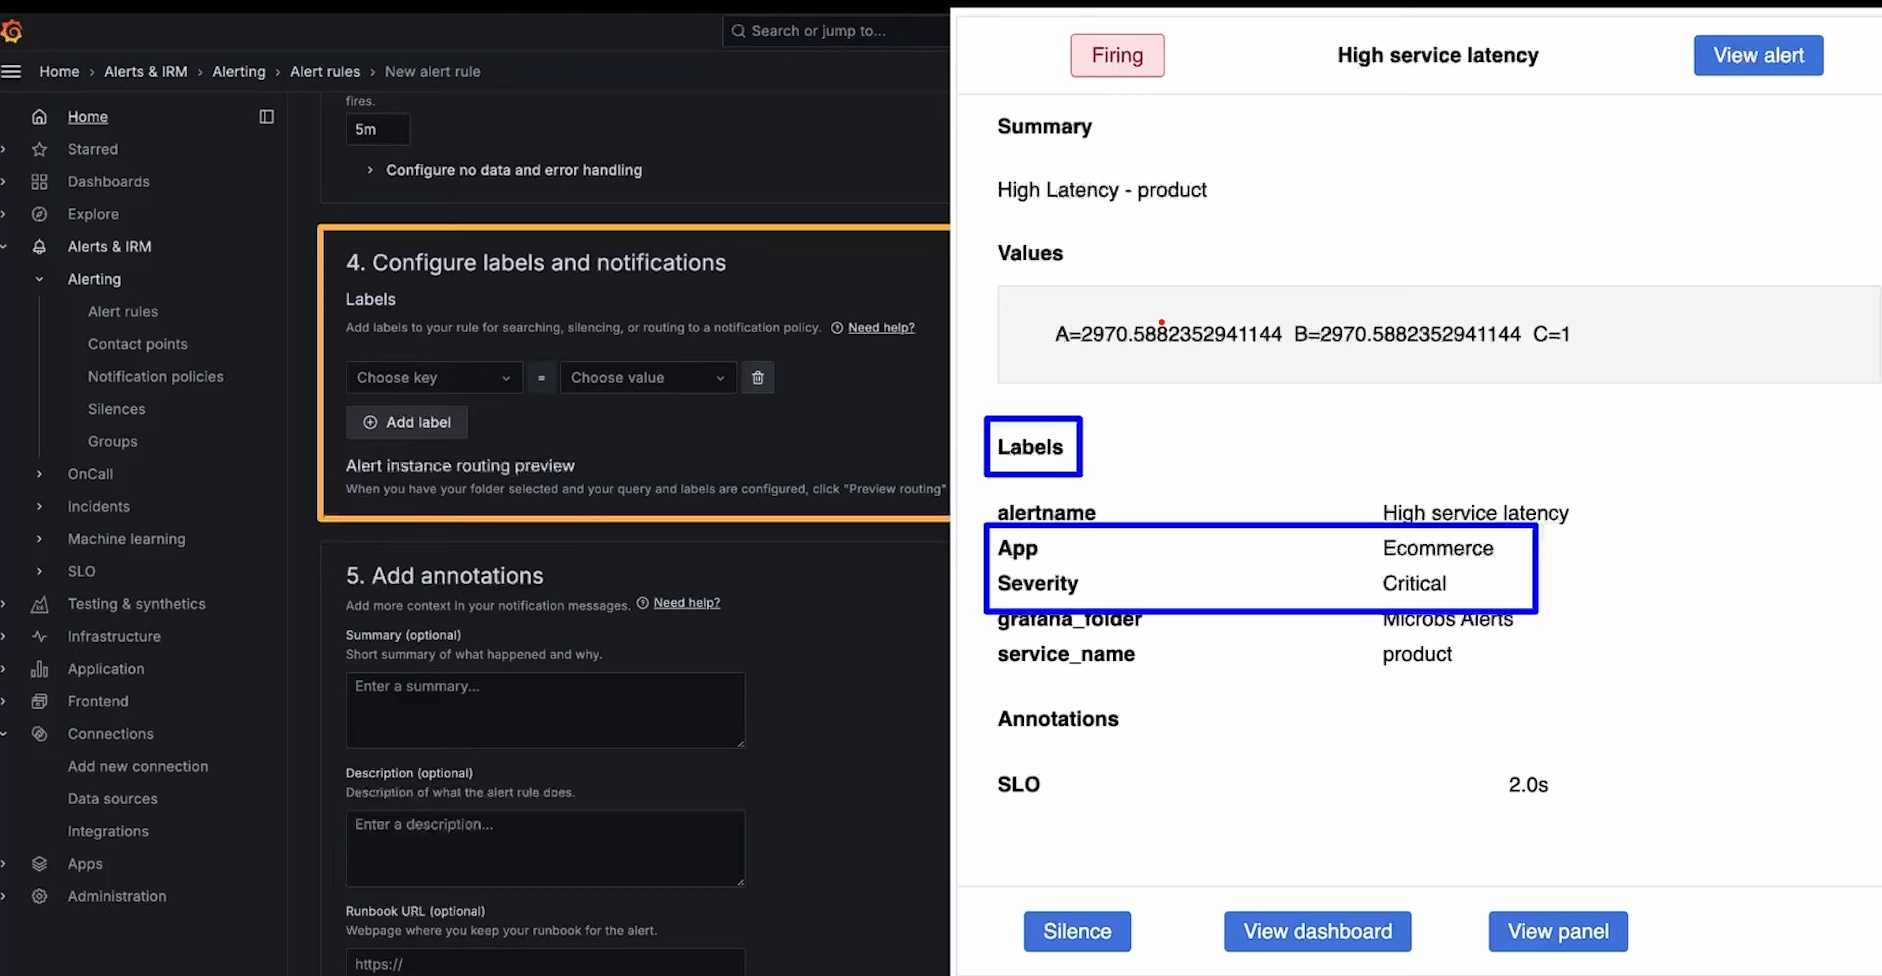
Grafana provides a complete alerting service by default. You can set up alert rules, add labels, and define notification policies. Notification policies provide a flexible method to handle alert notifications for larger systems.
Grafana supports queries and expressions from multiple data sources, allowing you to combine data and create unique alerts. You can manage and act on alerts from a single view, enhancing your team's issue resolution capabilities. This helps identify and resolve problems quickly.
Alerting Comparison: Prometheus vs Grafana
Its a tie between Prometheus and Grafana.Each tool offers distinct advantages for alerting. Choose based on your requirement.
UI/UX
Prometheus
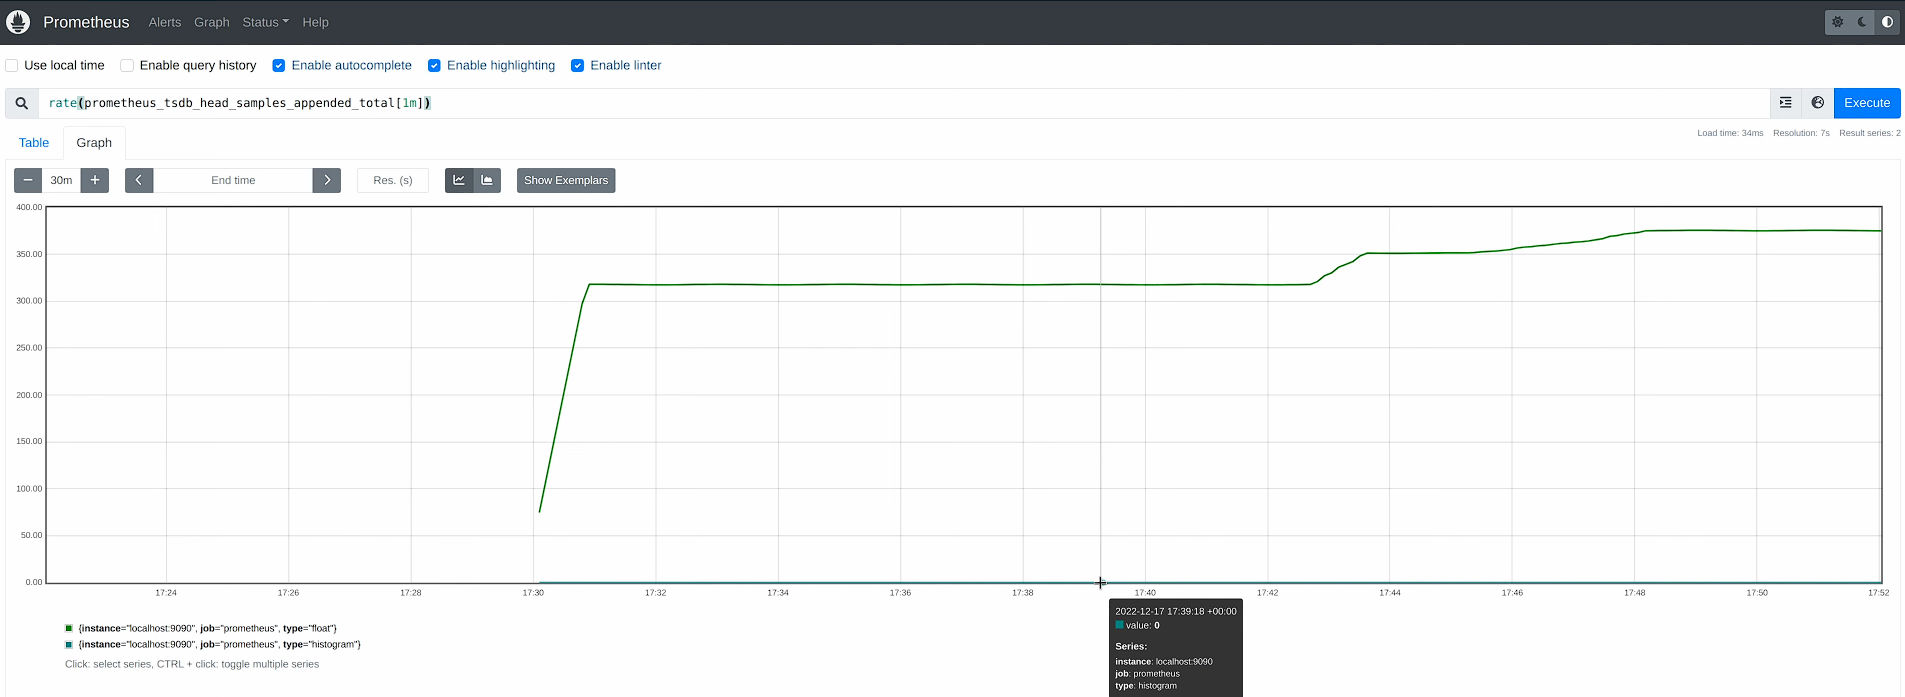
Prometheus UI is more basic and functional, focused primarily on querying and exploring time-series data. The user interface is intuitive but less visually appealing. It offers basic graphing and charting capabilities. The graphs are functional but lack advanced features and aesthetic appeal. It emphasizes core monitoring features without much customization.
Grafana
On the other hand, Grafana's UI is user-friendly and highly customizable. Navigation is smooth, making it easy to find and access different features. You can choose from a variety of visualization options like graphs, tables, and heatmaps, as we saw in detail in the visualization part. Plus, you can create dynamic dashboards using templating and variables. Overall, the interface is intuitive, making it easy to set up and manage your data visualizations.

UI/UX Comparison: Prometheus vs Grafana
Grafana has a better UI/UX compared to Prometheus due to its highly customizable, user-friendly interface and rich visualization options.
Documentation
Prometheus
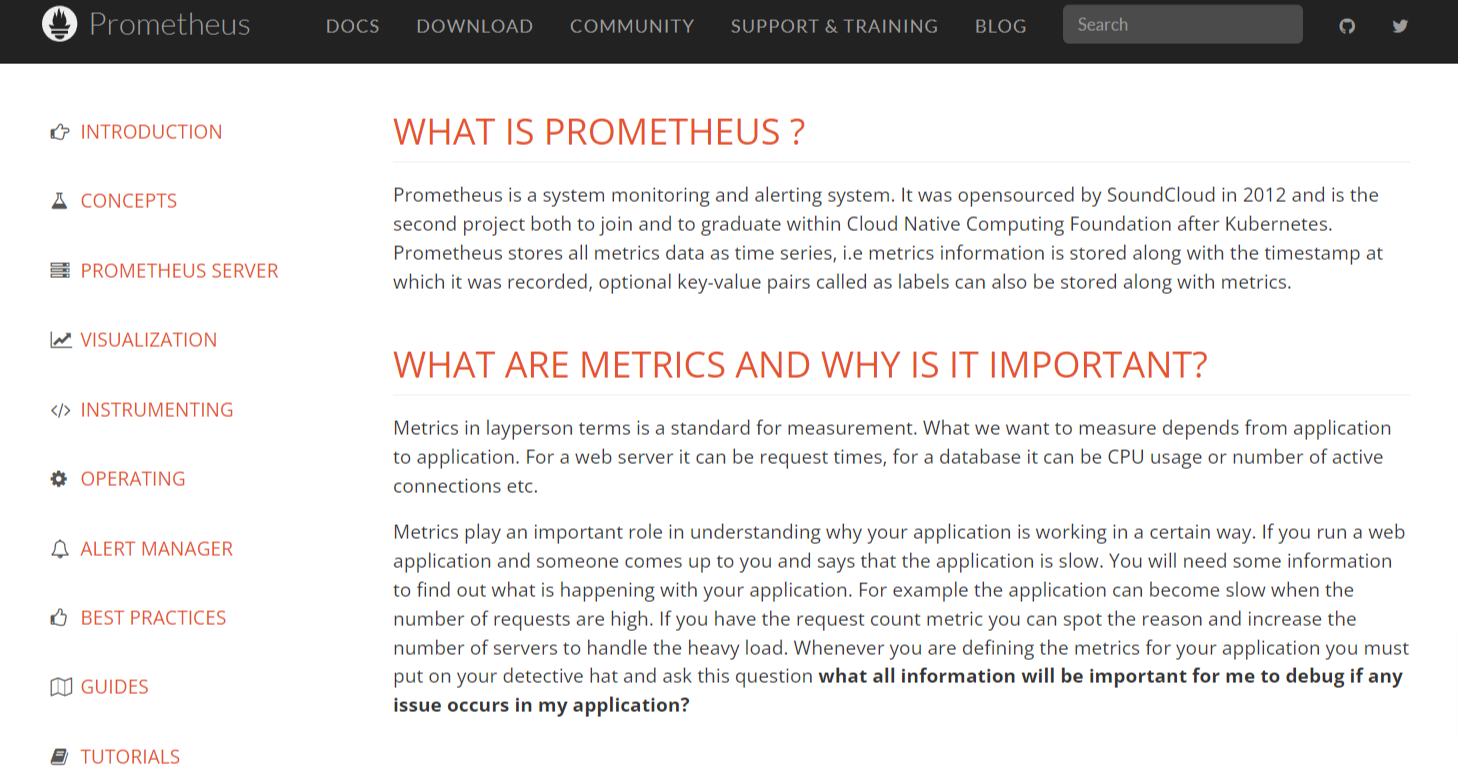
Prometheus provides clear and comprehensive documentation that is easy to follow and understand. ach concept, such as the Prometheus server, visualization, instrumenting, operating, alertmanager, and best practices, is well-explained and supported by internal links. This structure makes it easy to navigate and understand each aspect of Prometheus.
Grafana
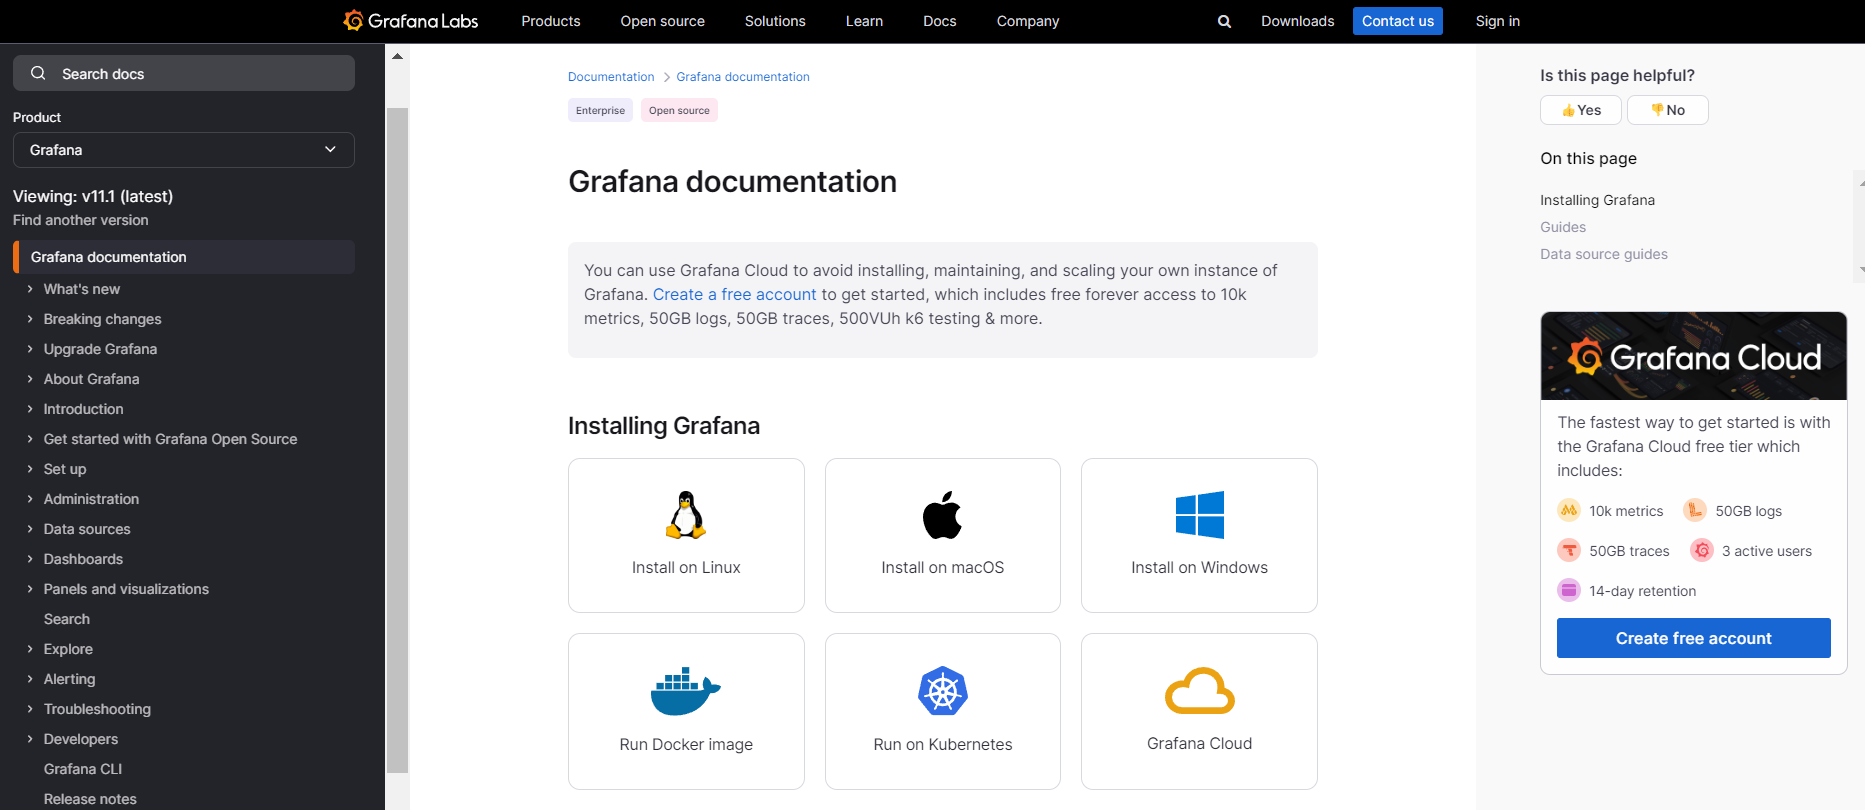
Grafana also offers clear and extensive documentation. I found the user interface to be very user-friendly and intuitive, with straightforward navigation. The documentation includes images where necessary, which effectively explained the process. Additionally, the videos included are extremely helpful.
Documentation Comparison: Prometheus vs Grafana
In the Prometheus vs Grafana comparison, both tools offer comprehensive and well-structured documentation.
Pricing
Prometheus
Prometheus itself is open-source and free to use. Many users ask, "Is Prometheus free?" The answer is yes, Prometheus is available at no cost due to its open-source nature. However, there may be costs associated with the infrastructure needed to deploy and maintain it.
Grafana
Grafana’s open-source version is freely accessible. However, for advanced features and enterprise-level support, Grafana also offers paid options.
Grafana Cloud offers three pricing tiers: Free Forever, Pro Pay As You Go, and Advanced Premium Bundle. Each tier provides different features and usage limits to cater to various needs.
| Plan | Cost | Features | Support |
|---|---|---|---|
| Free Forever | $0 | All Grafana Cloud features | Community support |
| Pro Pay As You Go | Starts at $0 | All Grafana Cloud features, optional Enterprise plugins | 8x5 support |
| Advanced Premium Bundle | Starts at $299/month | All Grafana Cloud features, Enterprise plugins included | 24x7 support |
Pricing Comparison: Prometheus vs Grafana
Prometheus is the better choice due to its open-source nature and no additional costs for advanced features.
Prometheus vs Grafana: Final Verdict
Which is better Grafana or Prometheus?
Prometheus and Grafana, each excel in their own domains. Prometheus is robust for time-series data collection and alerting, with strong scalability. Grafana, on the other hand, shines in visualization, offering customizable dashboards and extensive plugin support.
If your main objective is to collect, store, and analyze time-series data choose Prometheus. On the other hand, if your focus is on visualization, choose Grafana. Knowing their differences is key to selecting the right tool for your monitoring and visualization requirements.
An alternative to Prometheus and Grafana
Atatus is a full-stack observability and monitoring platform that provides comprehensive visibility into your application. It offers detailed insights into your logs, metrics, and traces, all in one place.
Here are a few reasons to consider Atatus as an alternative to Prometheus and Grafana:
- All-in-One Platform: Atatus offers a comprehensive platform that integrates all your monitoring needs in one place.
- Built-in Alerting: The built-in alerting feature ensures you are promptly notified of any anomalies or performance issues.
- Custom Dashboards: Atatus provides a user-friendly interface for creating custom dashboards to display metrics, alerts, and other data, making it easy for organizations.
- APM (Application Performance Monitoring): Identify and fix spikes in endpoint failures and monitor application performance in real-time. Gain in-depth insights into transaction details, slow database queries, poor-performing network calls, and more.
- Log Management: Atatus provides a flexible log management solution with an out-of-the-box UI. Correlate logs with APM traces and errors for a comprehensive view.
- OpenTelemetry Support: Effortlessly integrate telemetry data from metrics, logs, and traces, simplifying data aggregation across your entire stack and enabling holistic insights into system performance and behavior.
- Distributed Tracing: Gain end-to-end visibility into microservices, perform root cause analysis with trace data, map service dependencies, and correlate logs with traces for a detailed understanding of your system.
Prometheus vs Grafana vs Atatus
| Feature / Tool | Prometheus | Grafana | Atatus |
|---|---|---|---|
| Metric Collection | ✅ | ❌ | ✅ |
| Visualization | 🔸 | ✅ | ✅ |
| Alerting | ✅ | 🔸 | ✅ |
| Dashboards | 🔸 | ✅ | ✅ |
| Integrated APM | ❌ | ❌ | ✅ |
| Log Management | ❌ | 🔸 | ✅ |
| Ease of Setup | 🔸 | ✅ | ✅ |
✅ Available ❌Not Available 🔸Limited
If you are not yet an Atatus customer, sign up for a 14-day free trial.
#1 Solution for Logs, Traces & Metrics
APM
Kubernetes
Logs
Synthetics
RUM
Serverless
Security
More


![New Relic vs Splunk - In-depth Comparison [2026]](/blog/content/images/size/w960/2024/10/Datadog-vs-sentry--19-.png)
![New Relic vs Sentry - Which Monitoring Tool to Choose? [2026]](/blog/content/images/size/w960/2024/10/VS--1-.png)
