New Relic vs Splunk - In-depth Comparison [2025]
New Relic and Splunk are two prominent tools in the world of observability and monitoring, each serving distinct purposes. New Relic is used for Application Performance Monitoring (APM), offering a full-stack observability platform . It is important to note that New Relic is not a SIEM tool, its primary focus is performance monitoring.
On the other hand, Splunk is used for log management, machine data analytics, and is widely utilized as a SIEM tool. By comparing these tools, organizations can determine which solution best fits their needs.
Let’s get into it!
In this blog:
- What are New Relic and Splunk?
- Application Performance Monitoring(APM): New Relic
- Log Management: Splunk
- Alerts and Notifications
- OpenTelemetry Support
- Machine Learning Capabilities
- UI and UX
- Documentation
- Pricing
- New Relic vs. Splunk: Key Takeaways
- An alternative to New Relic vs Splunk : Atatus
What are New Relic and Splunk?
Let’s start with a quick overview,
New Relic:
New Relic provides a cloud-based observability platform designed to deliver real-time insights into both applications and infrastructure. New Relic is widely regarded as a good tool, especially for Application Performance Monitoring (APM). It allows for comprehensive performance monitoring by evaluating metrics, logs, and traces from diverse sources. Its AI-enhanced capabilities improve system reliability and offer a holistic view of your digital environment.
Splunk:
Splunk is a powerful platform designed for analyzing and visualizing machine-generated data. It excels at managing large volumes of logs and metrics, offering advanced analytics and security insights. Splunk efficiently collects, organizes, and indexes real-time data, and provides detailed alerts, dashboards, and reports. It is available in both cloud and enterprise versions.
No, New Relic and Splunk are not the same. They are distinct tools with different core functionalities. While they may overlap in some features, New Relic focuses on application performance monitoring and observability, whereas Splunk specializes in log management, machine data analytics, and security event monitoring.
Application Performance Monitoring(APM)
New Relic APM:
I signed up for a New Relic account and installed the language agent for my app. After that, I just needed to generate some traffic to the application and log in to my New Relic account. Within a few minutes, I started seeing data flow into the platform.
Once New Relic received data from my app, I could monitor its basic health right away. The APM Summary page in the New Relic UI provided basic dashboards that offered immediate insights into my app's performance, with no need for customization.
I used the APM Group Errors tab to dynamically filter and group errors. And the Error profiles helped me see which users were most common across all error events during the selected time window.
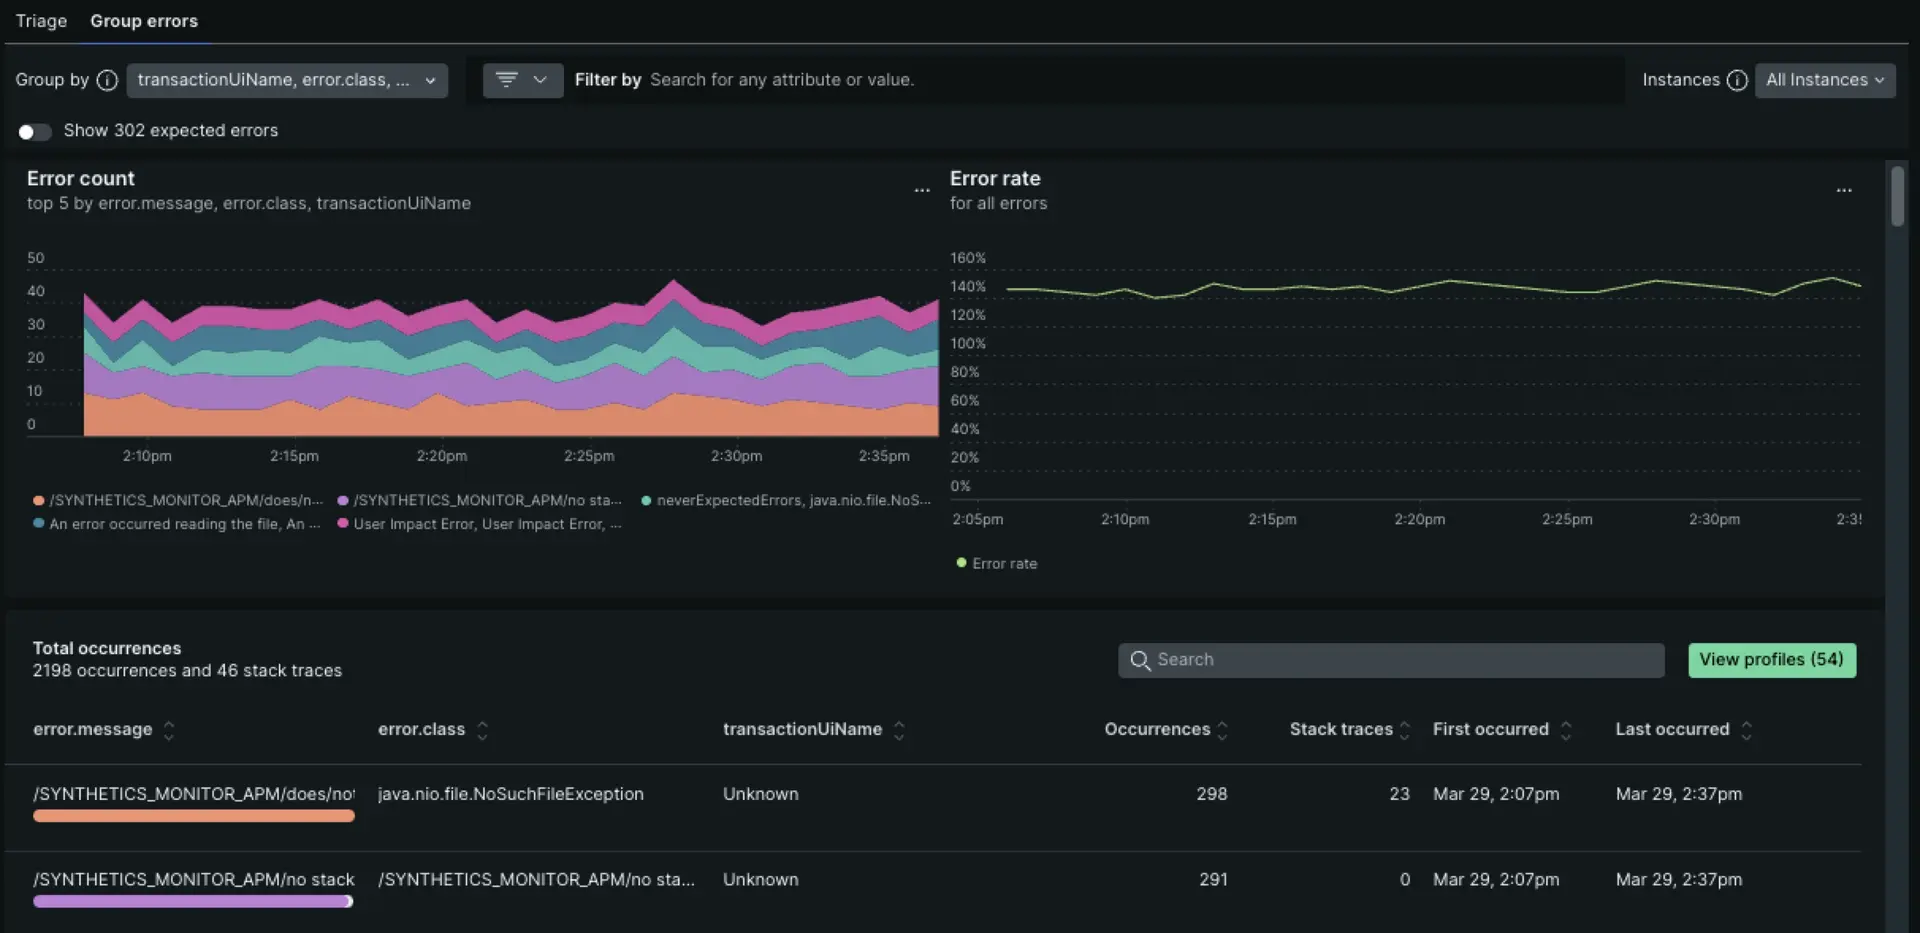
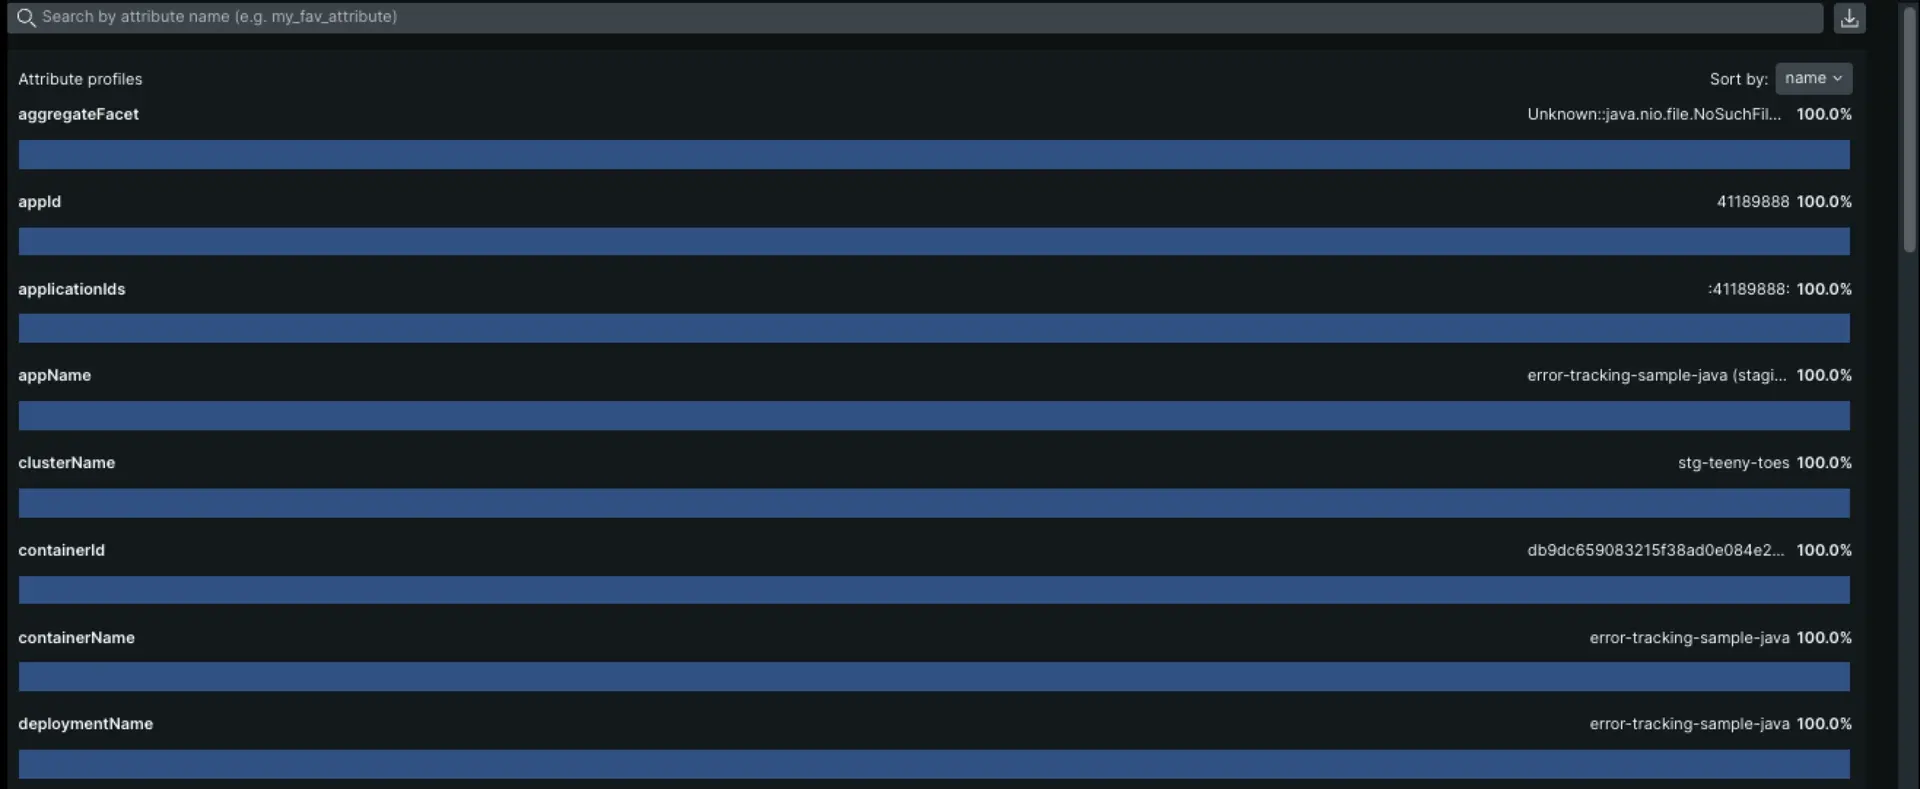
I then clicked on Attribute Profiles to expand into individual profiles.
I also utilized distributed tracing to visualize the path of any service request, which really helped in understanding and troubleshooting issues.
Splunk APM:
I set up Splunk APM by installing the SignalFx-SmartAgent on my server. If that wasn’t an option, I could use the OpenTelemetry Collector instead. Then, I updated the configuration file to accept APM traces. Finally, I installed and initialised SFx tracing library to my app so it could start sending data to Splunk.
In the Splunk APM, I clicked the APM tab to navigate to the service map. This provided instant visibility into service interactions, inferred services, dependencies, and performance. I could see all instrumented services.
Clicking the Troubleshooting tab showed service latency and root errors.
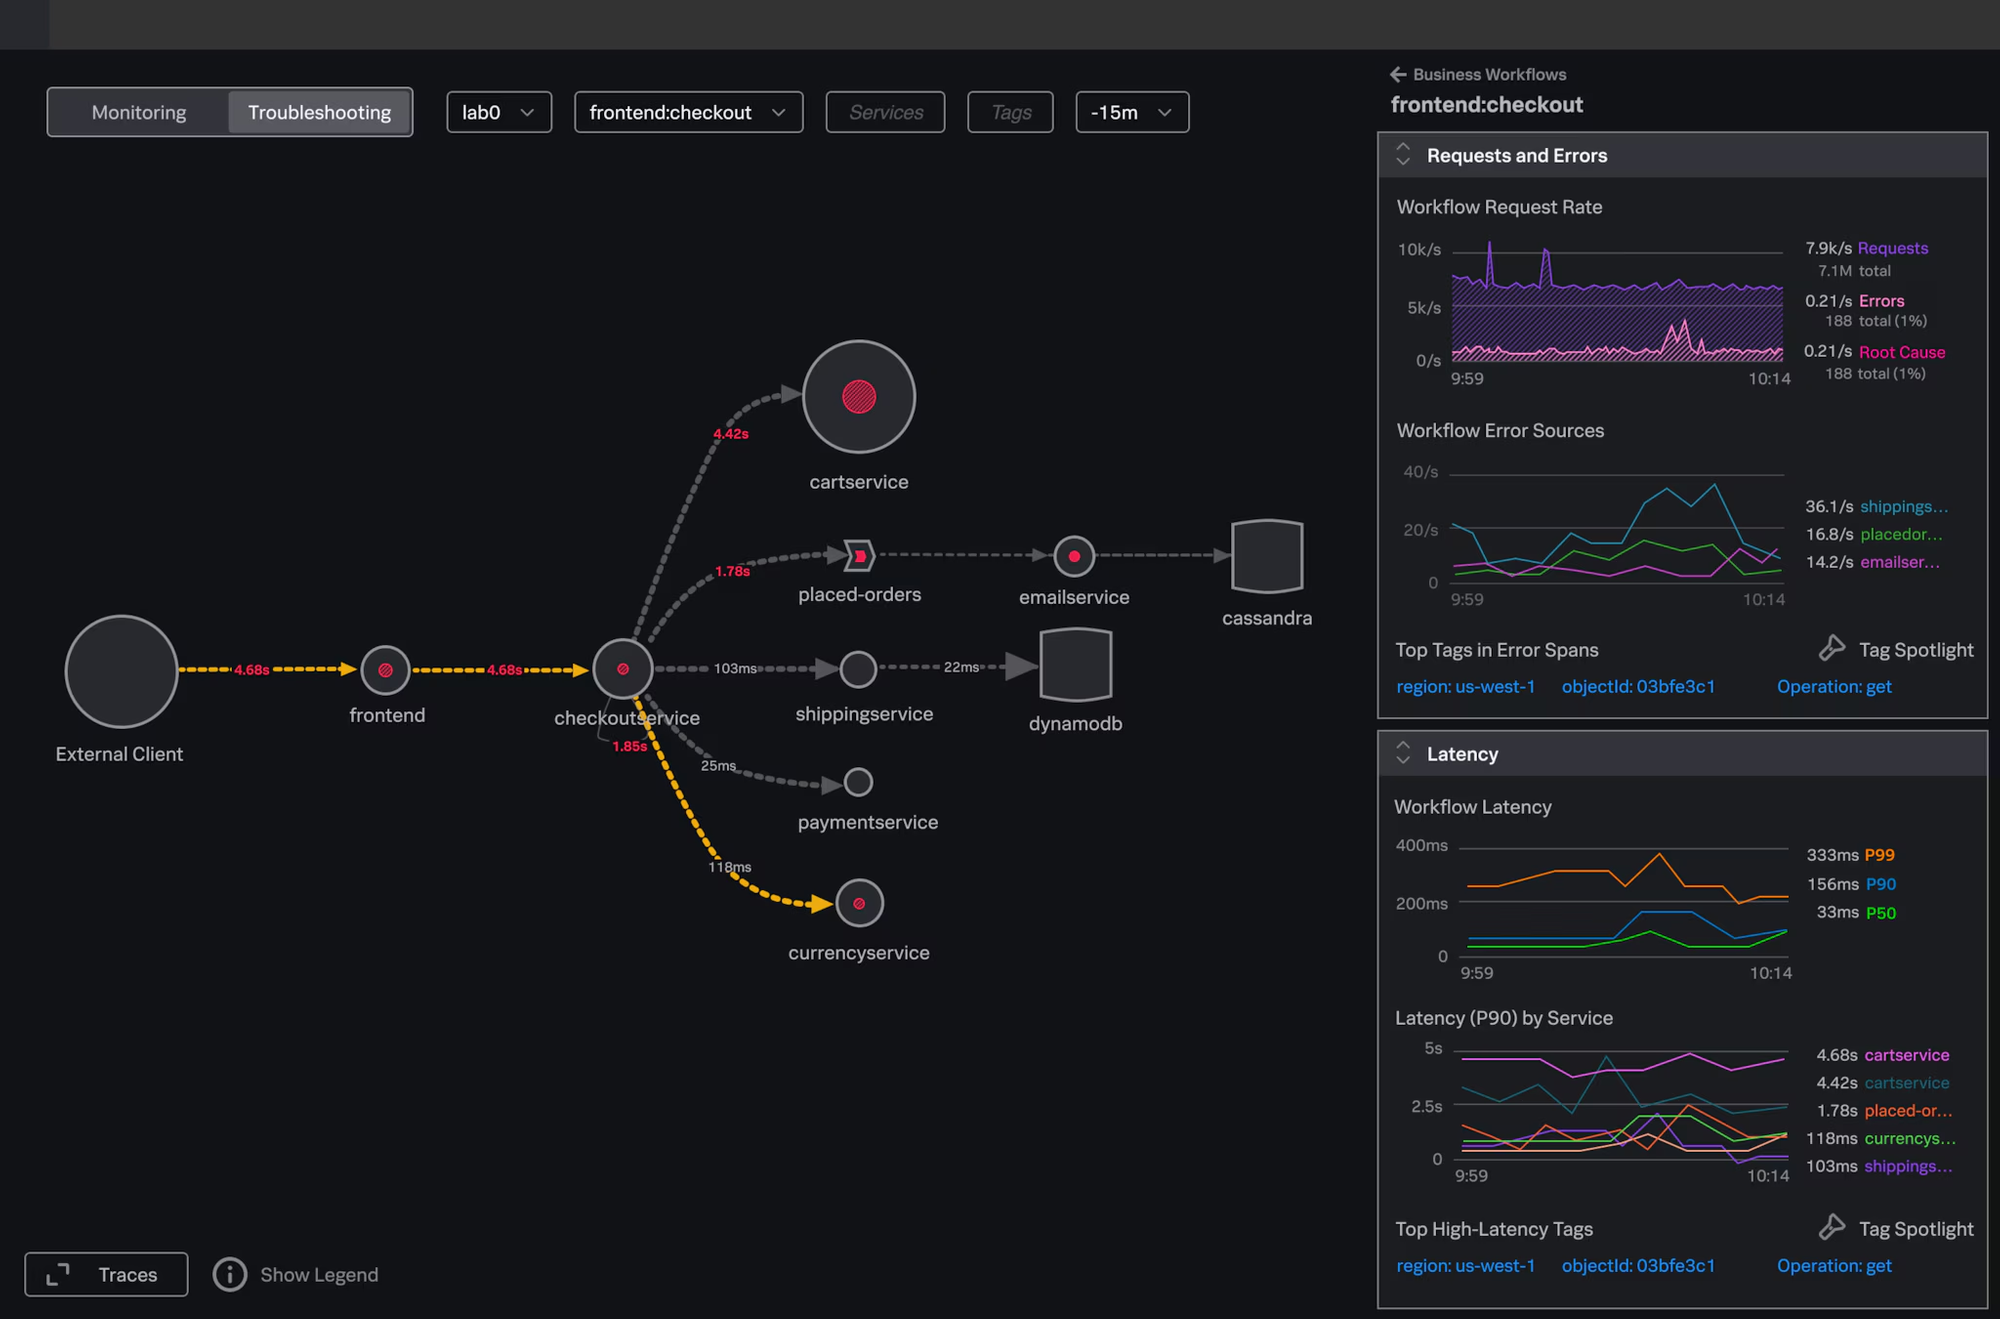
I selected a service from the service map and chose “View Dashboard” to access service and system metrics.

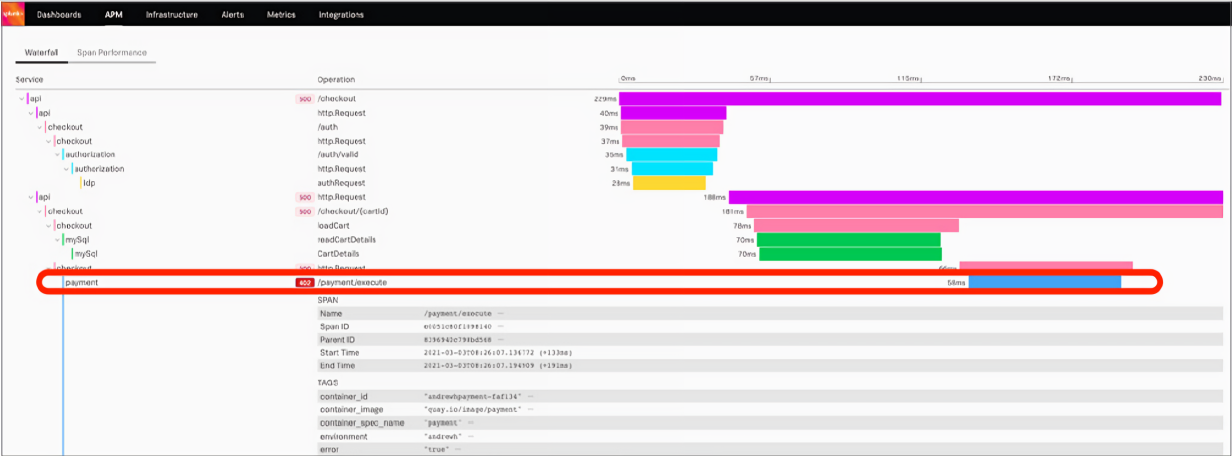
To view and drill down into a trace, I clicked the “Show Traces” button at the bottom left of the troubleshooting service map. I found options to filter traces by environment, service, tags, and timeframe. After applying these filters, I clicked on individual Trace IDs and spans to view their detailed metadata.
New Relic vs Splunk for APM: New Relic is a better choice with its quick setup and deeper insights. It offers strong monitoring features with minimal effort.
Log Management
New Relic:
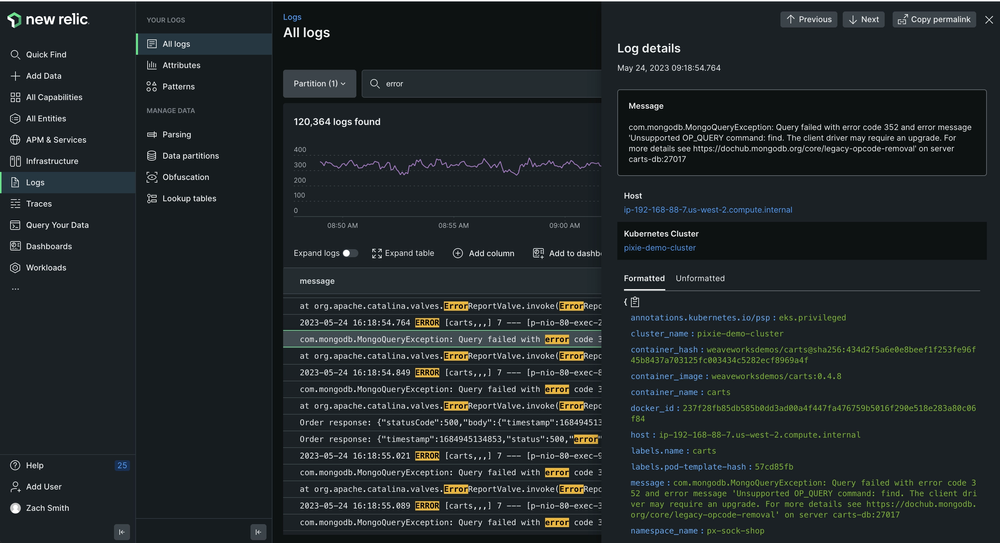
Once I set up New Relic, it automatically started collecting logs from my applications and displaying them in the logs tab. It captures both infrastructure and application logs seamlessly without any extra setup needed.
New Relic logs gave me deeper visibility into my application and infrastructure performance, showing critical data like events, errors, and traces. This made it easier to reduce MTTR and quickly troubleshoot production issues.
I could visualize everything in one place using the logs UI, which helped me identify important patterns. Plus, I could dive deeper into specific log lines to gain more context and better insights.
Splunk:
Splunk is known for its strong log management and can manage large amounts of data, but it doesn’t automatically gather logs from applications, it requires manual setup.
To get started with Log Observer Connect, you can connect with either Splunk Enterprise or Splunk Cloud Platform using two different methods.
With Log Observer Connect, It it easy to troubleshoot application and infrastructure behaviour using high-context logs. You can perform codeless queries on your Splunk Enterprise or Splunk Cloud Platform logs to quickly detect the source of issues, and then jump to related content throughout Splunk Observability Cloud with just one click.
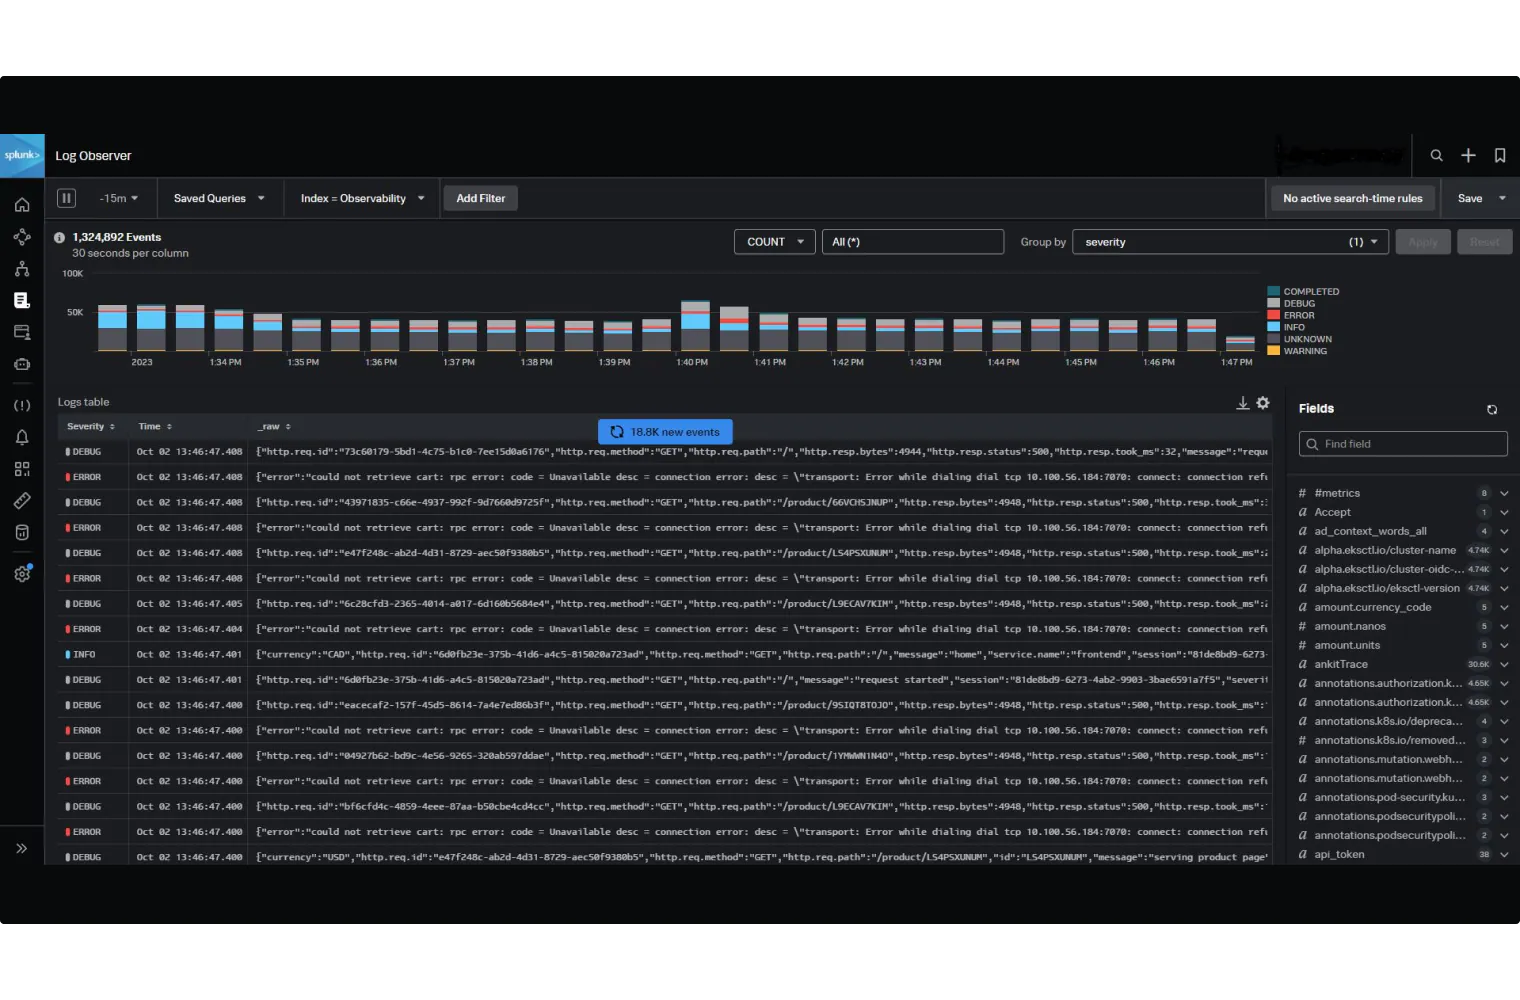
Here’s what you can do using Splunk Log Observer Connect:
- View overall system health using the timeline.
- Query logs in Log Observer.
- Browse logs in the logs table.
- Search logs by keywords or fields.
- Group logs by fields using log aggregation.
- Save and share Log Observer queries.
New Relic vs Splunk for Log Management: While New Relic is easier to set up, Splunk offers more in-depth control and insights.
Machine Learning Capabilities
New Relic
- Integrated ML Algorithms: Automates performance monitoring and troubleshooting tasks.
- Anomaly Detection: Identifies performance issues and outliers.
- Insights and Recommendations: Provides optimization tips for applications and services.
Splunk
- Machine Learning Toolkit (MLTK): Includes pre-built algorithms for common use cases.
- Extensive Framework Integrations: Works with popular ML frameworks.
- Versatile Use Cases: Handles data classification, anomaly detection, and predictive analytics.
New Relic vs Splunk: Splunk excels with its advanced machine-learning features for complex needs.
OpenTelemetry Support
New Relic offers OpenTelemetry integration, but may have limitations in advanced features. It provides basic support, allowing you to collect and visualize telemetry data, but full optimization is still in progress.
Splunk also supports OpenTelemetry, but like New Relic, its integration might not be fully optimized. Splunk allows for data collection and monitoring, but you might face some gaps in advanced functionalities and ease of use.
New Relic vs Splunk for OpenTelemetry Support: Tie, Both New Relic and Splunk offer OpenTelemetry integration but may have limitations in advanced features. For optimal OpenTelemetry support, consider using a native OpenTelemetry tool.
Alerts and Notifications
New Relic
New Relic’s alerting functions have been flexible and efficient. You can enrich alerts with additional context from New Relic data, correlate incidents, and even perform root cause analysis. What I really appreciate is how it reduces noisy alerts and groups related issues for better insights.
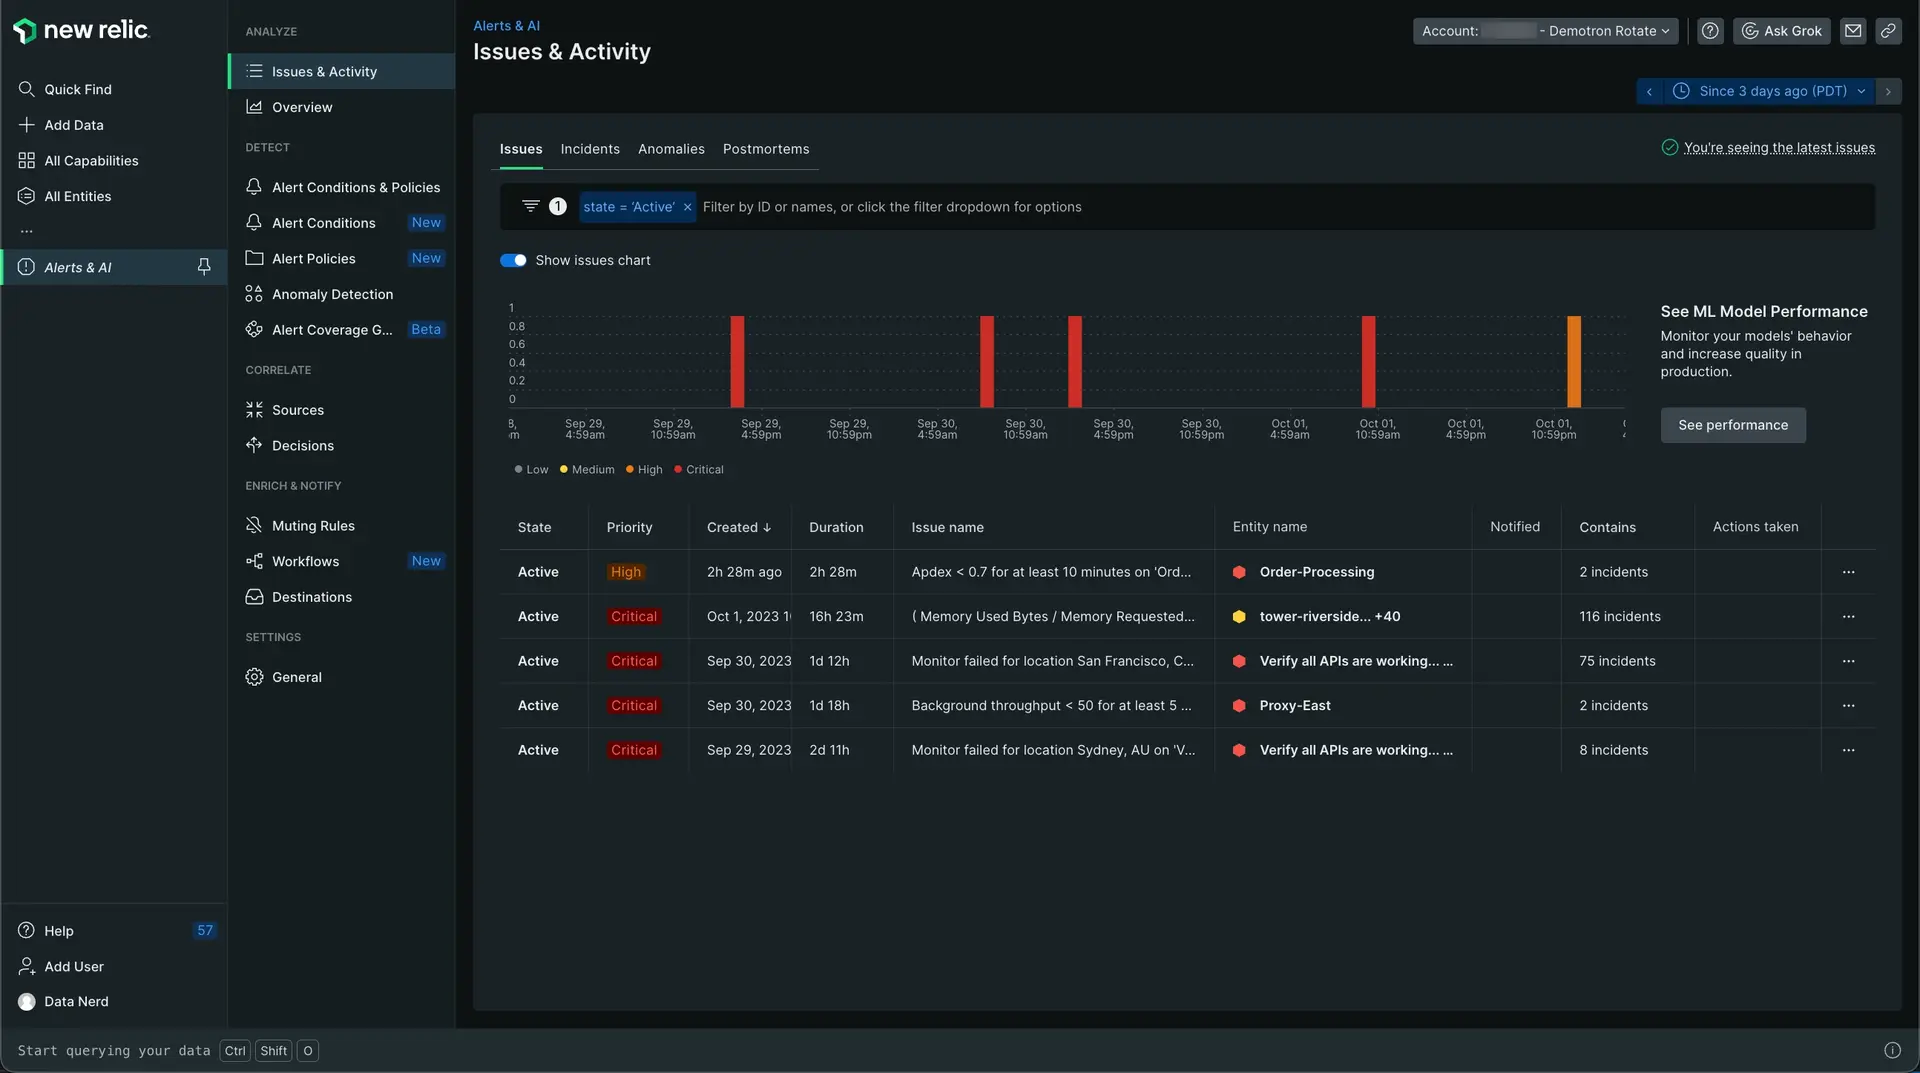
For example, if I want New Relic to notify Slack channel about any latency in a recent deployment, I can easily set up a destination with the necessary API keys. Notifications can also be sent to services like Slack, Jira, ServiceNow, and email, providing versatile options for seamless integration.
Splunk
Splunk’s alerting system is also robust and user-friendly. It lets you set custom performance thresholds and send alerts via Slack, and email. Splunk also integrates smoothly with collaboration tools like Slack and Microsoft Teams, providing real-time notifications with detailed data and complex conditions.
New Relic vs Splunk : It's a tie, both New Relic and Splunk offer robust features but have their own limitations.
UI and UX
New Relic has a much more user-friendly interface compared to Splunk. Navigating through New Relic is easy, even if you are new to it, and customizing dashboards is pretty straightforward. The overall design just feels cleaner and more intuitive.
On the other hand, I found Splunk's interface a bit more complicated. It has a lot of features, but the learning curve is steeper, and it took me longer to get comfortable with it. Overall, I would say New Relic offers a better and smoother user experience.
New Relic vs Splunk: New Relic is better with its easy-to-use and intuitive interface.
Documentation
New Relic’s documentation is really straightforward. Each topic is explained clearly, so you don't need to jump around to understand something. For example, when I was setting up a dashboard, everything I needed was right there in one section.
With Splunk, I found that I often had to switch between different topics to get the full picture, which made things a bit more complicated.
New Relic vs Splunk: Overall, New Relic's documentation is more organized and easier to follow, saving time and effort.
Pricing
New Relic:
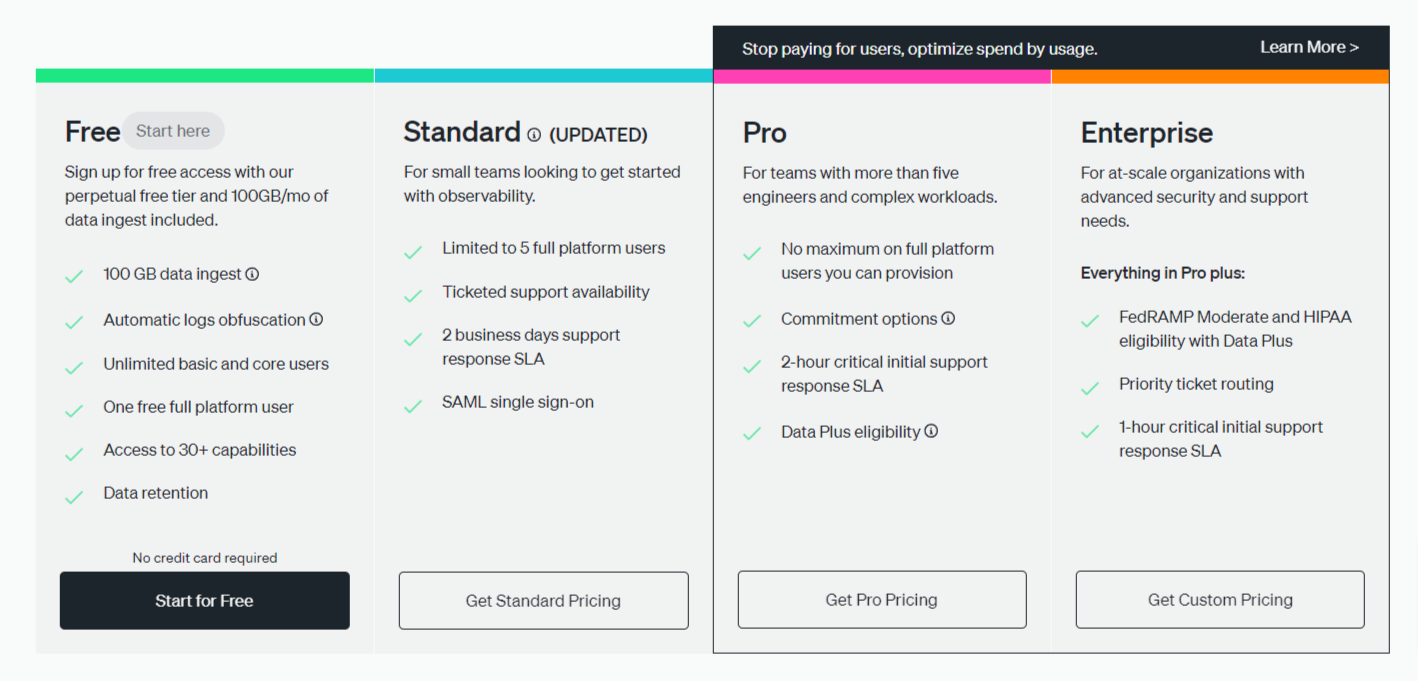
New Relic offers both a free tier and various paid plans. Its pricing model is usage-based, providing 100GB of free data ingestion each month. After exceeding this limit, costs are $0.30 per GB or $0.50 per GB, depending on your plan. Additionally, New Relic features four different pricing tiers, including a free forever plan.
Splunk:
Splunk’s pricing model is complex and can be expensive. It provides several pricing options, such as workload, entity, ingest, and activity-based pricing. The exact cost isn’t displayed on the website, so users need to reach out to Splunk’s sales team for detailed pricing information.
New Relic vs. Splunk: Key Takeaways
- Ease of Use: New Relic is more user-friendly and intuitive.
- Log Management: Splunk handles large log volumes better, but requires manual setup.
- APM Features: New Relic offers quicker and simpler setup, while Splunk provides deeper data handling.
- OpenTelemetry: Both tools support OpenTelemetry, but full optimization may need native tools.
- Machine Learning: Splunk excels with advanced machine-learning features.
- Customization: New Relic offers easier dashboard customization.
- Learning Curve: Splunk has a steeper learning curve compared to New Relic.
An alternative to New Relic vs Splunk : Atatus
Atatus is a comprehensive Observability solution that provides an excellent alternative to New Relic and Splunk.
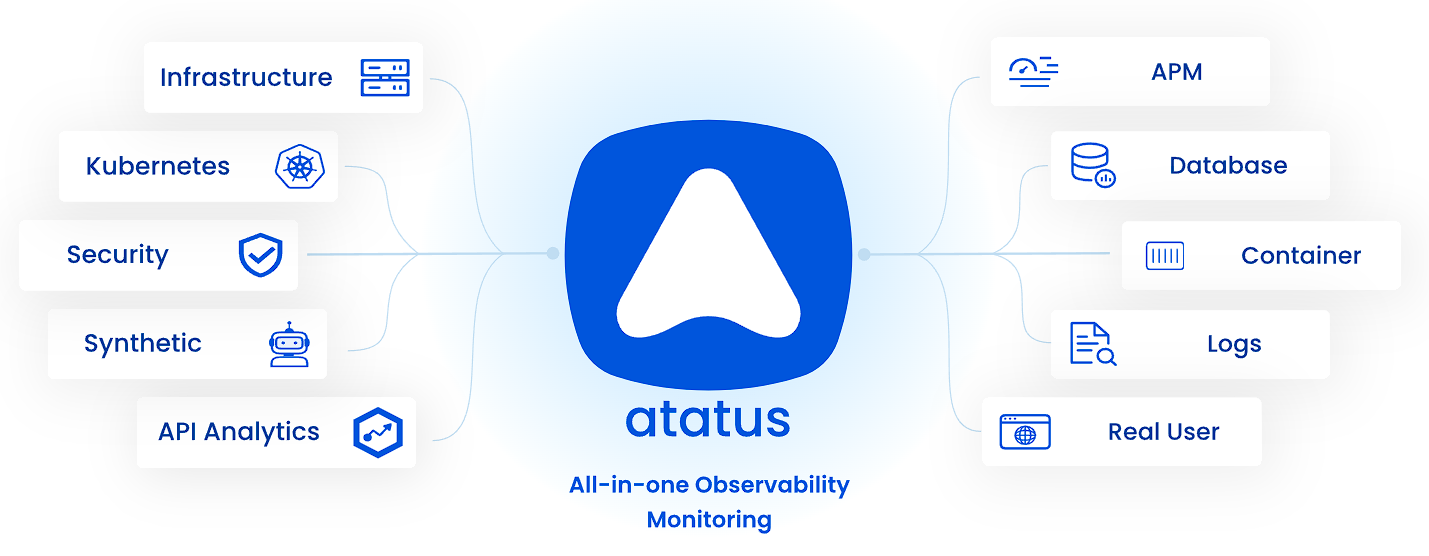
Atatus Application Performance Monitoring (APM) offers in-depth insights into your applications, allowing you to pinpoint performance bottlenecks, resolve issues, and enhance your services. Atatus APM ensures optimal performance and user experience for your applications.
Key Features of Atatus includes,
- Comprehensive Observability: Atatus combines Metrics, Logs, and Traces in one platform for holistic visibility.
- Log Management: Atatus provides a flexible log management solution with an out-of-the-box UI.
- User-Friendly Interface: Intuitive setup and easy-to-navigate interface reduce complexity.
- Transparent Pricing: No hidden costs or special pricing for custom metrics.
- Free Trial: Explore features risk-free with a 14-day trial.
Don't just take my word for it - listen to what our customers have to say. Look at these G2 reviews.
New to Atatus? Try it out with a 14 days free trial.
#1 Solution for Logs, Traces & Metrics
APM
Kubernetes
Logs
Synthetics
RUM
Serverless
Security
More

![New Relic vs Splunk - In-depth Comparison [2025]](/blog/content/images/size/w960/2024/10/Datadog-vs-sentry--19-.png)


![New Relic vs Sentry - Which Monitoring Tool to Choose? [2025]](/blog/content/images/size/w960/2024/10/VS--1-.png)