New Relic vs Grafana - 2025 Comparison
New Relic and Grafana are leading tools in monitoring and observability, each with distinct use cases. New Relic excels in Application Performance Monitoring (APM), providing detailed insights for application performance. In contrast, Grafana is designed for data visualization and monitoring, allowing users to create customizable dashboards for metrics and logs.
This article provides a clear comparison of their features, including application performance monitoring, log management, and dashboards. The pricing of each tool is also discussed to help determine which best fits your needs. Additionally, the pros and cons of each platform are highlighted. This guide help you to choose the best solution for your monitoring requirements.
Lets get started!
In this Article:
- Primary Focus
- Feature Comparison
- Pros and Cons
- New Relic vs Grafana: The Final Verdict
- Atatus: A Better Alternative to New Relic and Grafana
Primary Focus
New Relic
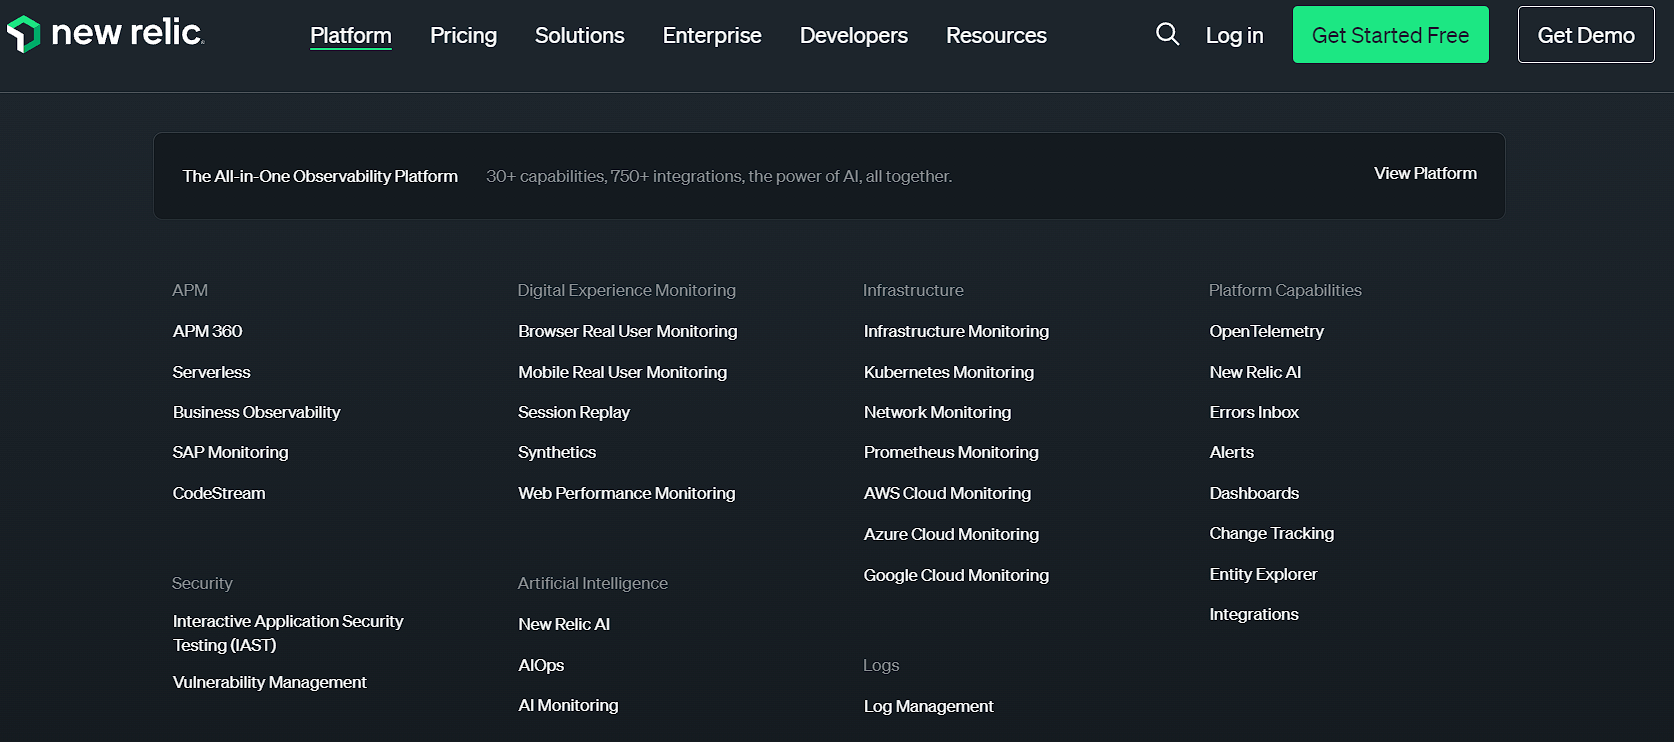
New Relic is a cloud-based observability platform designed for real-time monitoring and optimization of digital systems. It provides comprehensive insights into system performance with over 30 capabilities and supports more than 750 integrations. New Relic focuses on delivering AI-powered analytics to debug issues, enhance performance, and ensure system reliability.
New Relic offers products for application performance monitoring (APM), infrastructure monitoring, browser monitoring, mobile app monitoring, synthetic monitoring, distributed tracing, log management, network monitoring, and Kubernetes monitoring, providing comprehensive observability across systems.
Grafana
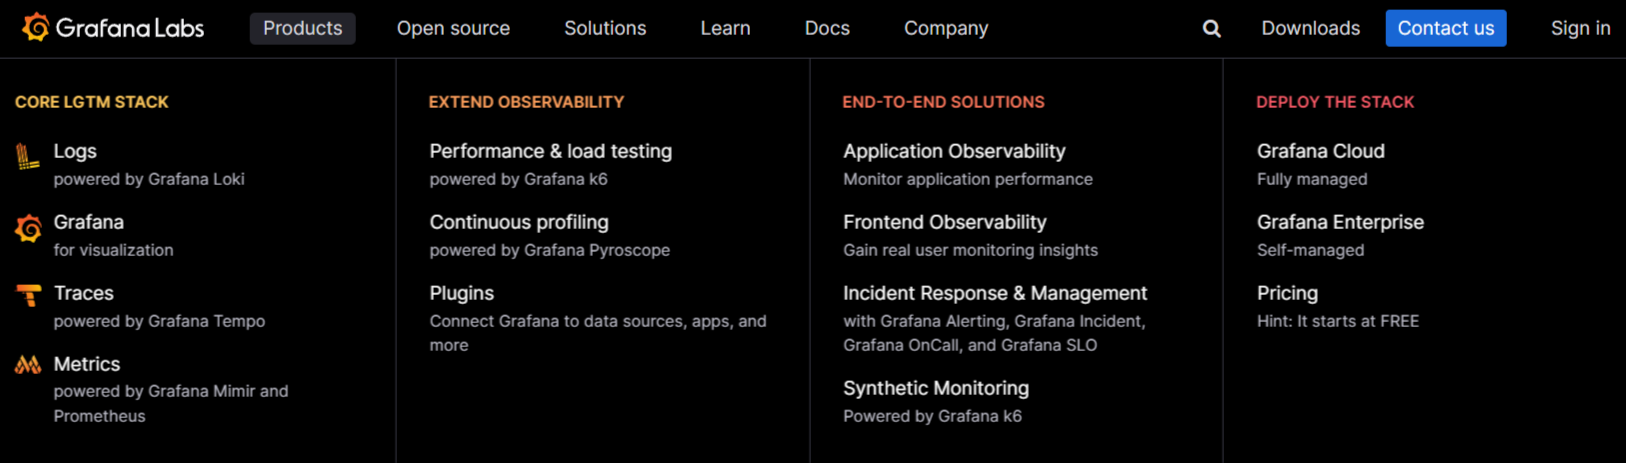
Grafana is an open-source visualization tool that provides a powerful platform for monitoring and analyzing your metrics. It consolidates data from various sources like Graphite and Prometheus into interactive, unified dashboards.
With Grafana, you can visualize, query, and understand your data through detailed charts and graphs. It simplifies tracking application performance and gaining insights, making it an essential tool for observability and data analysis.
Grafana offers products like Grafana for data visualization, Loki for log management, Tempo for tracing, Mimir for scalable metrics, OnCall for incident management, and Grafana Cloud for a fully managed observability stack.
Feature Comparison
APM: New Relic
New Relic APM provides comprehensive monitoring for applications and microservices. It automatically collects metrics, events, logs, and transactions (MELT) using agents integrated at the code level.
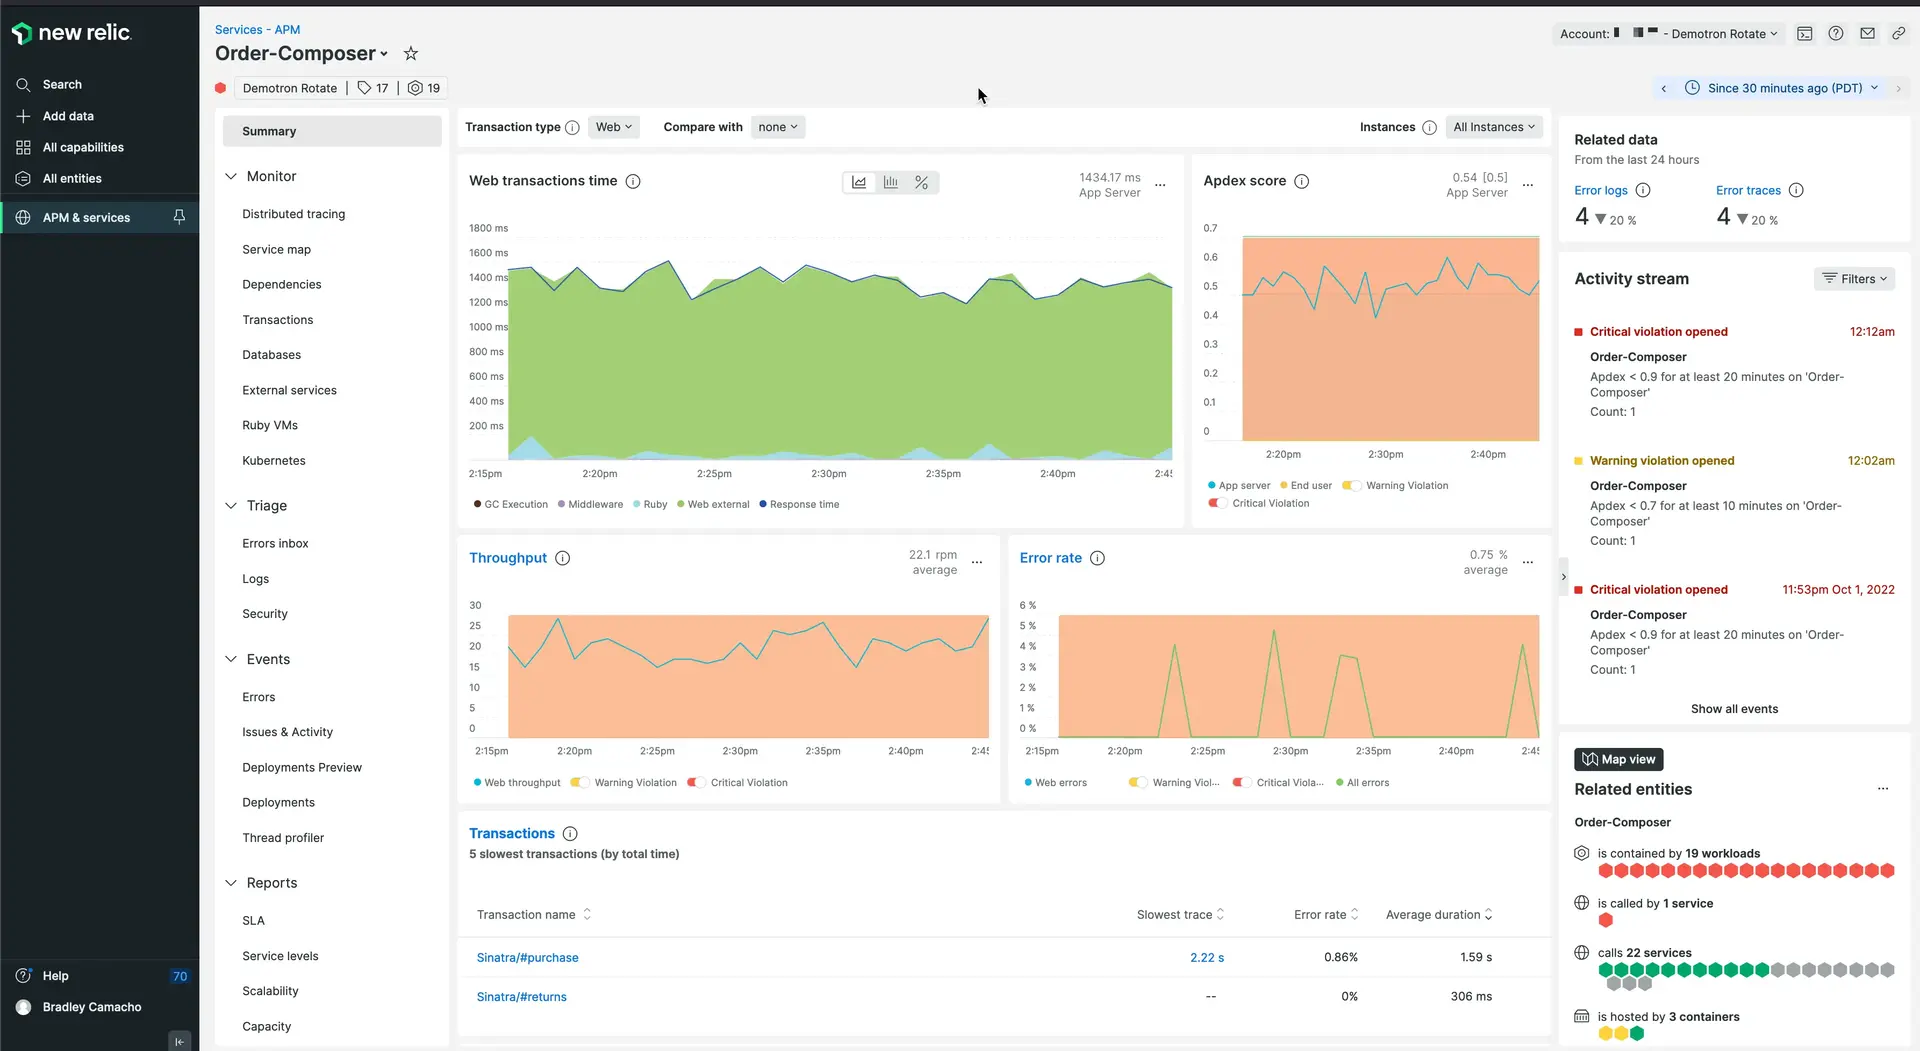
The platform offers pre-built dashboards, error tracking, and relationship maps, allowing users to monitor the health of their apps and identify performance issues in real time. It supports a wide range of languages and delivers flexible, customizable insights through its user-friendly interface.
Grafana APM, integrated within Grafana Cloud, focuses on observability with strong visualization capabilities. It allows users to monitor application performance through traces, logs, and metrics.
It is designed for open-source environments and supports Prometheus, Loki, and Tempo. Its strength lies in its flexibility and customization, offering a unified view across different data sources.
When deciding New Relic vs. Grafana for APM, it comes down to your specific requirements. New Relic excels with comprehensive monitoring and easy-to-use dashboards, making it ideal for those seeking an all-in-one APM solution. Grafana shines in open-source environments with its flexibility,and powerful visualizations.
Key Questions to Ask Before Choosing:1. Do you need seamless setup with pre-built dashboards (New Relic)?
2. Is customization and multi-source integration a priority (Grafana)?
3. What is your budget?
Log Management: New Relic
New Relic automatically collects logs from applications and displays them in the logs tab. It captures both infrastructure and application logs seamlessly with no additional setup required.
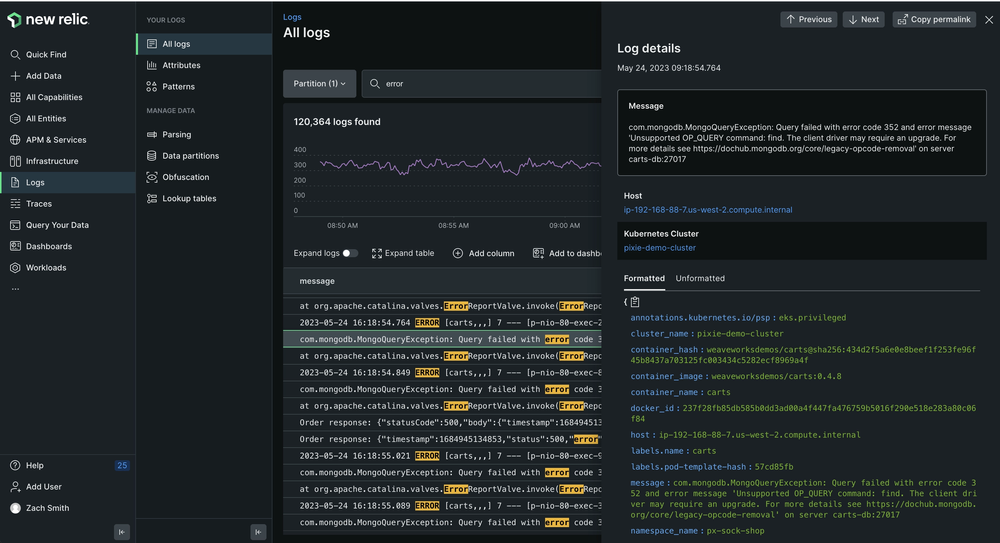
Logs can be forwarded using APM agents, infrastructure agents, third-party services, the Log API, TCP endpoint, or the OpenTelemetry SDK. This provides comprehensive visibility into performance data, including events, errors, and traces. The unified logs UI helps in spotting patterns and examining log lines in detail. It facilitates quick troubleshooting and reduces MTTR.
Grafana integrates with Loki for efficient log management, utilizing LogQL for complex queries, field extraction, and pattern matching. Grafana Cloud Logs supports storing and querying logs from all applications and infrastructure.
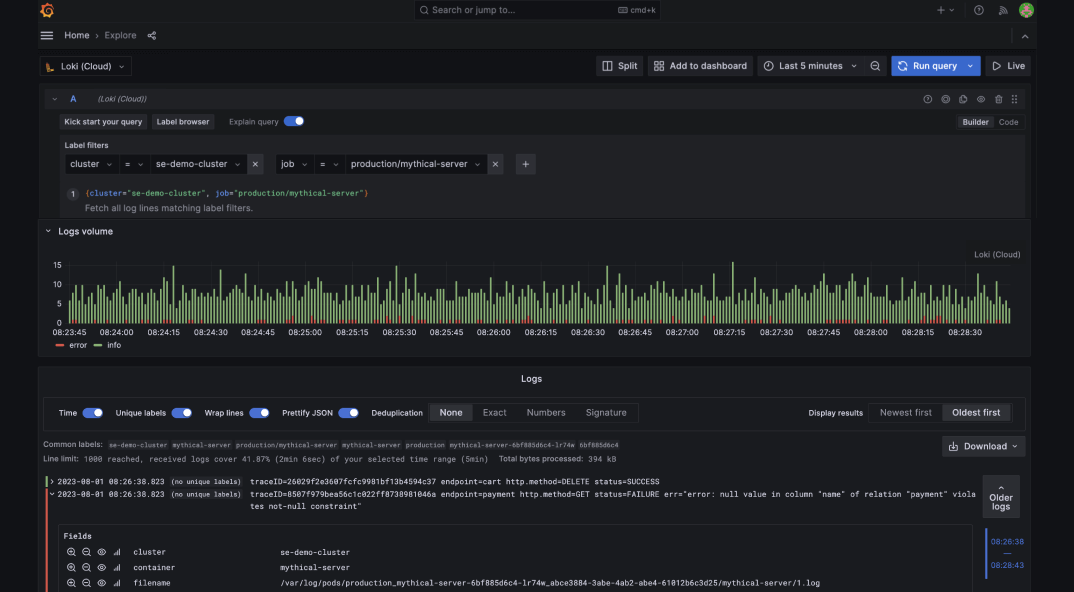
It handles out-of-order log ingestion and log bursts, ensuring no data loss. Grafana also manages issues related to log volume, costs, and storage limits, simplifying the overall log management process.
Choosing between New Relic vs. Grafana for log management depends on your needs. New Relic offers easy, automatic log collection with a user-friendly interface for quick troubleshooting. Grafana, with Loki, is great for advanced log queries and handling large log volumes, especially in open-source setups.
Key Questions to Ask Before Choosing:1. Do you need logs collected automatically with minimal setup (New Relic)?
2. Do you prefer more control and flexibility in querying logs (Grafana)?
Infrastructure Monitoring
New Relic's Infrastructure monitoring provides deep visibility into system performance, helping you manage and optimize resources effectively. The Inventory page offers a centralized view of all infrastructure entities, enabling quick searches across hosts. The Events page tracks important activities like configuration changes, restarts, and SSH sessions, ensuring comprehensive monitoring.
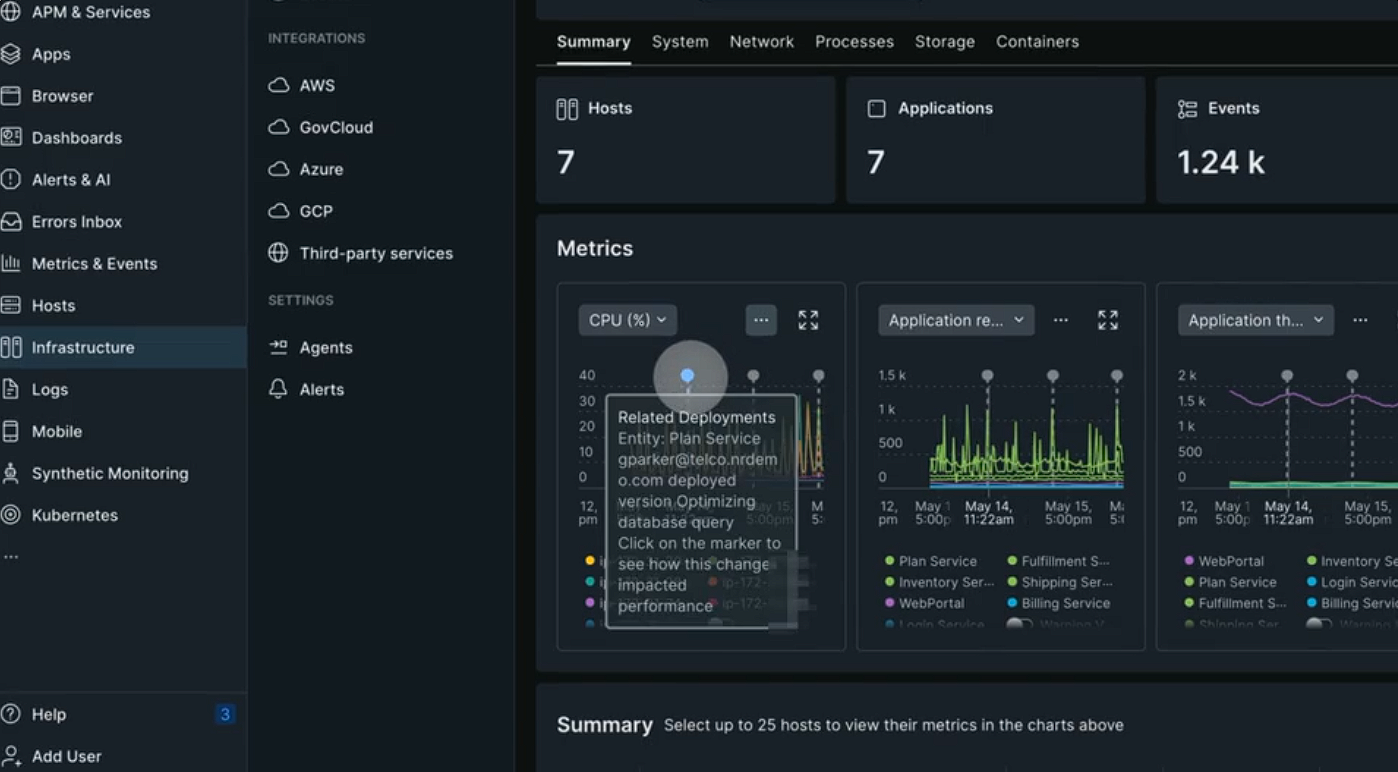
With secure data collection, you can confidently keep your monitoring updated. Key metrics like throughput, response time, and errors are easy to track, while dynamic charts allow you to correlate performance drops with relevant host and APM metrics. Additionally, CPU and memory monitoring for hosts, containers, and VMs help identify under-provisioned resources.
Grafana Cloud monitors AWS, Kubernetes, and other integrations like Linux machines and databases. It provides a managed Grafana instance with powerful visualization and alerting tools, letting me focus on monitoring without managing the infrastructure. I could also create custom dashboards to track specific metrics.
When choosing between Grafana and New Relic for infrastructure monitoring, consider the costs. Both tools can be pricey, but expenses may vary based on your monitoring needs.
Incident Management
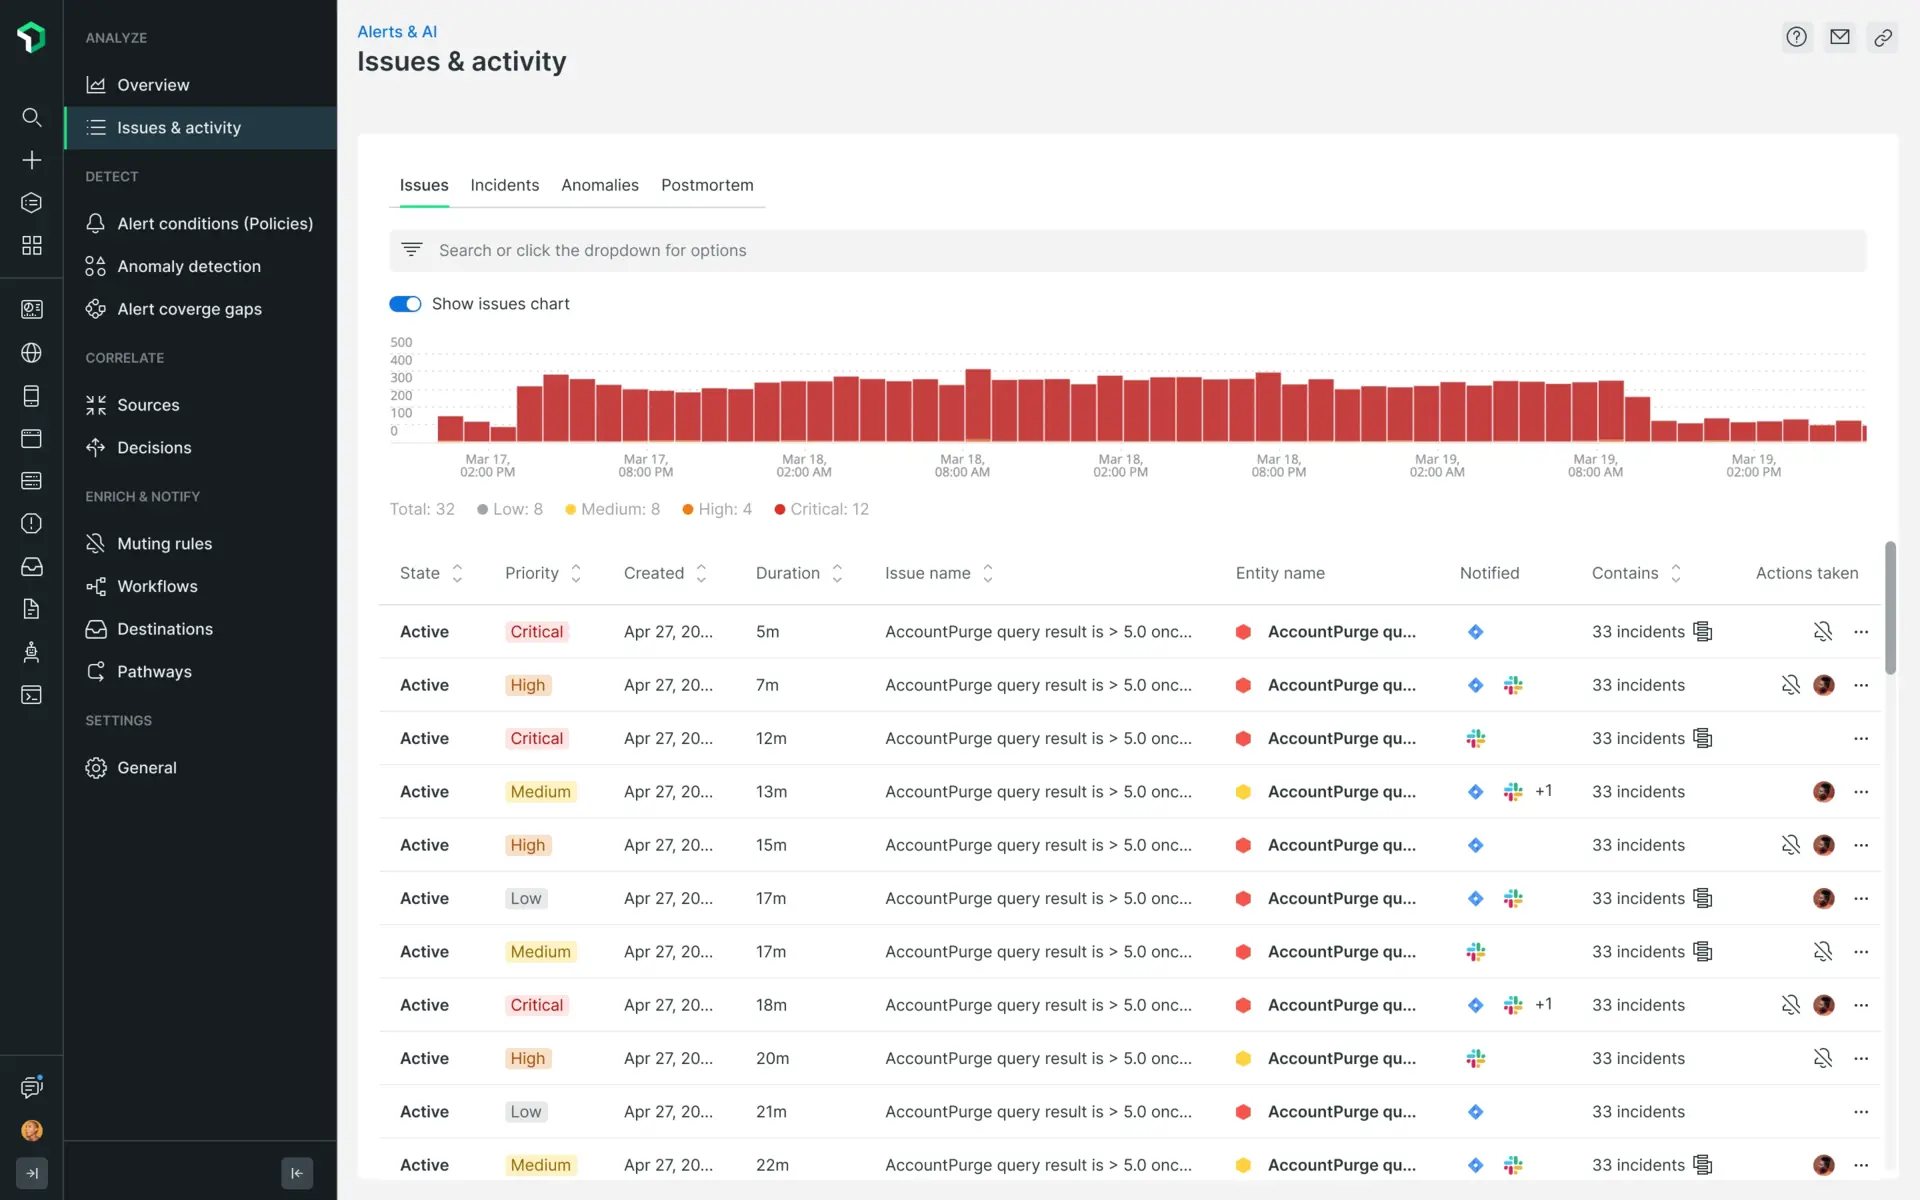
New Relic provides a comprehensive overview of issues through its Issues Feed page, which includes detailed information like analysis summaries, event logs, and correlated issues. Users can search and filter issues easily, and view impacted entities on a map to understand affected services and resources.
New Relic’s dashboard includes sections for issue payload, destinations, duration, number of incidents, and incident lists, allowing for thorough tracking and management.
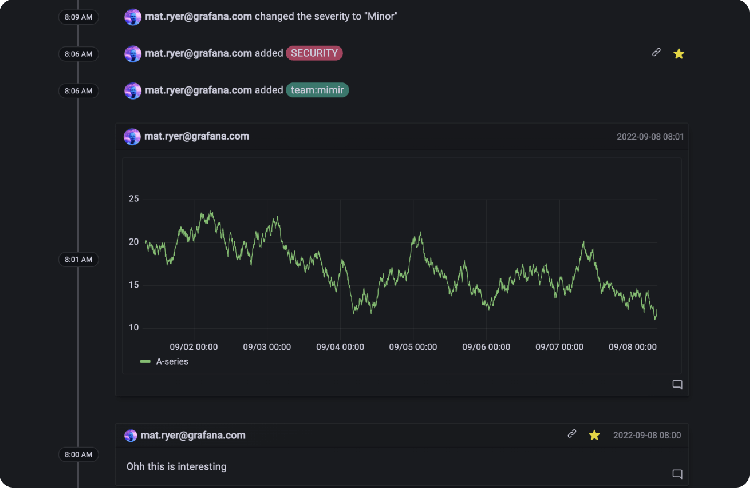
Grafana Incident focuses on enhancing incident response efficiency. During an incident, Grafana Incident automates tasks, assigns roles, and passively collects context to document learnings, so you can focus on what’s important.
It includes an interactive chatbot for managing incidents directly from Slack, allowing users to assign roles and update severity. It also features AI-driven tools like Sift, which helps diagnose incident causes, and Auto-Summary, which automatically summarizes key details from incident timelines.
New Relic offers a detailed and organized incident management solution. It’s perfect for teams that need structured incident tracking with deep analysis. Grafana, on the other hand, focuses on incident response efficiency. Grafana is ideal for teams that prioritize automation and flexibility.
Dashboards: Grafana
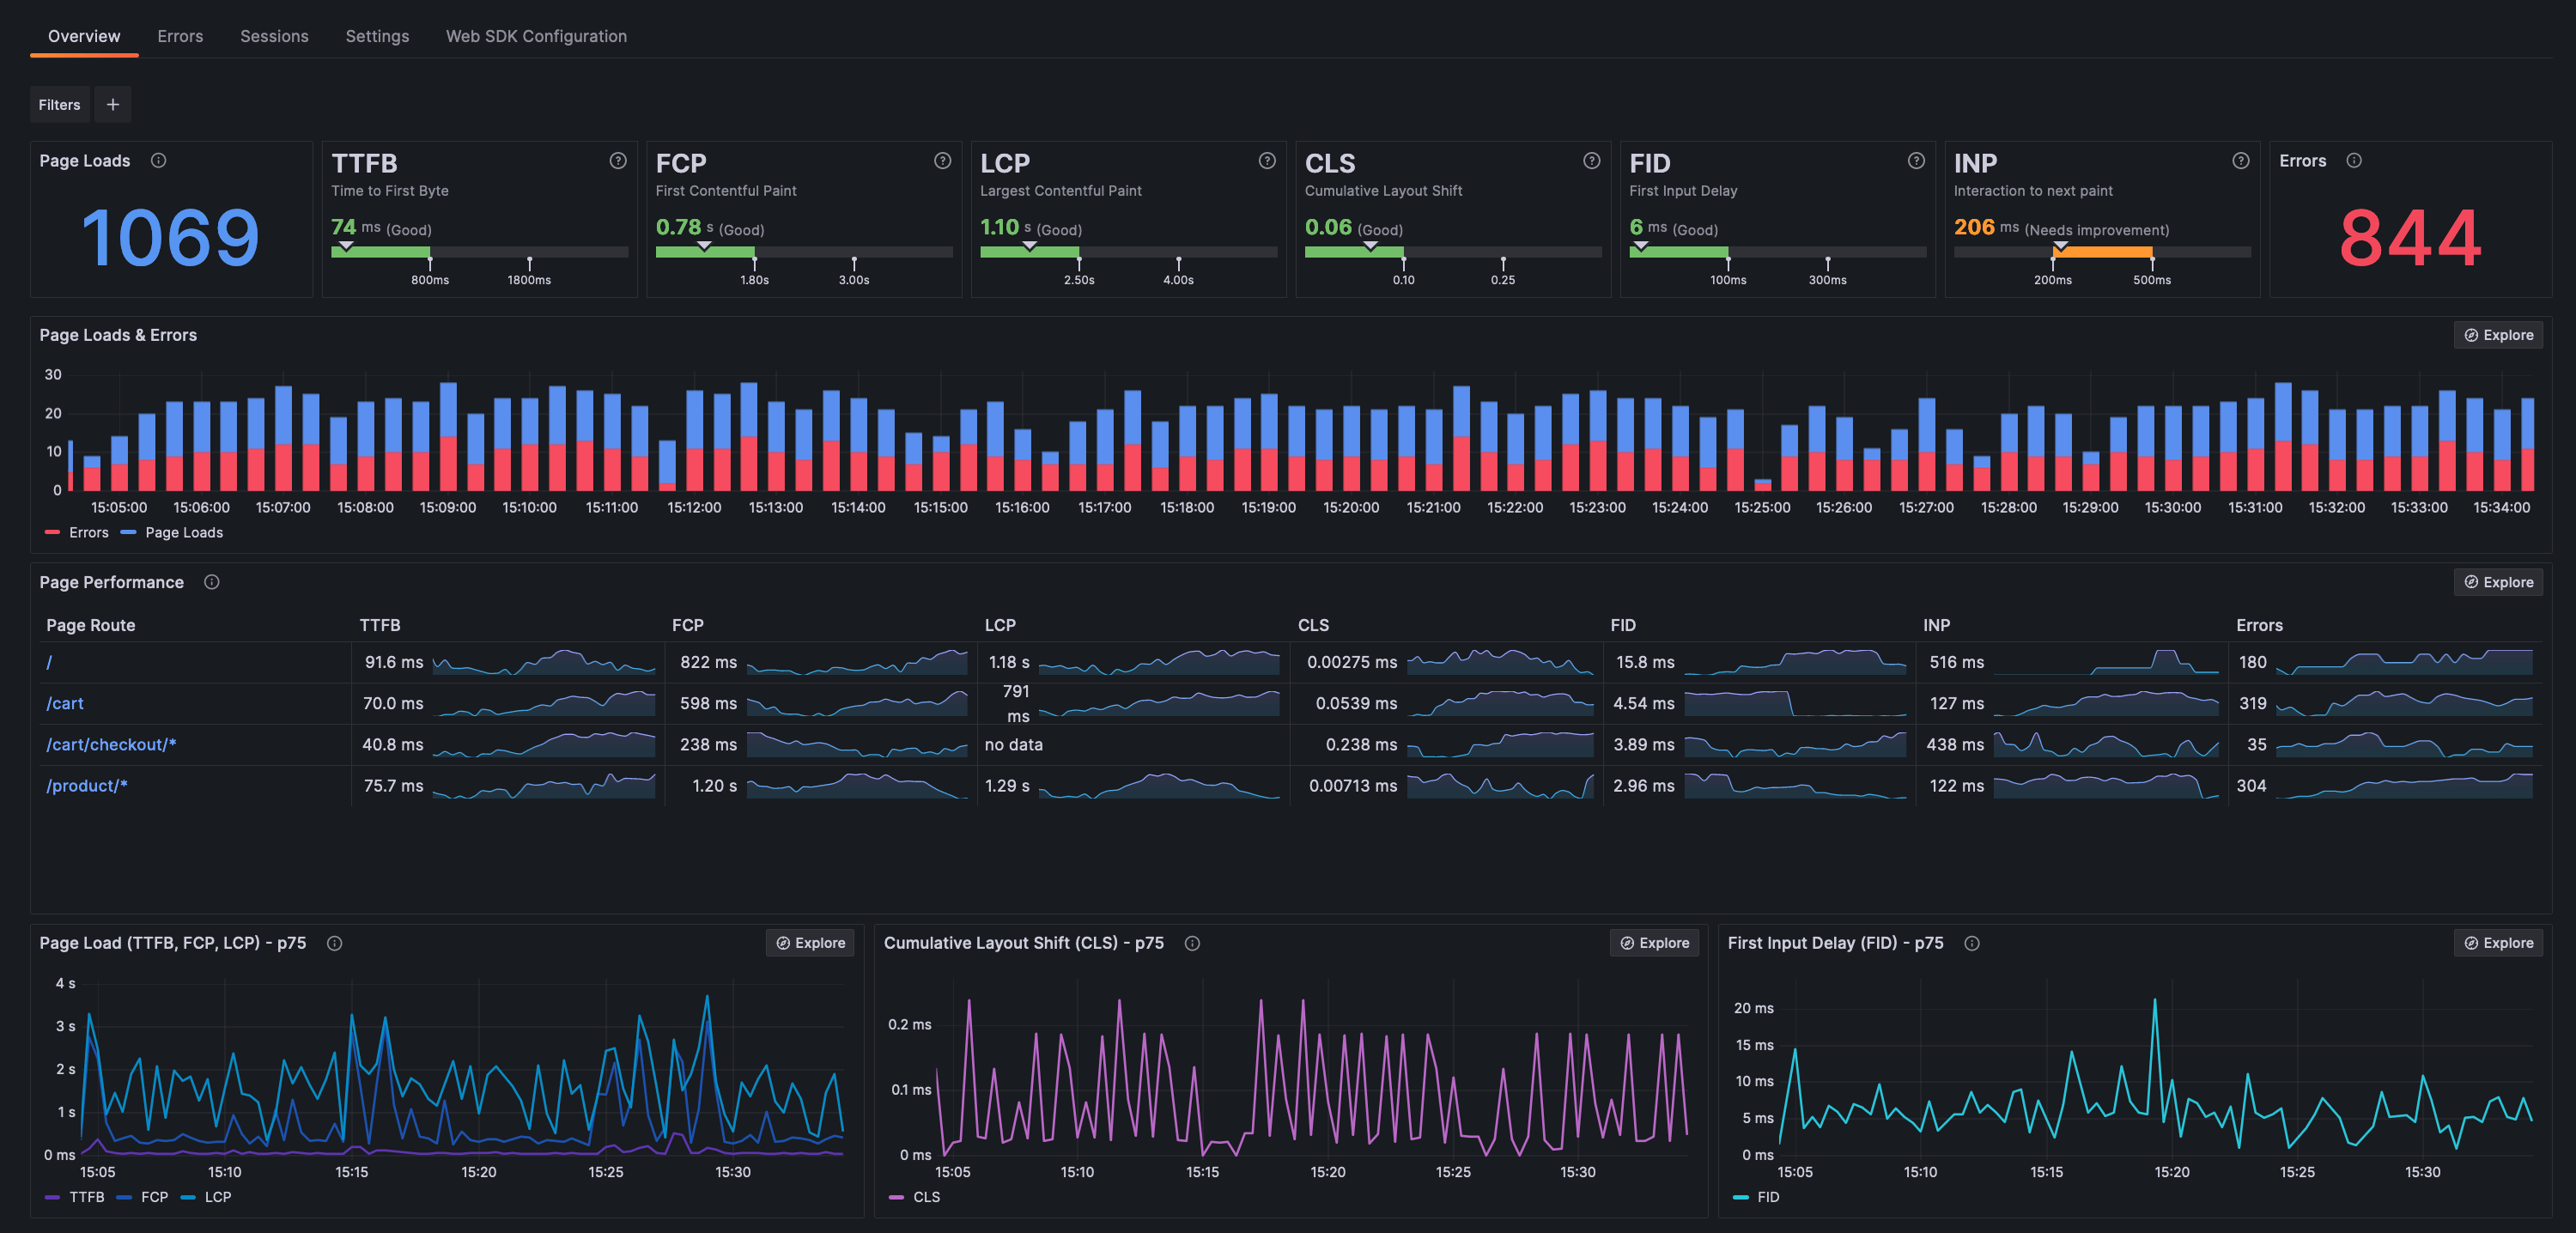
New Relic allows you to easily query data across your stack with customizable dashboards tailored to your needs. It lets you apply filters and build dynamic views for precise insights. You can access hundreds of pre-built dashboard templates relevant to your team or create your own.
New Relic simplifies dashboard creation, configuration, and export with the NerdGraph API. The New Relic provider for Terraform lets you manage dashboards as code, making updates and replication easier.
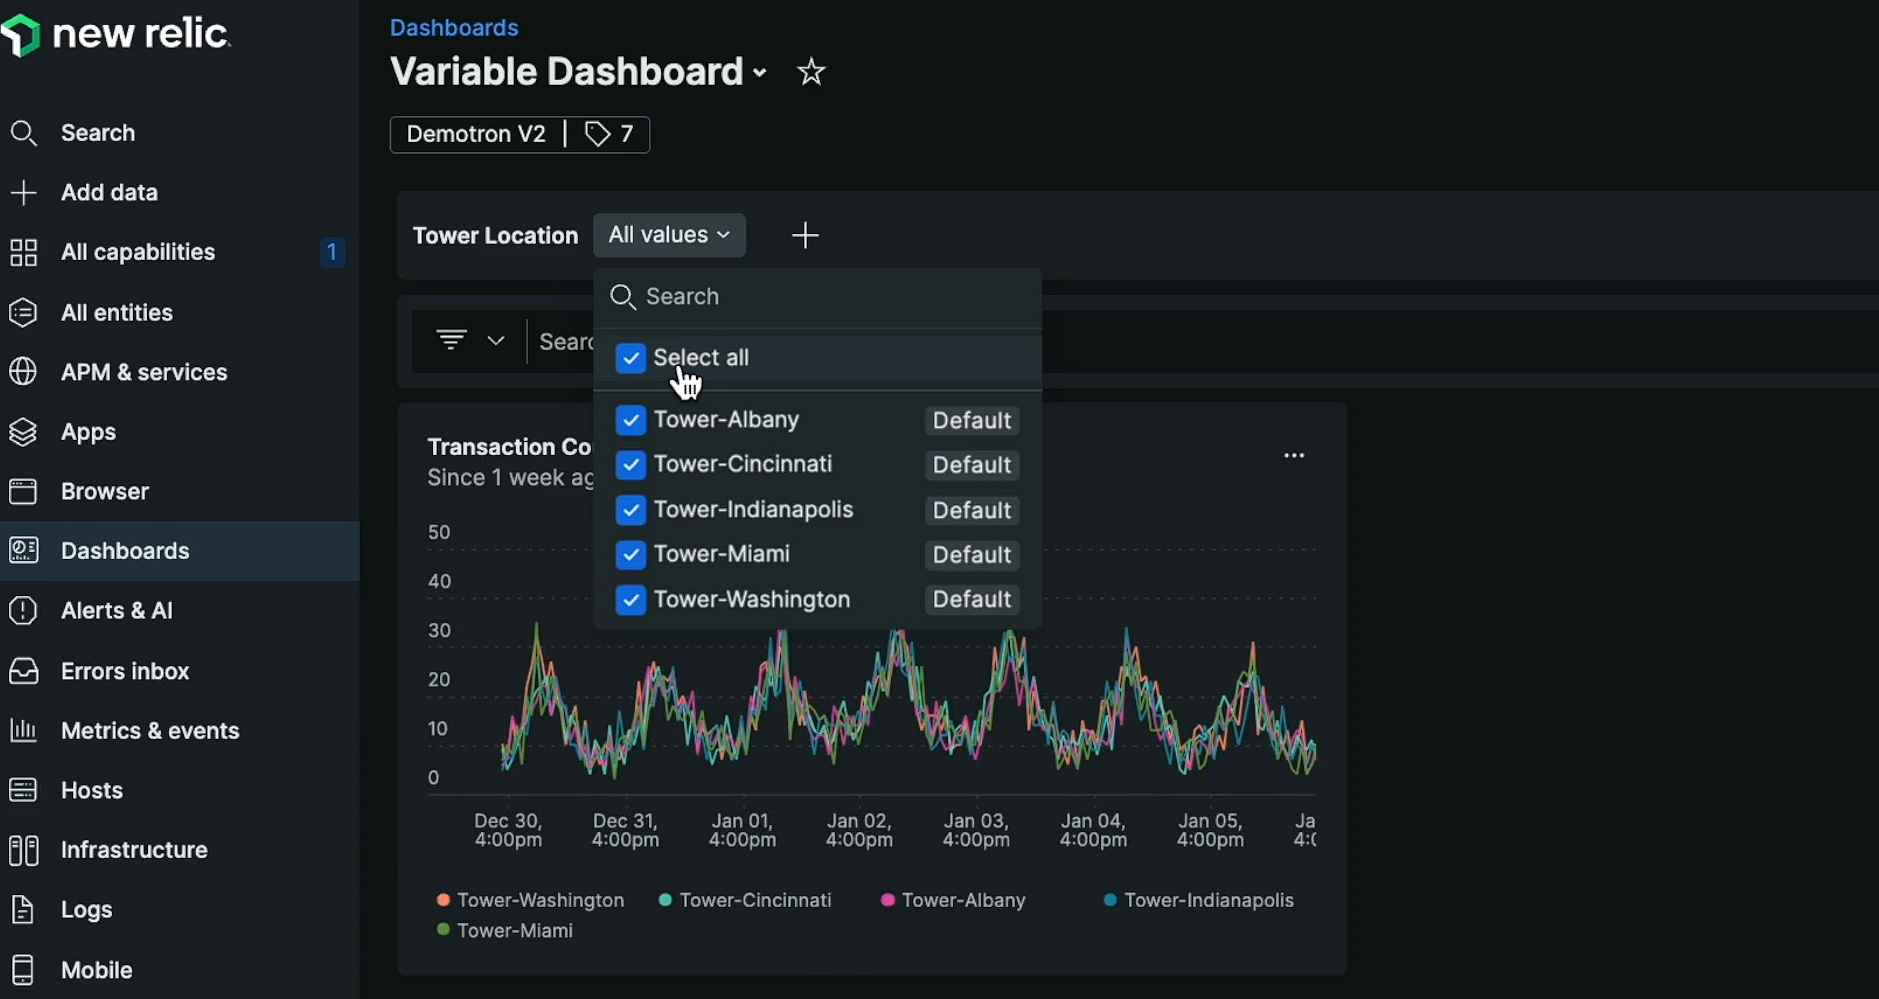
Grafana dashboards let you visualize metrics, logs, and traces from various systems using panels, providing an overview of your system’s health and status. They typically use time series data to show how your system's performance changes over time, helping you spot issues like CPU spikes or rising error messages. Each Grafana dashboard is composed of multiple panels that display this information.
New Relic offers ready-made templates and customizable dashboards that are easy to manage through APIs, making it a good fit if you need pre-built options
Key Questions to Consider:1. Do you need simple pre-built templates and easy setup (New Relic)?
2. Are you looking for more customization and advanced visualizations (Grafana)?
Visualization: Grafana
When creating a New Relic dashboard, you can add and customize various out-of-the-box charts, including resizing, renaming, and adjusting data queries. However, if the default charts don’t meet your needs, you can build custom visualizations using the New Relic One SDK.
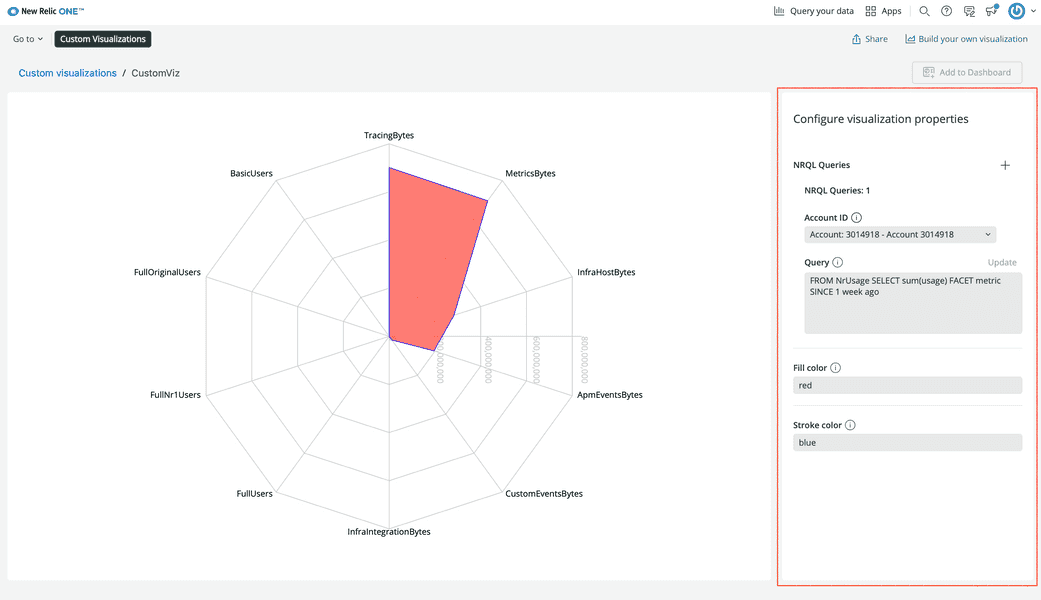
The SDK allows you to create Nerdpacks containing your visualization code, using React components, data queries, and external libraries. You have control over customization options like colors, sizes, and data sources, and can even integrate third-party components for a different look.
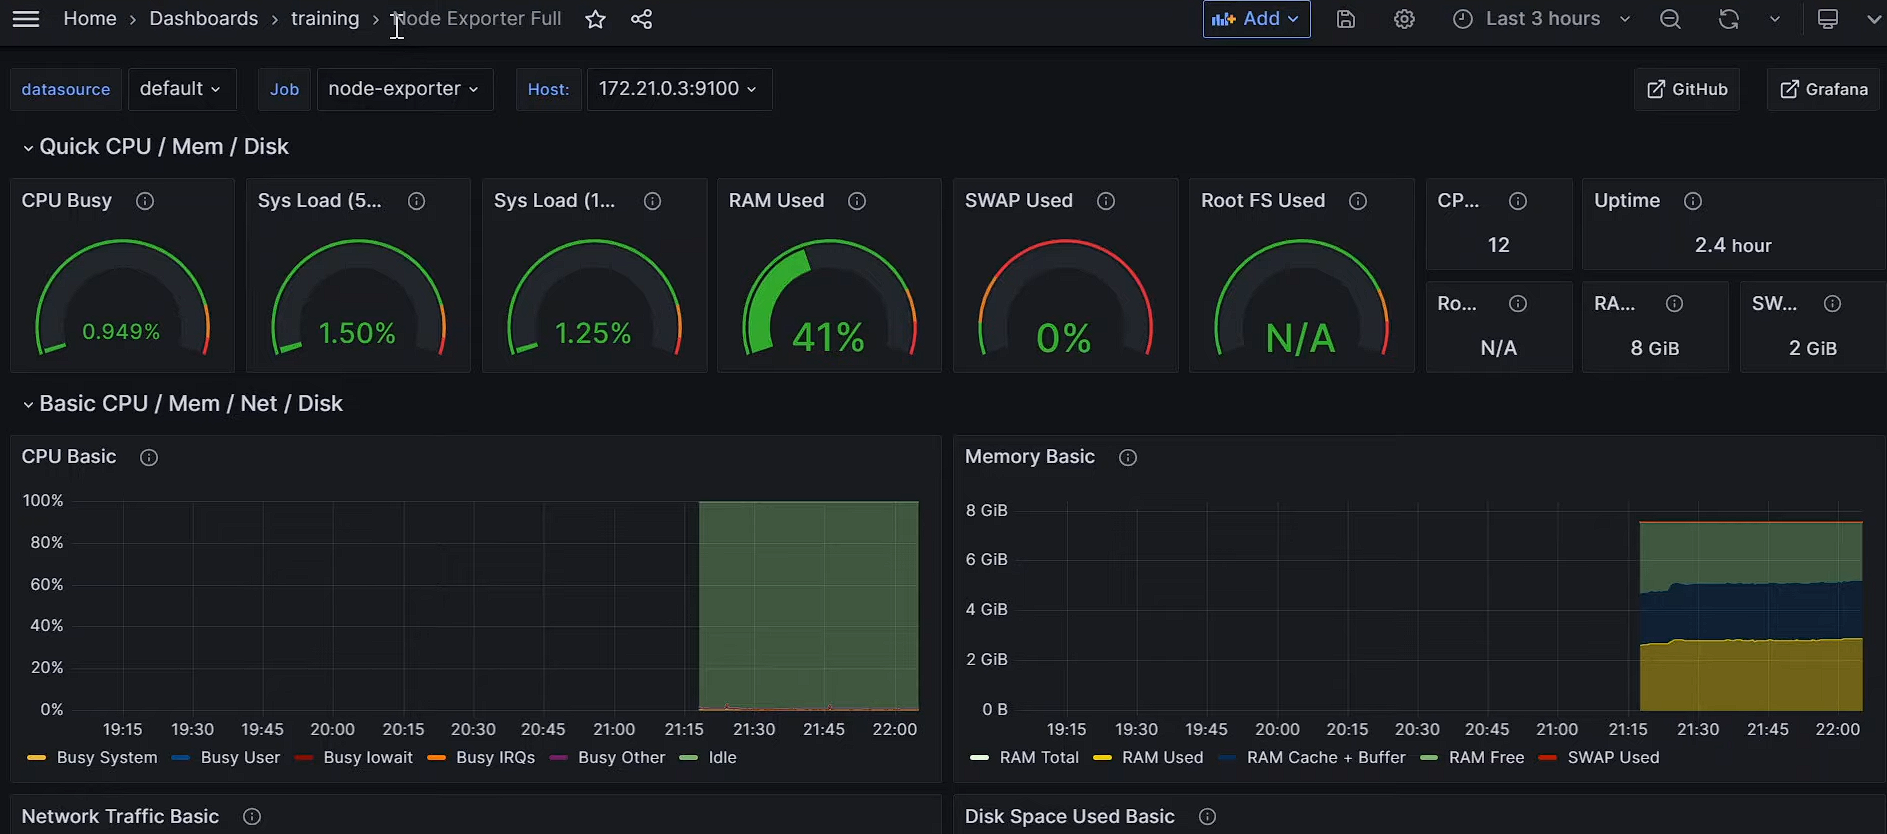
Grafana provides extensive visualization options, offering everything from time series and bar charts to heatmaps and state timelines. You can adjust almost every aspect of your visualizations, including colors, labels, data formatting, and thresholds, making it easy to customize dashboards to your needs.
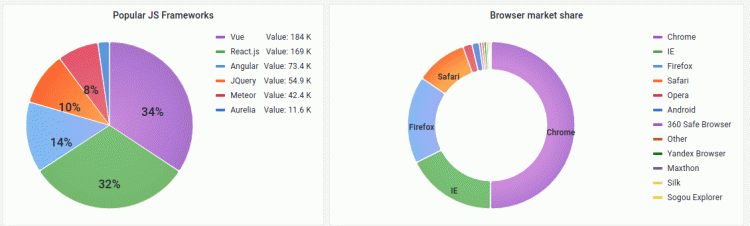
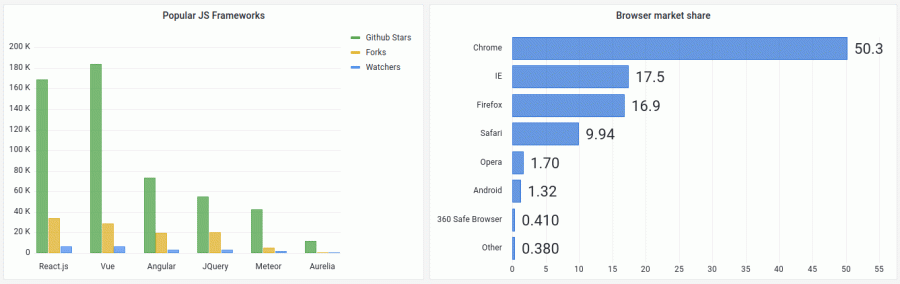
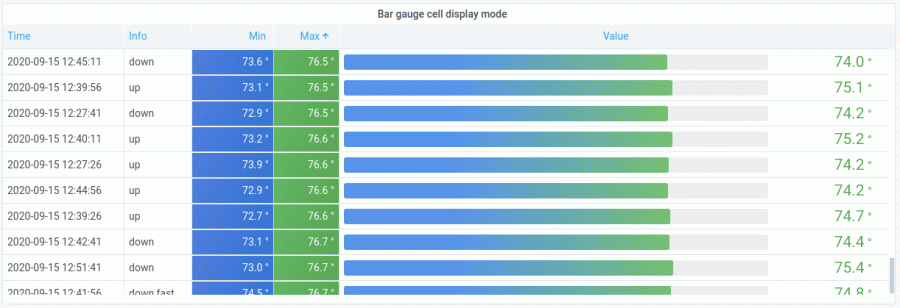
Grafana also suggests visualization types based on your panel queries, helping you choose the best fit for their data. The platform’s instant preview feature lets you see the changes as you apply them. With support for numerous data sources and plugins, Grafana allows for seamless integration and extended functionality, making it versatile for monitoring both metrics and logs within a unified interface.
New Relic offers easy-to-customize out-of-the-box charts with options to build advanced visualizations. Grafana excels in offering a wide range of customizable visualizations. It’s a strong choice for those needing extensive customization across multiple data sources.
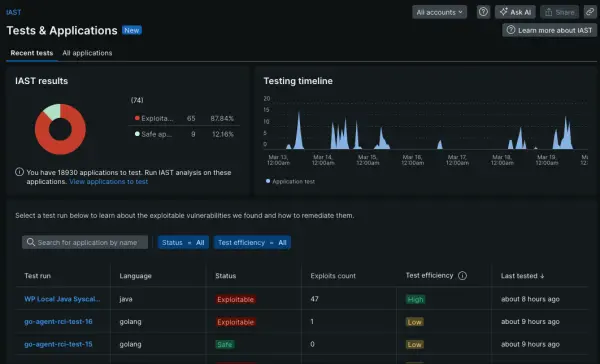
Application Security: New Relic
New Relic uses Interactive Application Security Testing (IAST) for application security. This method provides precise identification of vulnerabilities. It helps you find, fix, and verify high-risk vulnerabilities early. With 360-degree visibility and zero false positives, New Relic ensures your applications are more secure.
Grafana focuses on visualization and monitoring rather than application security directly. However, it can be integrated into security workflows to monitor security-related metrics and alerts.
New Relic provides built-in security, whereas Grafana doesn’t focus on security directly.
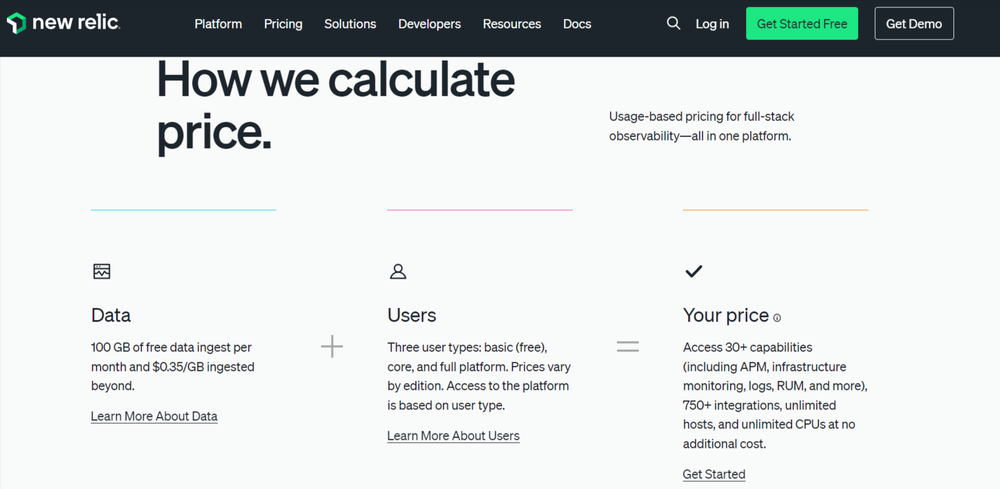
Pricing: Grafana
New Relic provides usage-based pricing, starting with 100GB of free data ingestion per month. If you exceed this limit, you'll be charged $0.30 per GB or $0.50 per GB, depending on your plan.
Grafana’s open-source version is available for free. For advanced features and enterprise-level support, Grafana also offers paid options.
Grafana Cloud provides three pricing tiers: Free Forever, Pro Pay As You Go, and Advanced Premium Bundle. Each tier offers different features and usage limits to meet various needs.
Pros and Cons
New Relic
Pros:
- Easy Setup: Quick and simple to set up.
- Detailed Insights: Provides thorough performance data.
- Built-in Alerts: Includes alert features.
Cons:
- Expensive: Higher cost, especially for larger use.
- Complex Features: May be challenging to use all features.
- Limited Free Plan: Basic plan has few features.
Grafana
Pros:
- Custom Dashboards: Highly customizable visuals.
- Free Version: Basic version is free.
- Data Integration: Connects with many data sources.
Cons:
- Requires Setup: Needs configuration to use fully.
- Basic Alerts: Limited alerting functions.
- No Data Collection: Does not collect data itself.
New Relic vs Grafana: The Final Verdict
New Relic is a great choice for beginners due to its ease of use and comprehensive all-in-one solution. It provides built-in monitoring and analytics with minimal setup, making it straightforward to start tracking your applications and infrastructure. Its user-friendly interface and automatic insights are perfect for those new to observability.
Grafana, on the other hand, is ideal if you’re looking for flexibility and customization. While it requires more initial setup, it allows for extensive personalization and integration with various data sources. Its open-source nature and powerful visualization capabilities make it a strong tool for those who want to dive deeper into data analysis and dashboard creation.
Atatus: A Better Alternative to New Relic and Grafana
- Full-Stack Monitoring: Atatus provides comprehensive monitoring for applications, infrastructure, and logs, similar to New Relic, offering full-stack observability in one platform.
- User-Friendly Interface: Atatus features an intuitive and easy-to-use interface, making it accessible for teams without the steep learning curve associated with more complex tools like New Relic and Grafana.
- Integrated Monitoring: Atatus offers integrated monitoring for logs, traces, and metrics, reducing the need for multiple tools and simplifying your monitoring stack.
- Cost-Effective Solution: Atatus often comes at a more competitive price point, making it a cost-effective alternative to New Relic.
- Simpler Setup: Atatus is easier to set up and manage compared to New Relic and Grafana, which requires more manual configuration.
- Built-In Custom Dashboards: Atatus provides built-in, customizable dashboards, eliminating the need for additional tools.
- Real-Time Alerts: Similar to New Relic, Atatus offers real-time alerts and AI-driven insights, helping teams quickly detect and resolve issues before they affect users.
New to Atatus? Try it out with a 14-day free trial.
#1 Solution for Logs, Traces & Metrics
![]() APM
APM
![]() Kubernetes
Kubernetes
![]() Logs
Logs
![]() Synthetics
Synthetics
![]() RUM
RUM
![]() Serverless
Serverless
![]() Security
Security
![]() More
More


![New Relic vs Sentry - Which Monitoring Tool to Choose? [2026]](/blog/content/images/size/w960/2024/10/VS--1-.png)