New Relic vs AppDynamics - A Detailed Comparison for 2025
New Relic and AppDynamics are leading monitoring and observability tools for monitoring the performance of your applications and network. Both help you keep track of how well your systems are running, but they do it in different ways.
New Relic is a great tool for APM, making it versatile for tracking overall system performance. It also features an easy-to-use interface and strong data visualization.
AppDynamics is great for detailed problem analysis and monitoring complex systems, making it suitable for large organizations. In this blog, we will compare New Relic and AppDynamics to show their strengths and help you decide which tool fits your needs best.
In this blog post:
- What is New Relic?
- What is AppDynamics?
- Application Performance Monitoring(APM)
- Log Management
- Infrastructure Monitoring
- Synthetic Monitoring
- Documentation
- Pricing Comparison
- Final Verdict: New Relic vs AppDynamics
- Atatus: A Better New Relic and AppDynamics Alternative
What is New Relic?
New Relic is a monitoring tool that offers engineers real-time insights into the performance and behaviour of digital systems. With over 30 features and support for more than 750 integrations, it leverages AI-driven insights to help users troubleshoot issues and enhance performance.
The platform provides a comprehensive set of tools, including Application Performance Monitoring (APM), log monitoring, infrastructure monitoring, and real-user monitoring. As a result, New Relic delivers a holistic view of your system, enabling more effective monitoring, improved reliability, and increased efficiency.
Key Features of New Relic
- Full-Stack Observability: New Relic offers comprehensive visibility across your entire system, covering applications, infrastructure, and logs, all within a single platform.
- Real-Time Monitoring: It provides real-time monitoring and alerts, allowing you to detect and address performance problems as they occur.
- AI-Powered Insights: With AI and machine learning, New Relic automatically spots anomalies and delivers insights to help you quickly pinpoint and fix issues.
- SIEM: New Relic's SIEM feature integrates security information and event management to provide real-time visibility into application security and performance.
- Custom Dashboards: Users can build customizable dashboards using drag-and-drop widgets, making it easy to track key metrics and performance data in a way that suits their needs.
- Distributed Tracing: This feature lets you follow requests as they move through services, offering a clear view of complex microservices systems.
- Integrations: New Relic integrates with many popular tools and platforms, ensuring smooth data flow and boosting your monitoring capabilities.
What is AppDynamics?
AppDynamics is a comprehensive business observability platform that provides deep insights into the performance of your entire technology stack. It offers tools for monitoring infrastructure, applications, databases, and SAP environments, allowing you to track performance metrics in real time.
The platform includes Application Performance Monitoring (APM) to identify and resolve performance issues, End-user Monitoring to track user interactions, and AI-powered insights to help quickly pinpoint problems. With its robust monitoring capabilities, AppDynamics enhances both operational efficiency and user experience.
Key Features of AppDynamics
- Cloud Migration: Plan and manage cloud migrations smoothly with full visibility into applications, infrastructure, and network functions.
- Infrastructure Monitoring: Monitor networks, servers, and containers to ensure infrastructure stability and performance.
- Cloud Native Application Observability: Correlate all telemetry data for a unified view across the entire cloud native environment.
- SAP Monitoring: Monitor the entire SAP environment for seamless performance across the SAP landscape.
- Flow Maps: Visualize application flows with tiers, nodes, and business transactions in one clear, dynamic map.
- Microservices: Monitor business transactions and health across microservices and containers (AWS, Docker, Kubernetes) for efficiency.
- Serverless Monitoring: Ensure seamless user experiences by tracking serverless functions and gaining end-to-end visibility of performance.
Application Performance Monitoring(APM)
New Relic
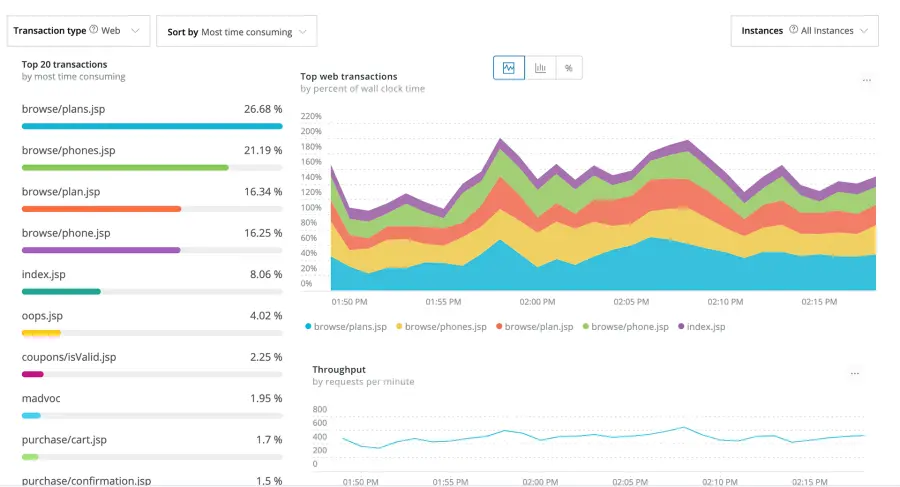
Signing up for a New Relic account was quick and easy. After that, I installed the language agent for my application. These agents automatically collect performance metrics from the app and send them to New Relic APM.
Once the agent was installed, I generated some traffic to the application and logged into my account. Within a few minutes, data started flowing, and I could see pre-built dashboards on the APM Summary page. These dashboards provided an instant overview of my application's performance without needing any customization.
AppDynamics
Using AppDynamics has been very helpful for monitoring both application and business performance. It provides real-time insights and automatically detects issues to keep things running smoothly.
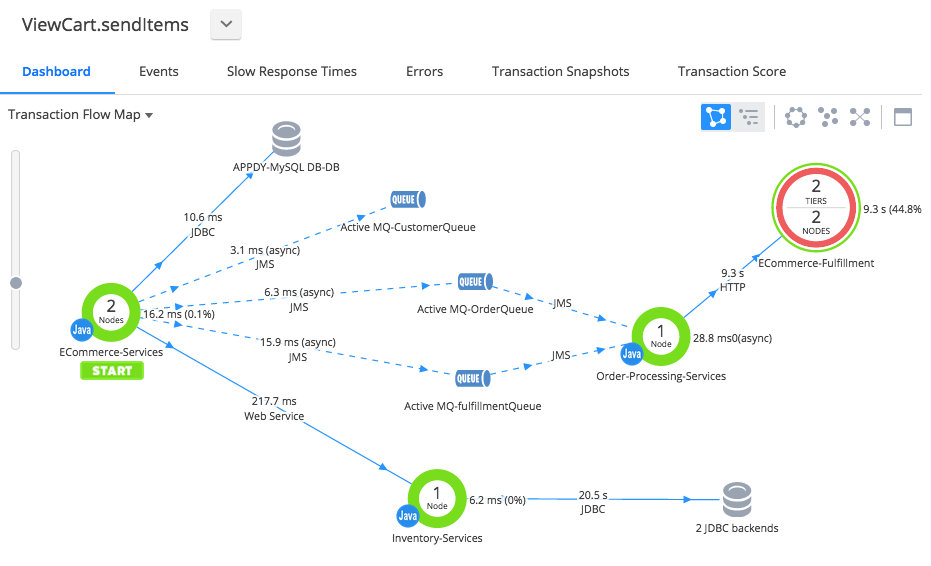
The tool automatically gathers data and metrics, creating clear flow maps that show how data moves between different components, like web services, message queues, and databases. For example, in an e-commerce app, you can see exactly how data flows through various parts of the system.
The dashboard then aggregates key metrics, such as load, response time, and errors, making it easier to monitor performance and fix problems quickly.
New Relic vs AppDynamics for APM: Both New Relic and AppDynamics offer excellent APM capabilities, each with distinct strengths that cater to different needs and preferences.
Log Management
New Relic
Once I set up New Relic, I noticed that it automatically begins collecting logs from applications and displays them under the logs tab. It seamlessly captures both infrastructure and application logs without requiring any additional configuration. You can also forward logs to New Relic using various options, like the APM agent, infrastructure agent, third-party log services, the Log API or TCP endpoint, and even the OpenTelemetry SDK.
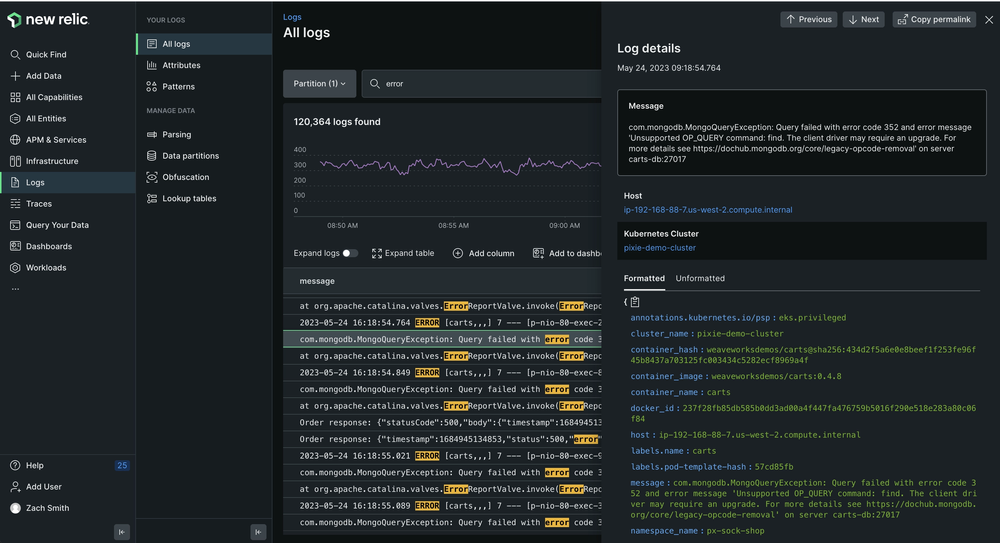
New Relic logs offer a deeper level of visibility into performance data, whether it’s events, errors, or traces. This has been incredibly useful in reducing MTTR (mean time to resolution) and addressing production issues quickly. The logs UI consolidates everything into one place, making it easy to spot key patterns.
I also appreciate the ability to explore more context around individual log lines, which provides even better insights into what’s happening within the application and infrastructure.
AppDynamics
To begin with log collection, you will need to set up a log collection agent and a log analytics engine. The agent handles gathering logs from your Kubernetes or App Service environment. AppDynamics offers flexibility by supporting a range of log collection agents like Fluentd, Logstash, and Filebeat.
Once your logs are collected, you can dive right into AppDynamics, where you will have the ability to search, filter, and analyze the data in real-time.
One feature I find particularly useful is the custom log parsing rules. These allow you to extract specific fields from the logs, making it much easier to generate custom metrics and build tailored dashboards. This has really helped me track key application metrics and spot trends over time. The real-time insights are invaluable, especially when you need to stay on top of performance issues.
New Relic vs AppDynamics for log management: AppDynamics offers better log management capabilities than New Relic.
Infrastructure Monitoring
New Relic
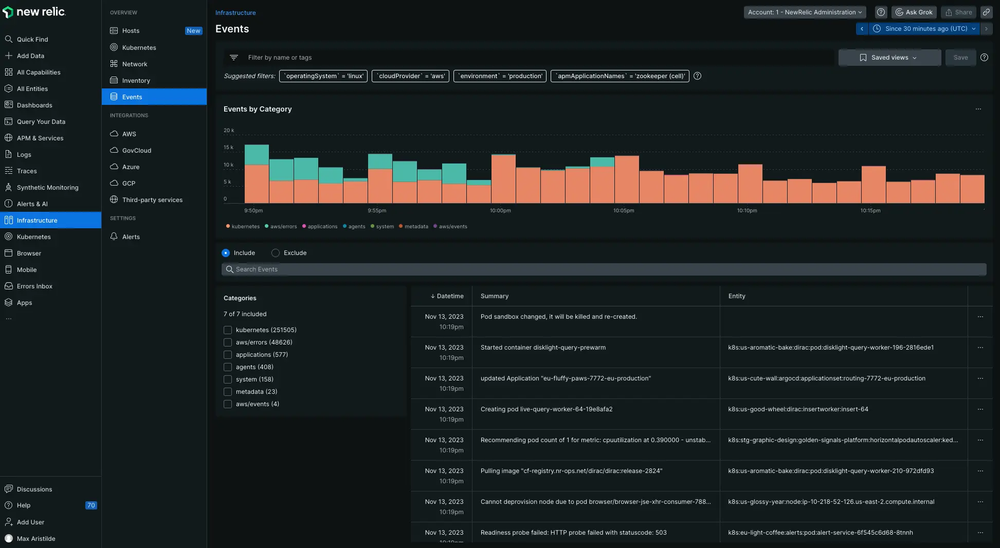
To get started with infrastructure monitoring, the first step is installing the agent, which can be done on Linux, macOS, or Windows systems. New Relic provides various deployment options based on your observability needs, and the documentation is clear, making the installation process smooth.
New Relic's infrastructure monitoring has given me excellent visibility into system performance. The Inventory page is great for quickly searching through all infrastructure entities across different hosts, while the Events page allows me to easily track configuration changes, restarts, SSH sessions, and more. The data is collected and displayed securely, ensuring my monitoring stays accurate and up-to-date.
AppDynamics
Installing application agents with the Controller UI is simple, especially with the getting started wizard. Setting up service monitoring through the service availability section in AppDynamics home is also quick and straightforward.
I rely on the metric browser to track infrastructure metrics, making it easy to manage both traditional and cloud environments. AppDynamics helps connect performance data with business goals, and its automated data collection makes monitoring effortless. For Kubernetes and containerized apps, the observability features are extremely helpful for quickly identifying and fixing performance issues.
New Relic vs AppDynamics for infrastructure monitoring: When it comes to infrastructure monitoring, AppDynamics excels with its in-depth insights and robust features.
Synthetic Monitoring
New Relic
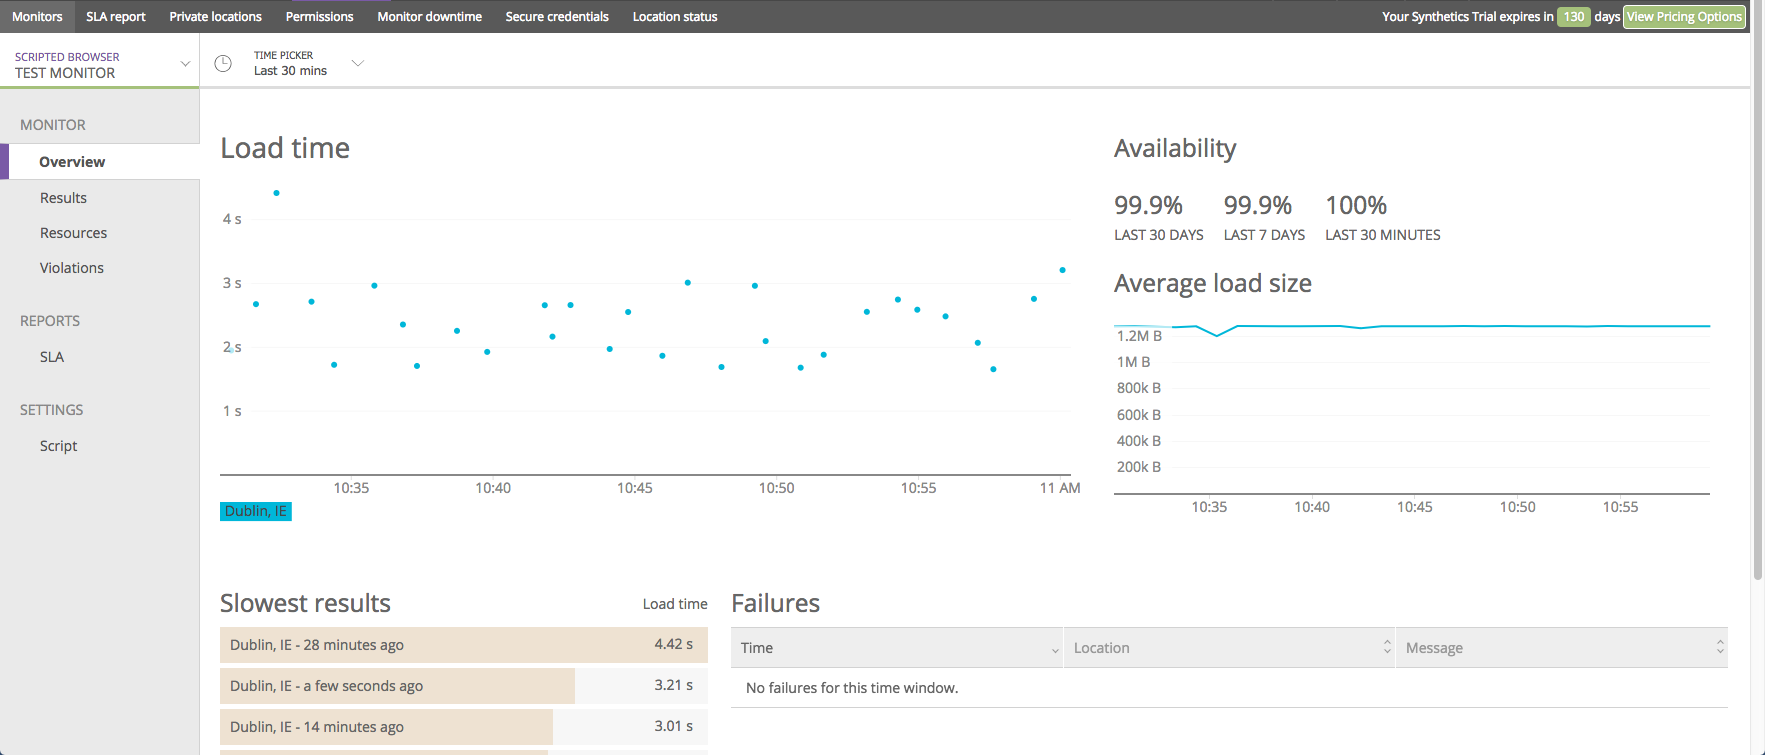
Once I signed into my New Relic account, I went straight to one.newrelic.com and navigated to synthetic monitoring. From there, I clicked on Create a monitor and chose the Page load performance option. I then pasted the URL of the page I wanted to test in the URL field.
Once the monitor started reporting, I could easily see all the data on the Synthetics Summary page. It gave me a clear overview of my website's performance, including trends in request/response times, connection times, and any errors. For detailed results, I headed to the Results page, where I could review individual monitor data. The Page Load Time graph was especially useful, giving me a quick snapshot of how performance changed over time.
When it came to troubleshooting, the Failures page helped me pinpoint downtime incidents and errors. I could select individual incidents to view them in detail and understand what went wrong.
AppDynamics
After opening my browser application and navigating to the Jobs page, I created a new job by clicking Create a New Job or Add for existing ones. On the Synthetic Job Dashboard, I monitored availability and performance trends. The Performance Trend column showed the performance status for each job.
In the Sessions page, I sorted session results and examined specific details. The Charts tab offered useful widgets, like the Lowest Availabilitys widget, which helped me identify and resolve location-specific issues efficiently. This setup provided a clear and effective way to monitor job performance.
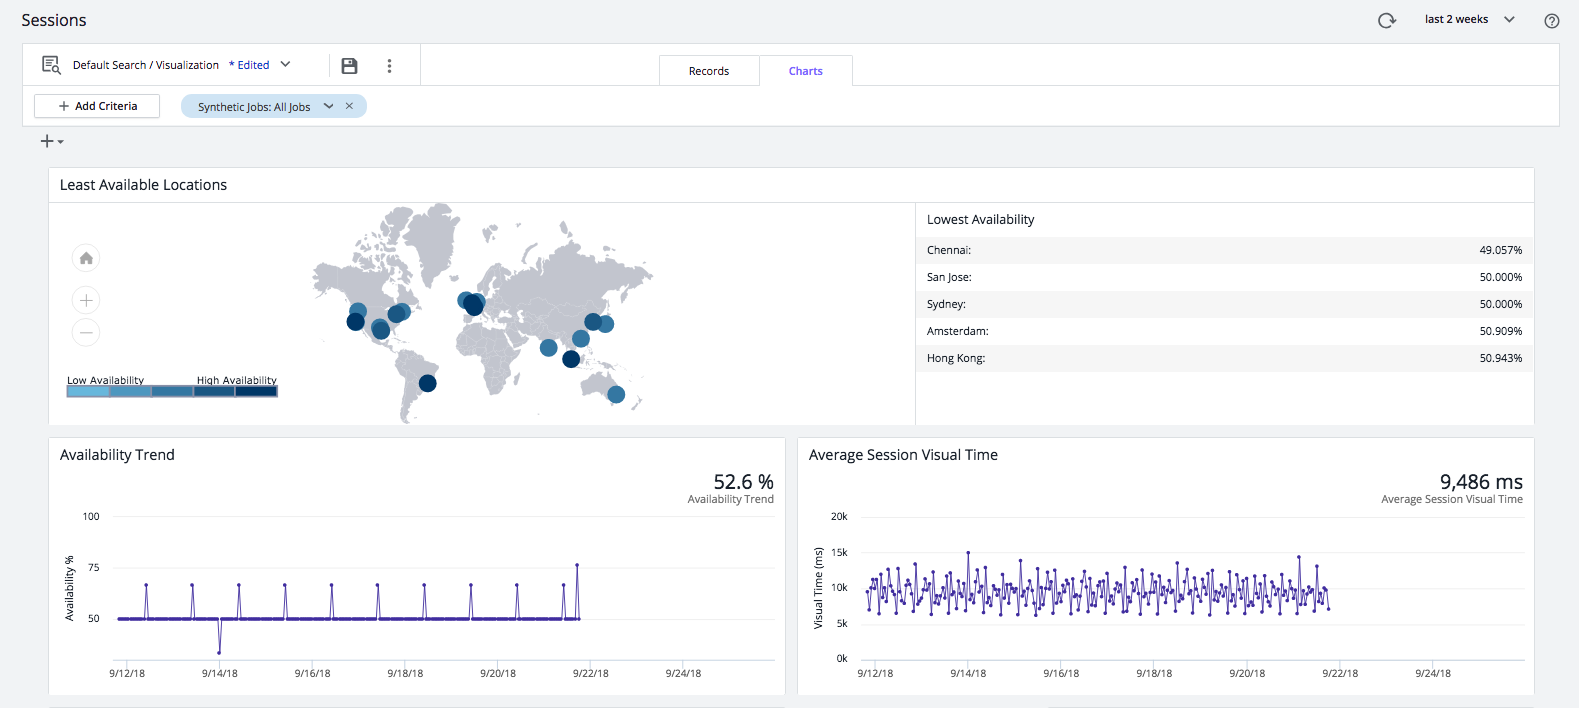
New Relic vs AppDynamics for synthetic monitoring: AppDynamics does synthetic monitoring better than New Relic because it collects data from both real users and synthetic users.
Documentation
New Relic
New Relic’s documentation stands out for its well-structured format, offering clear step-by-step explanations that make it easy to follow, even for beginners. The inclusion of examples and visuals further enhances the learning process, allowing for quicker understanding. Overall, it feels intuitive and user-friendly, which helps streamline the setup process and saves time.
AppDynamics
AppDynamics' documentation is informative but not as well-organized, making it hard to find specific information, which can be frustrating. While the content is helpful, it often needs more explanation to be fully clear. The navigation between topics isn’t smooth, so locating the right sections takes more time.
New Relic's documentation is well-structured and user-friendly, making it easy for beginners to understand and follow.
Pricing Comparison
New Relic
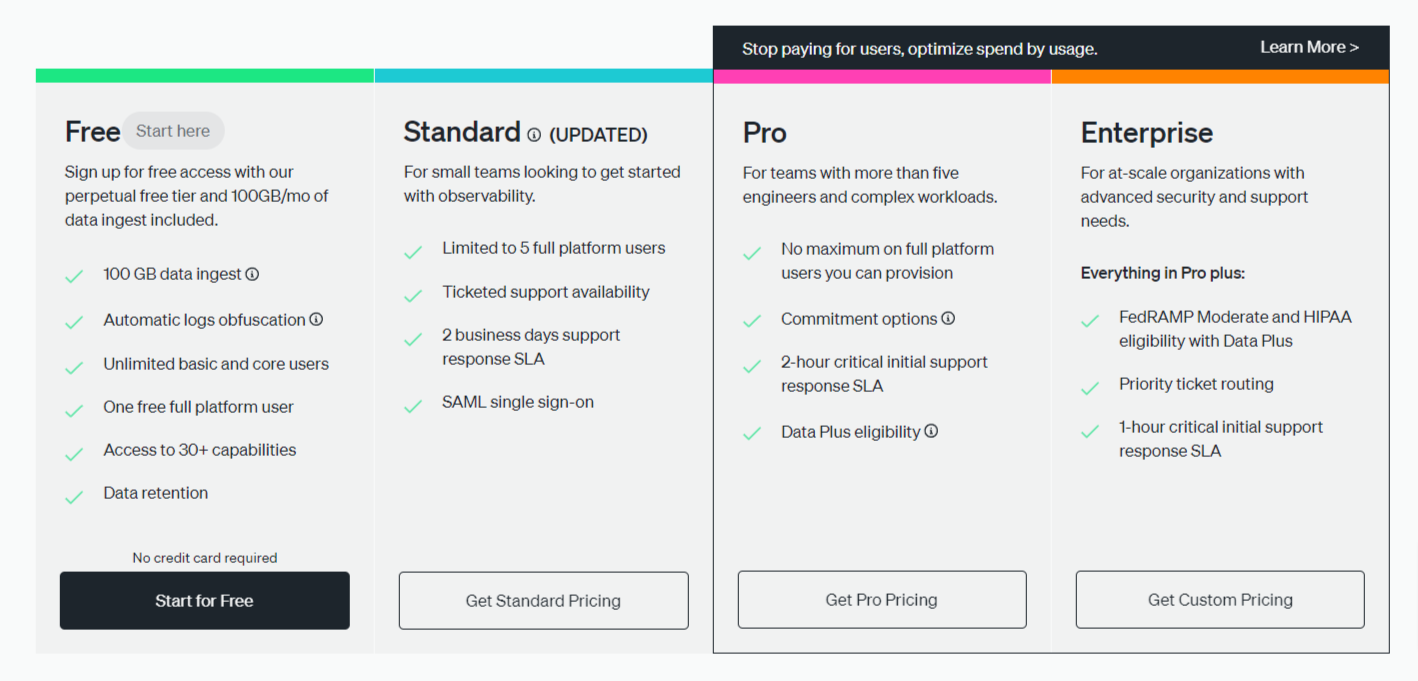
New Relic offers a free plan and several paid options based on how much you use. It gives you 100GB of free data each month, and if you go over that, it costs either $0.30 or $0.50 per GB, depending on your plan. There are four pricing levels, including a plan that's free forever.
AppDynamics
AppDynamics uses a subscription based pricing model, where businesses pay a set fee every month or year to access the platform's features, no matter how much they use. This makes budgeting easier but can lead to unused resources and extra costs.
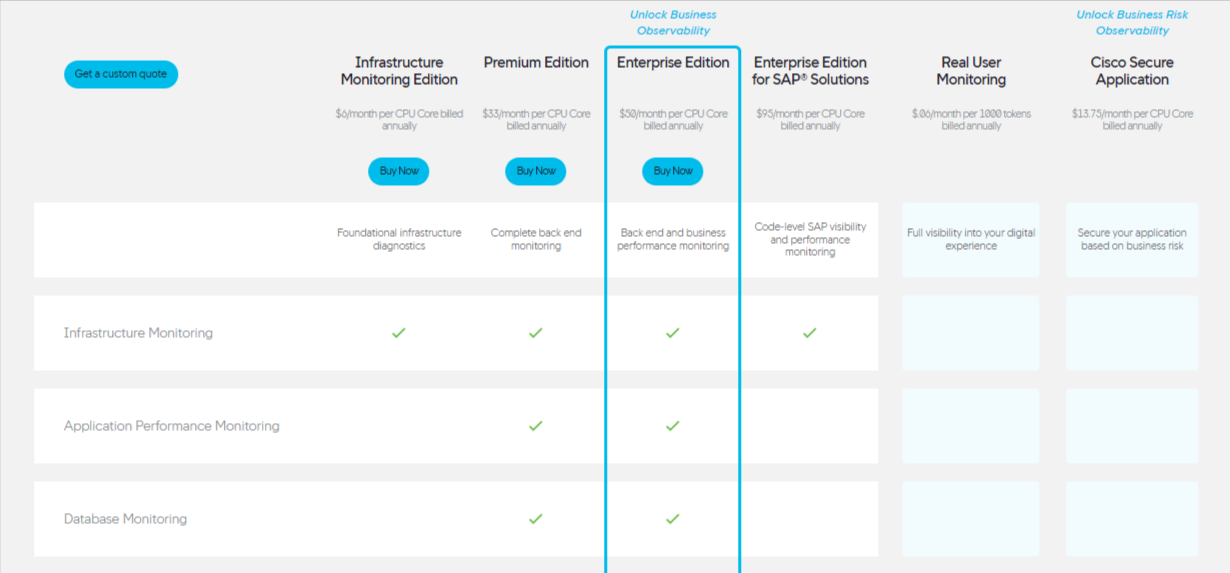
For a more budget-friendly option, go with New Relic.
Final Verdict: New Relic vs AppDynamics
- New Relic is ideal for small to mid-sized businesses, while AppDynamics is best for large enterprises.
- New Relic offers a simpler, more intuitive interface, whereas AppDynamics has a steeper learning curve but provides more depth.
- AppDynamics offers more advanced monitoring features, while New Relic provides essential tools sufficient for businesses.
- AppDynamics allows for greater customization, whereas New Relic is easier to set up and use out of the box.
- New Relic generally has a lower starting price, though AppDynamics may require a higher investment but can deliver more value for larger teams.
- AppDynamics scales better for large applications, while New Relic is suitable for businesses that are growing.
Atatus: A Better New Relic and AppDynamics Alternative
New Relic and AppDynamics have their drawbacks even as a powerful monitoring and observability tools, often due to their complexity and steep learning curves.
In such cases, you may need an alternative that offers a simpler, more user-friendly interface for effective Application Performance Monitoring (APM) and observability.
Atatus stands out as a better alternative to New Relic and AppDynamics, offering a full-stack Application Performance Monitoring (APM) and observability solution. It is known for its simple, user-friendly interface, unlike the more complicated setups of New Relic and AppDynamics.
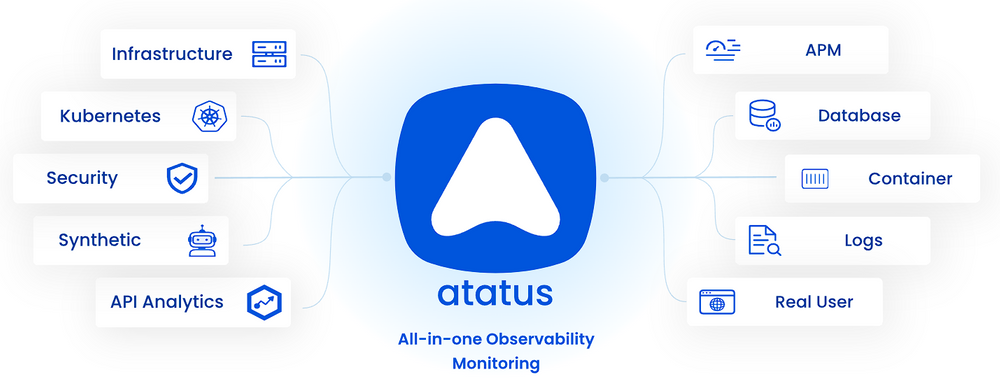
Atatus, being a native OpenTelemetry tool, integrates metrics, logs, and traces giving you a complete view of your systems. Its built-in distributed tracing feature provides end-to-end visibility of services, ensuring a unified and thorough approach to observability that goes beyond what tools like New Relic and AppDynamics offer.
Atatus is also valued for its affordability and clear pricing. With Atatus, there are no hidden costs. What you see is what you pay, making it a budget-friendly option compared to New Relic and AppDynamics.
Curious to see how Atatus can improve your monitoring? Sign up today and discover how easy and affordable observability can be!
#1 Solution for Logs, Traces & Metrics
APM
Kubernetes
Logs
Synthetics
RUM
Serverless
Security
More



![New Relic vs Splunk - In-depth Comparison [2025]](/blog/content/images/size/w960/2024/10/Datadog-vs-sentry--19-.png)
![New Relic vs Sentry - Which Monitoring Tool to Choose? [2025]](/blog/content/images/size/w960/2024/10/VS--1-.png)