Dynatrace vs New Relic - Which Tool To Choose?
Dynatrace and New Relic are popular monitoring and observability tools for monitoring your applications and infrastructure. In this post I have compared both Dynatrace and New Relic based on important features like application performance monitoring, log management, and infrastructure monitoring.
Even though both tools offer a lot of similar features, they have some key differences. We’ll explore these differences to help you choose the tool that best fits your needs.
Table of Contents
- Dynatrace vs New Relic: Overview
- Dynatrace vs New Relic: Exploring their range of products
- Initial Setup
- Infrastructure Monitoring
- Application Performance Monitoring
- Logs Monitoring
- Data Query
- Pricing
- UI/UX and Documentation
- Dynatrace vs New Relic: The Final Verdict
- Atatus: Your Affordable Alternative to Dynatrace and New Relic
Dynatrace vs New Relic: Overview
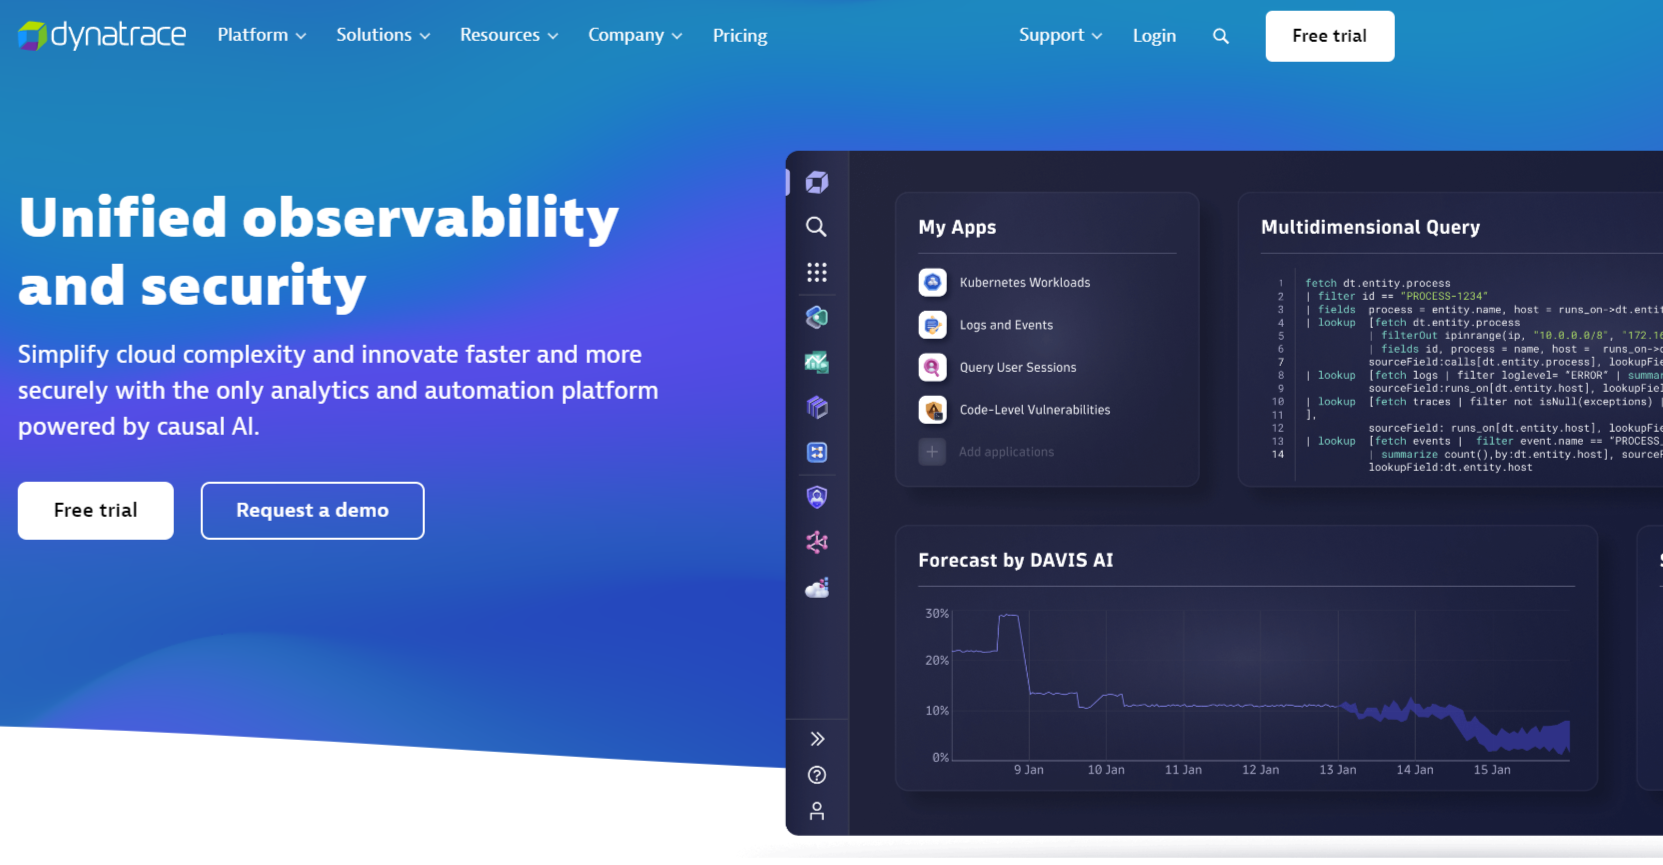
Dynatrace is an all-in-one platform designed to handle a wide range of use cases. It offers unified observability and security, allowing you to monitor and secure your entire stack on one AI-powered data platform. It helps organizations monitor, optimize, and manage their applications, infrastructure, and digital experiences. It provides real-time insights into the performance of complex systems, including cloud-native applications, microservices, and hybrid setups.
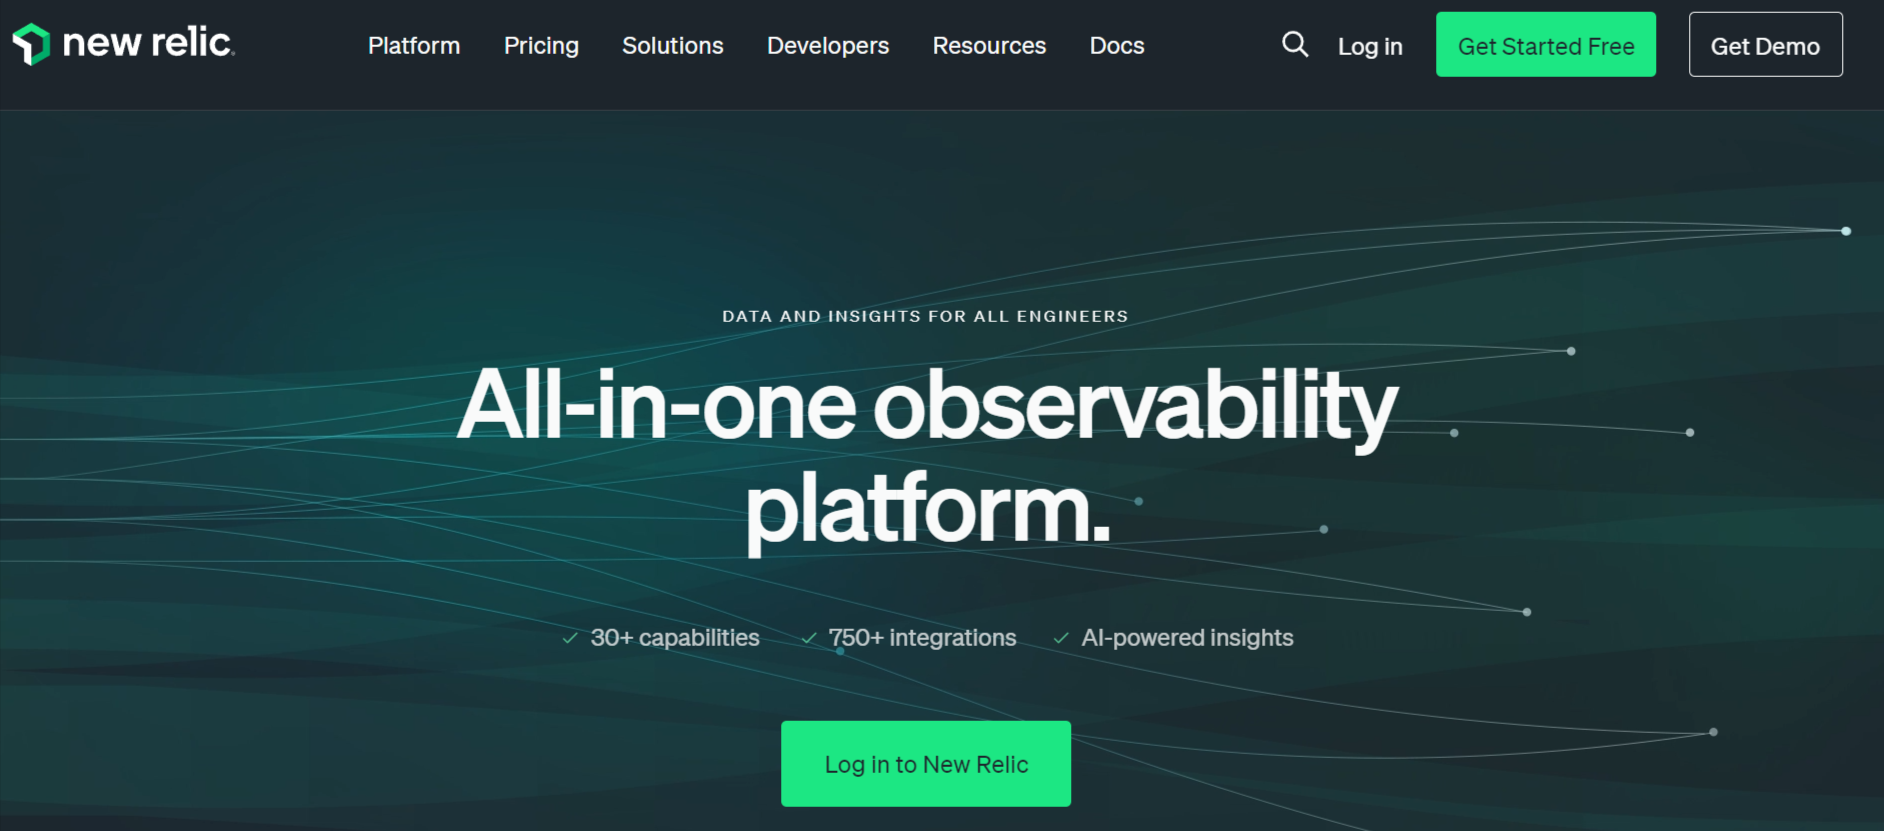
New Relic is a cloud-based observability platform designed for engineers to monitor and optimize their systems. It features over 30 capabilities and supports more than 750 integrations. The platform leverages AI-powered insights to help users debug issues and improve performance. As an all-in-one solution, New Relic provides a comprehensive view of your entire system. It simplifies observability and enhances system reliability and efficiency.
Dynatrace vs New Relic: Exploring their range of products
Here’s a brief overview of the overall key features of the Dynatrace and New Relic platforms:
| Features | Dynatrace | New Relic |
|---|---|---|
| Infrastructure Monitoring | ✅(Excellent) | ✅(Good) |
| Application Performance Monitoring (APM) | ✅(Limited) | ✅(Excellent) |
| Real User Monitoring | ✅ | ✅ |
| Logs Monitoring | ✅ | ✅ |
| Kubernetes Monitoring | ✅ | ✅ |
| OpenTelemetry Support | ✅ | ✅ |
| Cloud SIEM | ✅(Limited) | ❌ |
| Documentation | ✅ | ✅(Excellent) |
| UI/UX | ✅(Good) | ✅(Excellent) |
| Pricing | Higher | Comparatively Lower |
| Free Tier | ❌ | ✅(100GB free data per month) |
| Budget-friendly for Startups | ❌ | ❌ |
Initial Setup
Dynatrace
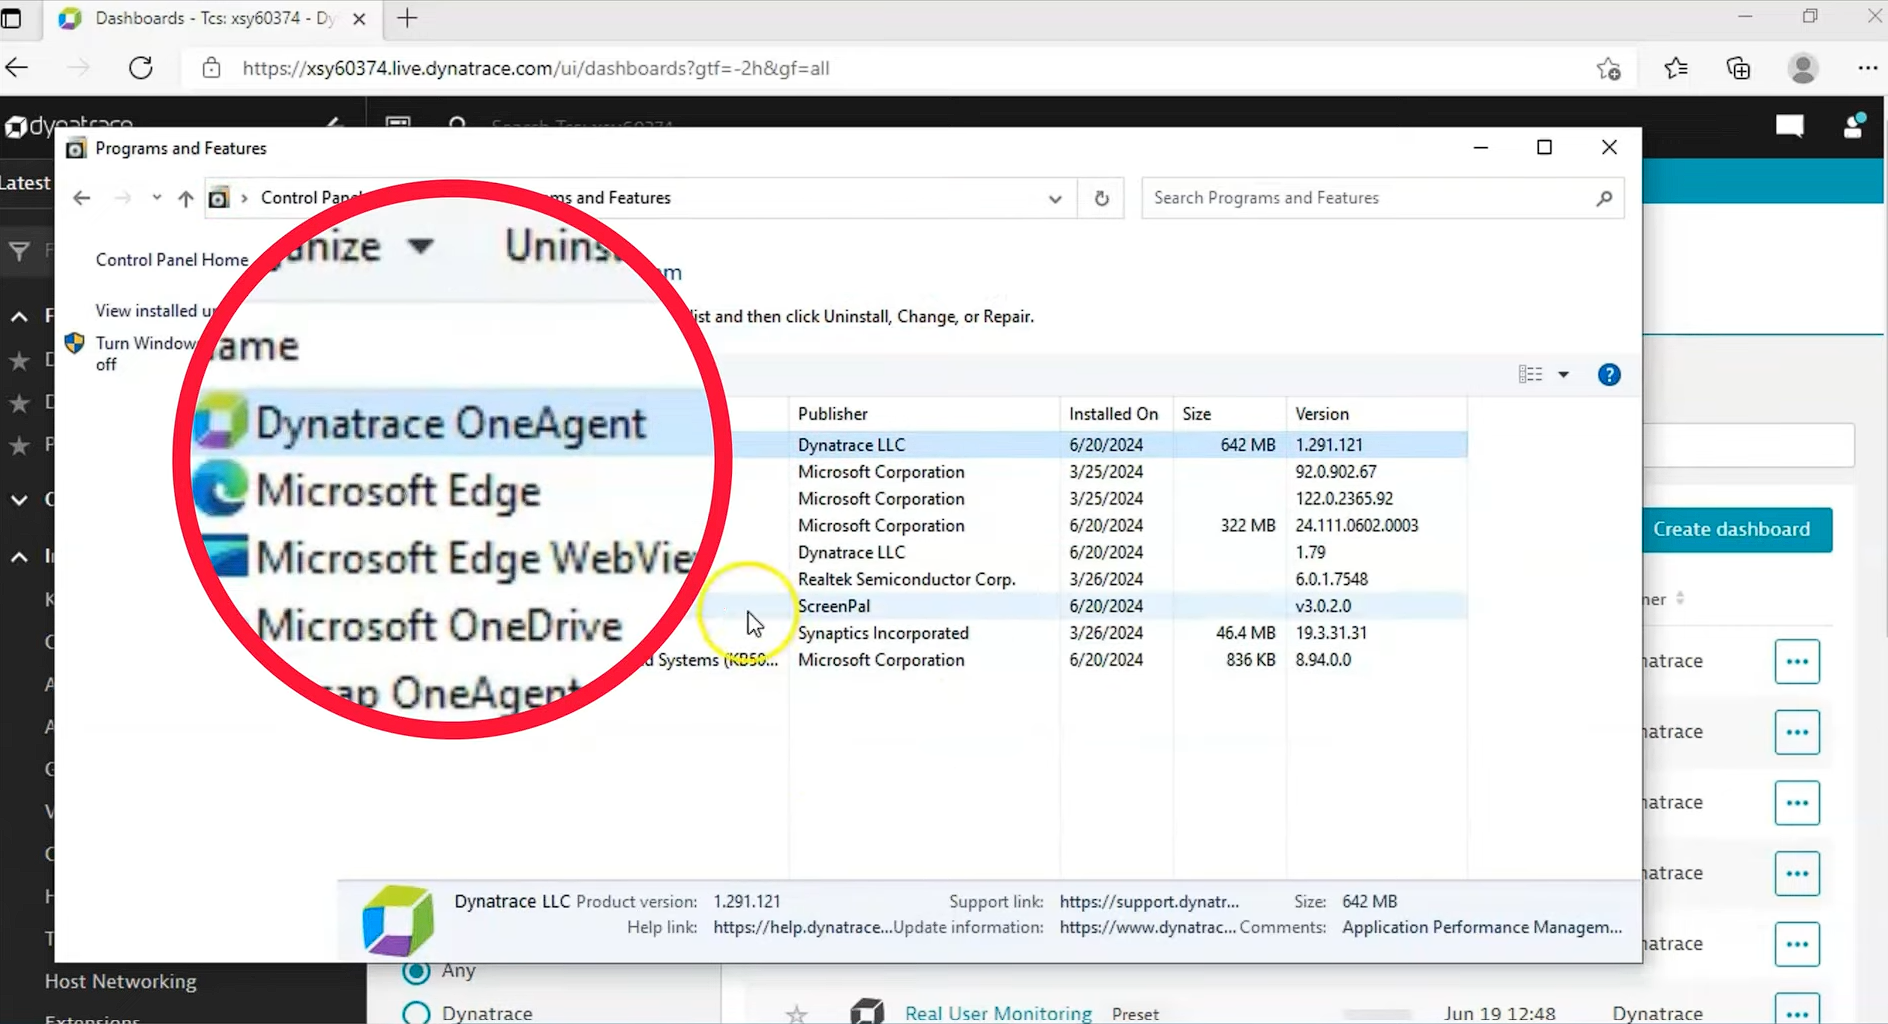
Setting up Dynatrace was quite easy. The initial process was well-supported with good instructions. I just had to run three code snippets to get the agent installed. Configuring everything through a user-friendly web interface made setting up log monitoring and application performance monitoring (APM) simple. Once the OneAgent was installed, it automatically started tracking logs, infrastructure metrics, and identified the technologies used on my host.
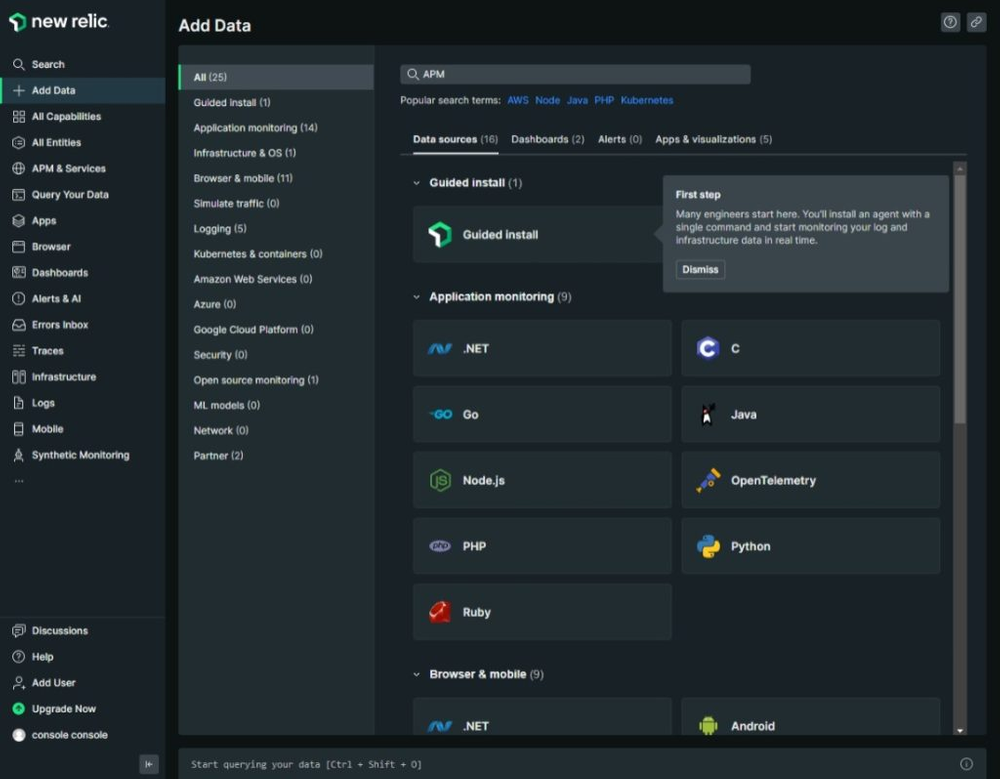
New Relic
New Relic provided a free account that let me explore all its features without any time restrictions. To get New Relic up and running on my host, I followed the guided APM installation process. This process included all the tools I needed, such as a code snippet for setting up an infrastructure agent with logging enabled. The automated script made the installation easy, and New Relic started tracking performance immediately.
Infrastructure Monitoring
Dynatrace
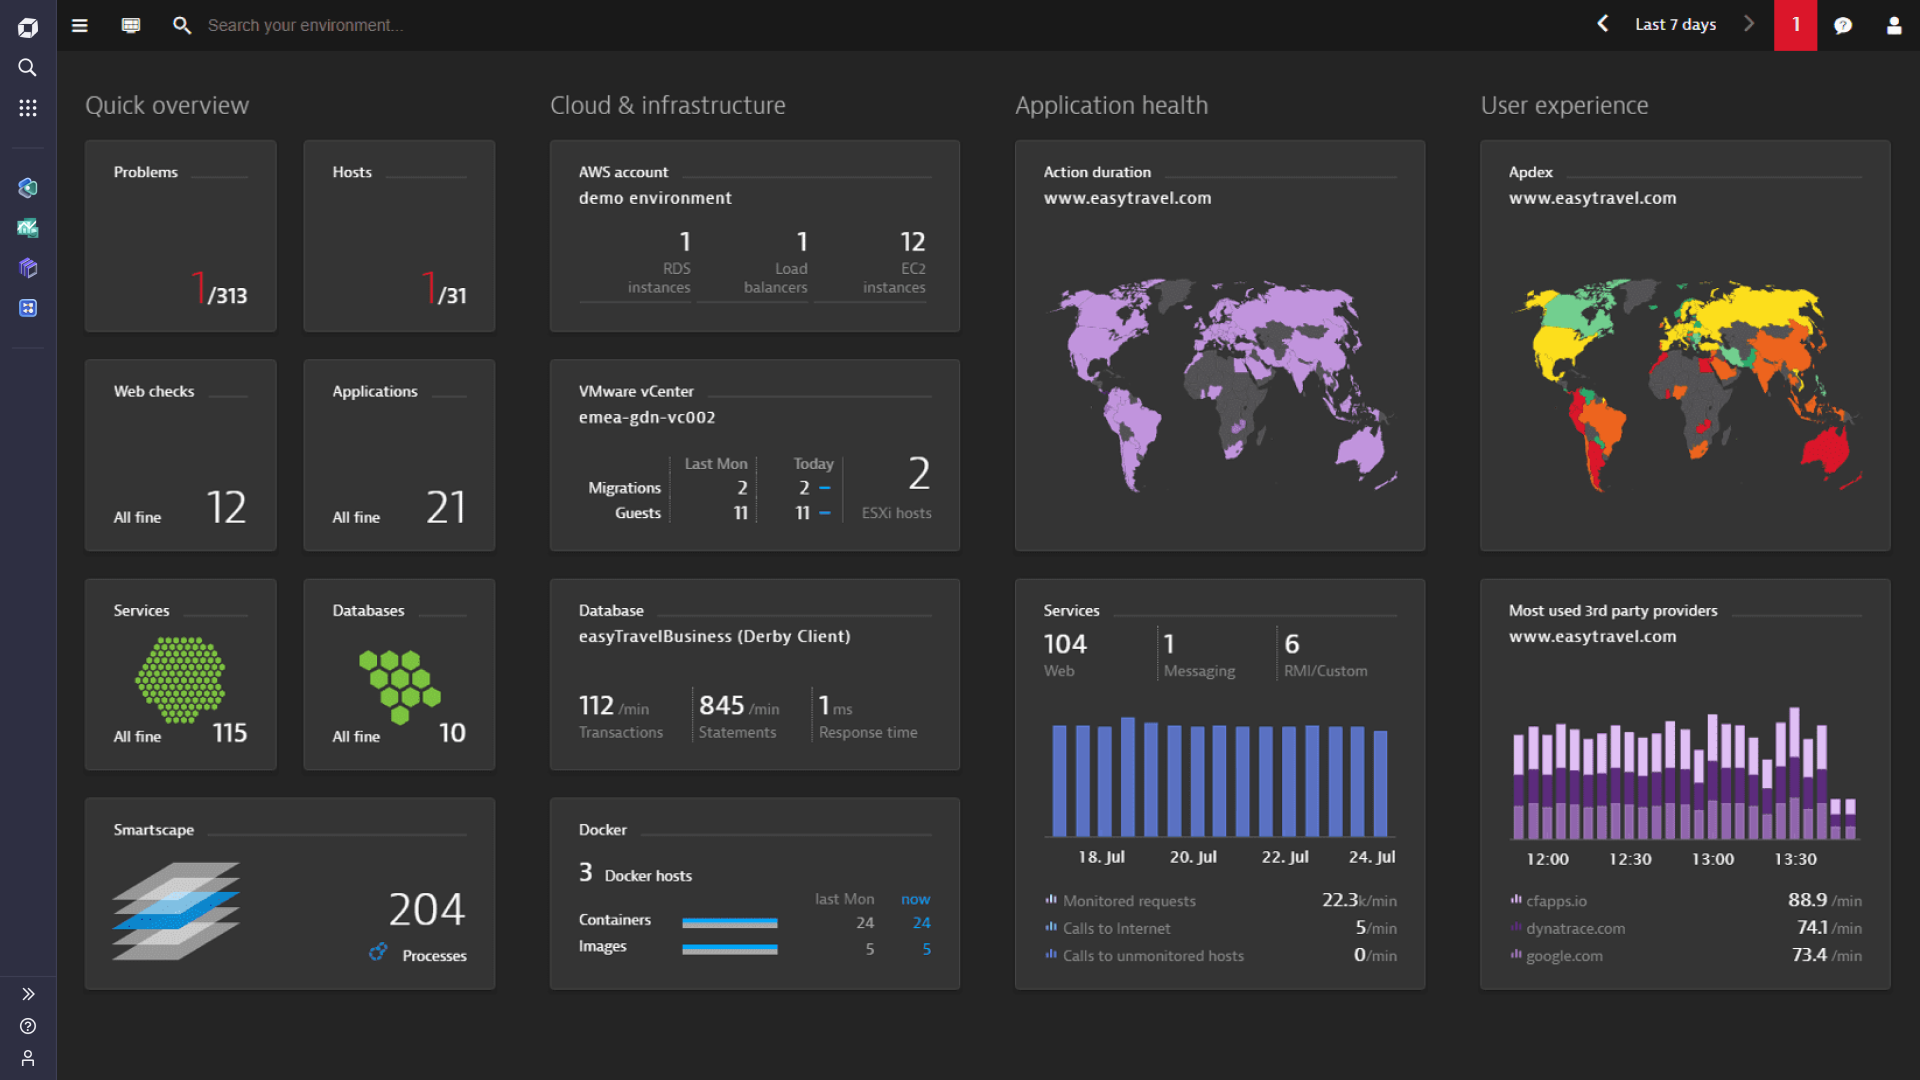
After installation, OneAgent begins collecting data automatically throughout your setup. It delivers a detailed overview of infrastructure performance, covering aspects such as incoming and outgoing connections, host performance, process analysis, disk usage, and more.
Dynatrace Infrastructure provides real-time visibility into your entire infrastructure's performance. Key features include automatic detection and monitoring of all components, detailed metrics on system health and resource usage, end-to-end visibility across applications and services, and alerting with AI-driven insights for proactive issue resolution.
New Relic
To get started with infrastructure monitoring, you'll first need to install an agent. The infrastructure agent can be installed on Linux, macOS, and Windows systems. Depending on your observability needs, you have various options for deploying the agent in your system. The documentation makes it easy to follow the steps, ensuring a smooth installation process.
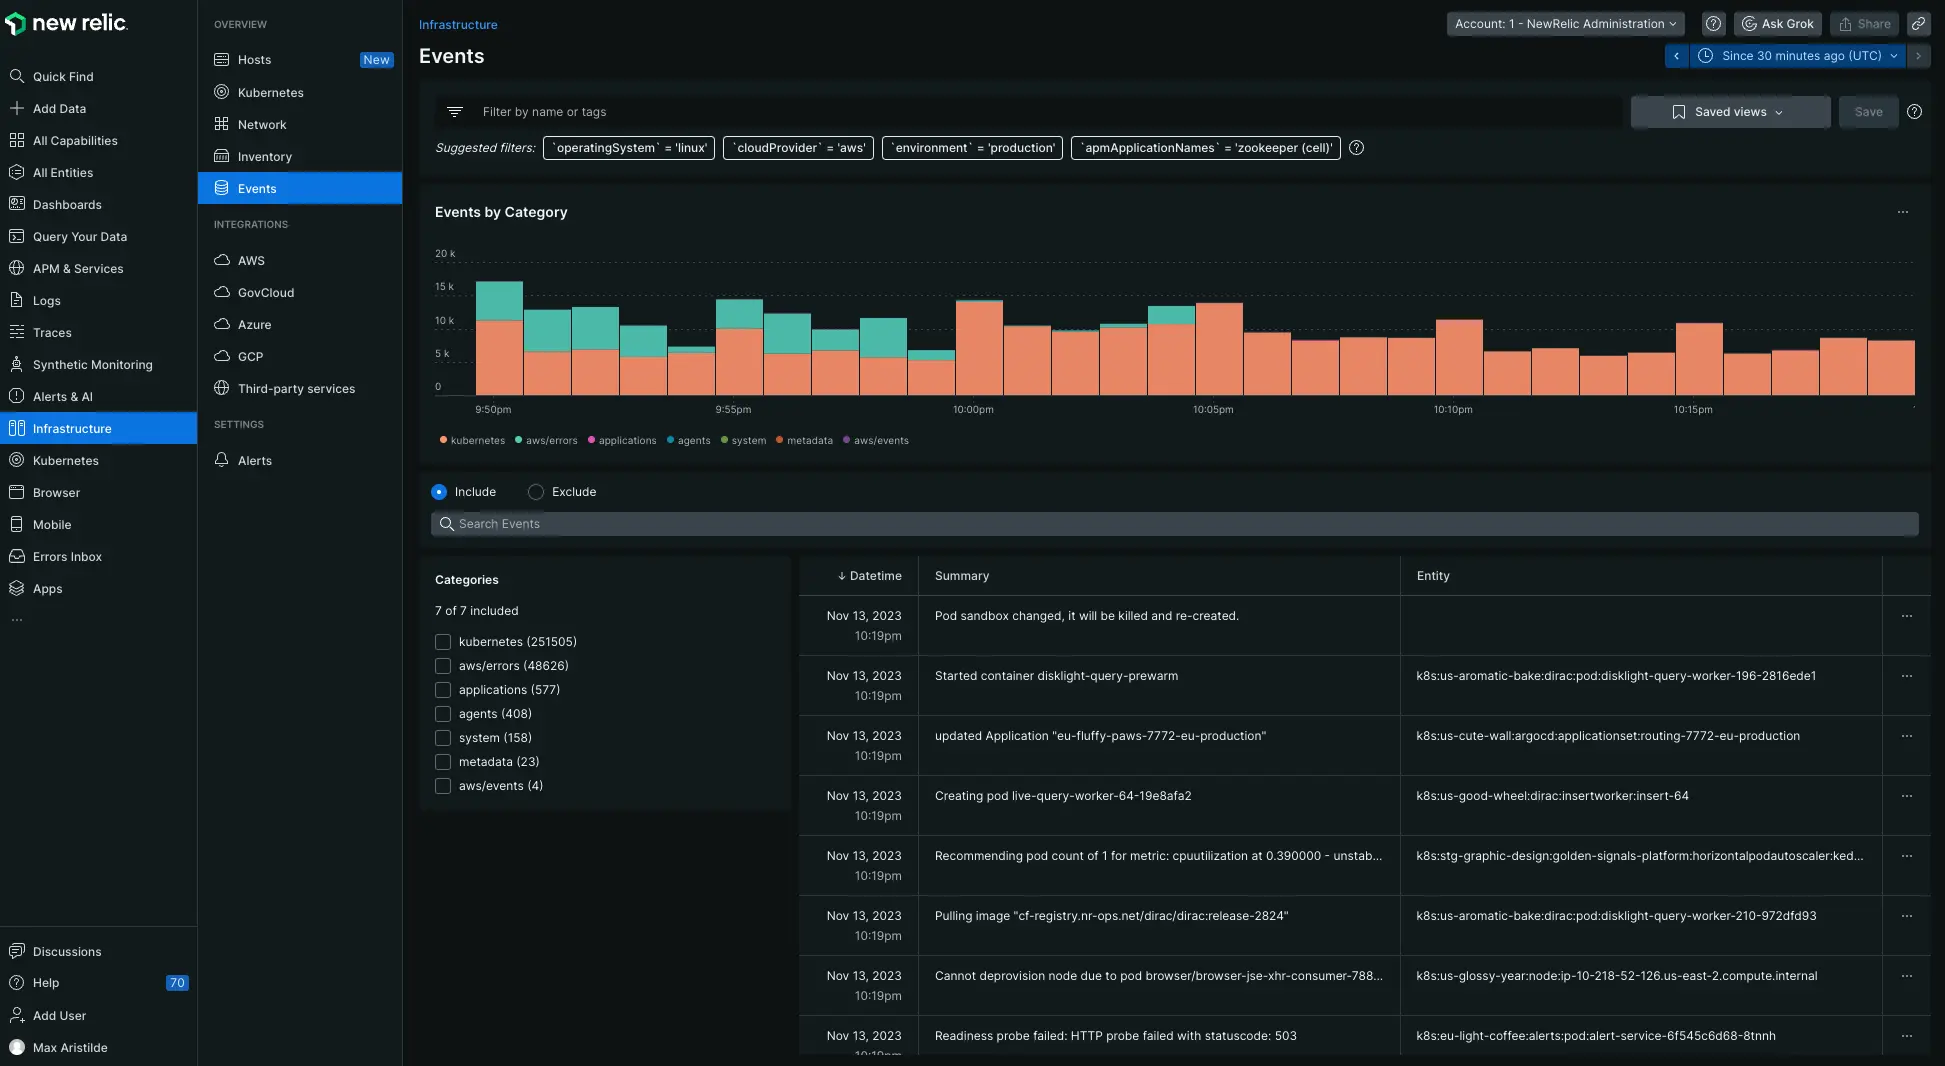
New Relic's Infrastructure monitoring offers comprehensive visibility into your system's performance. The Inventory page allows you to search for all infrastructure entities across all hosts.
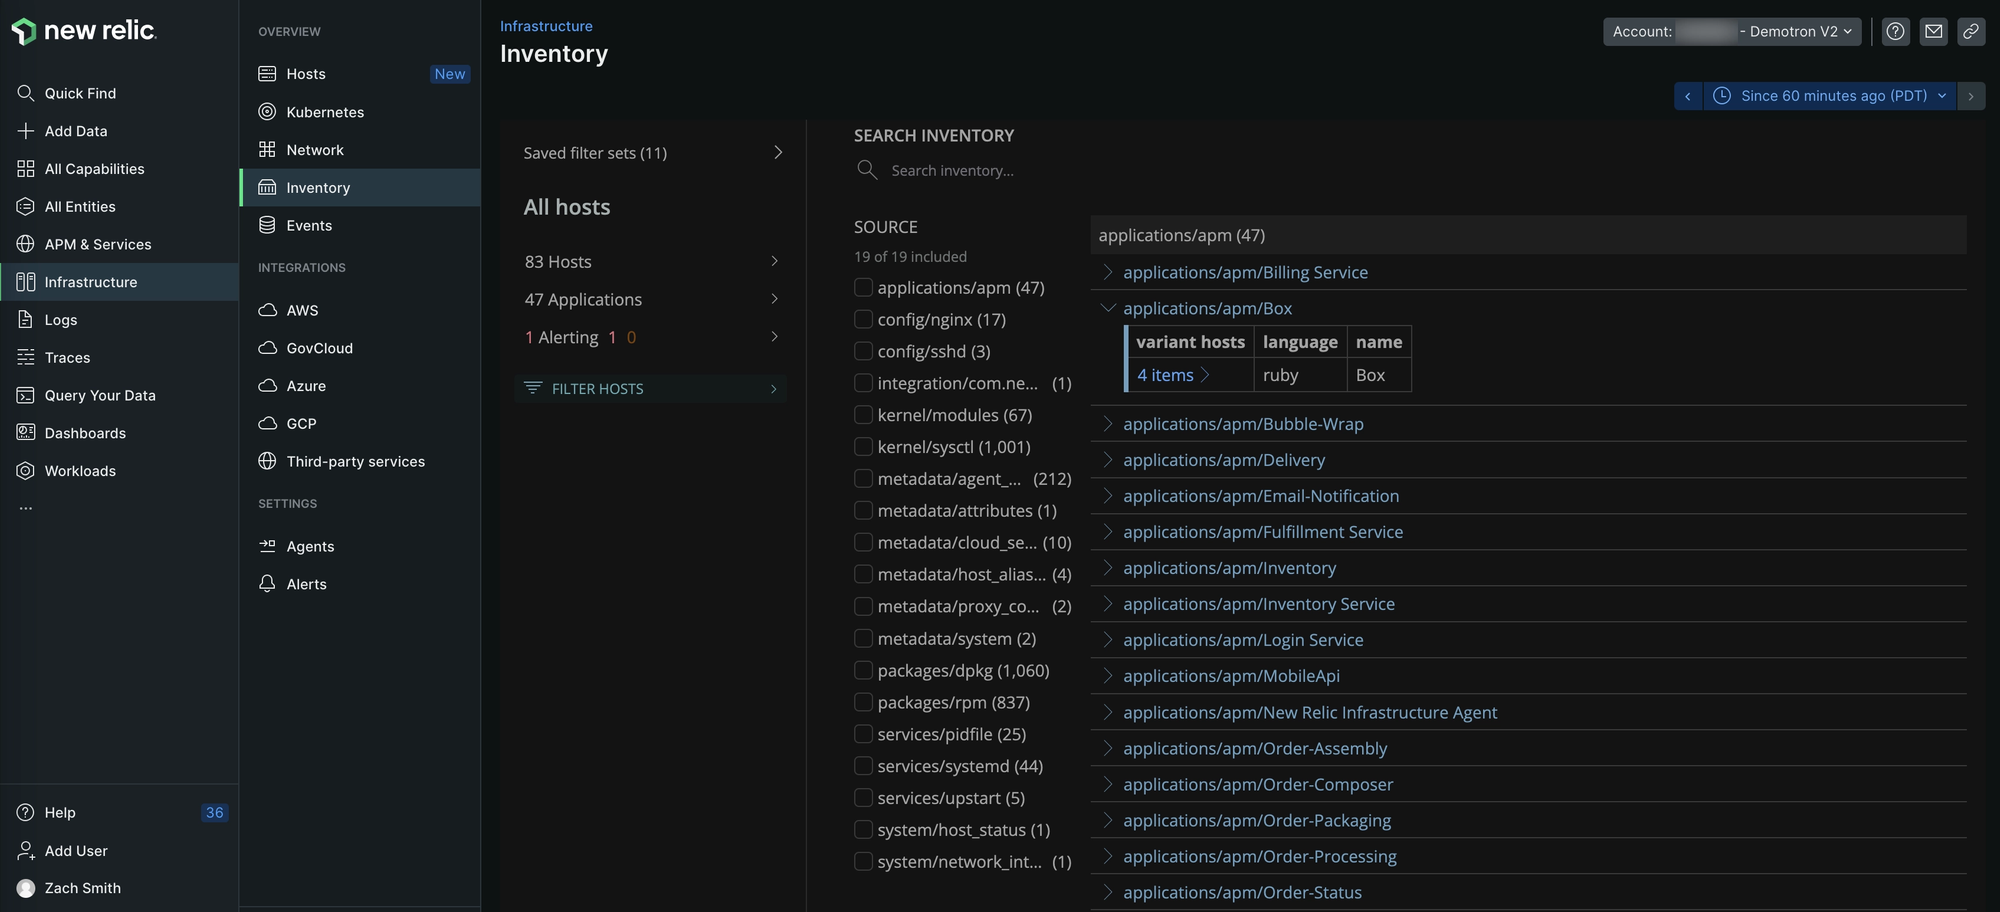
The Events page enables you to track configuration changes, restarts, SSH sessions, and more. Securely collected and displayed data ensures your monitoring stays up-to-date.

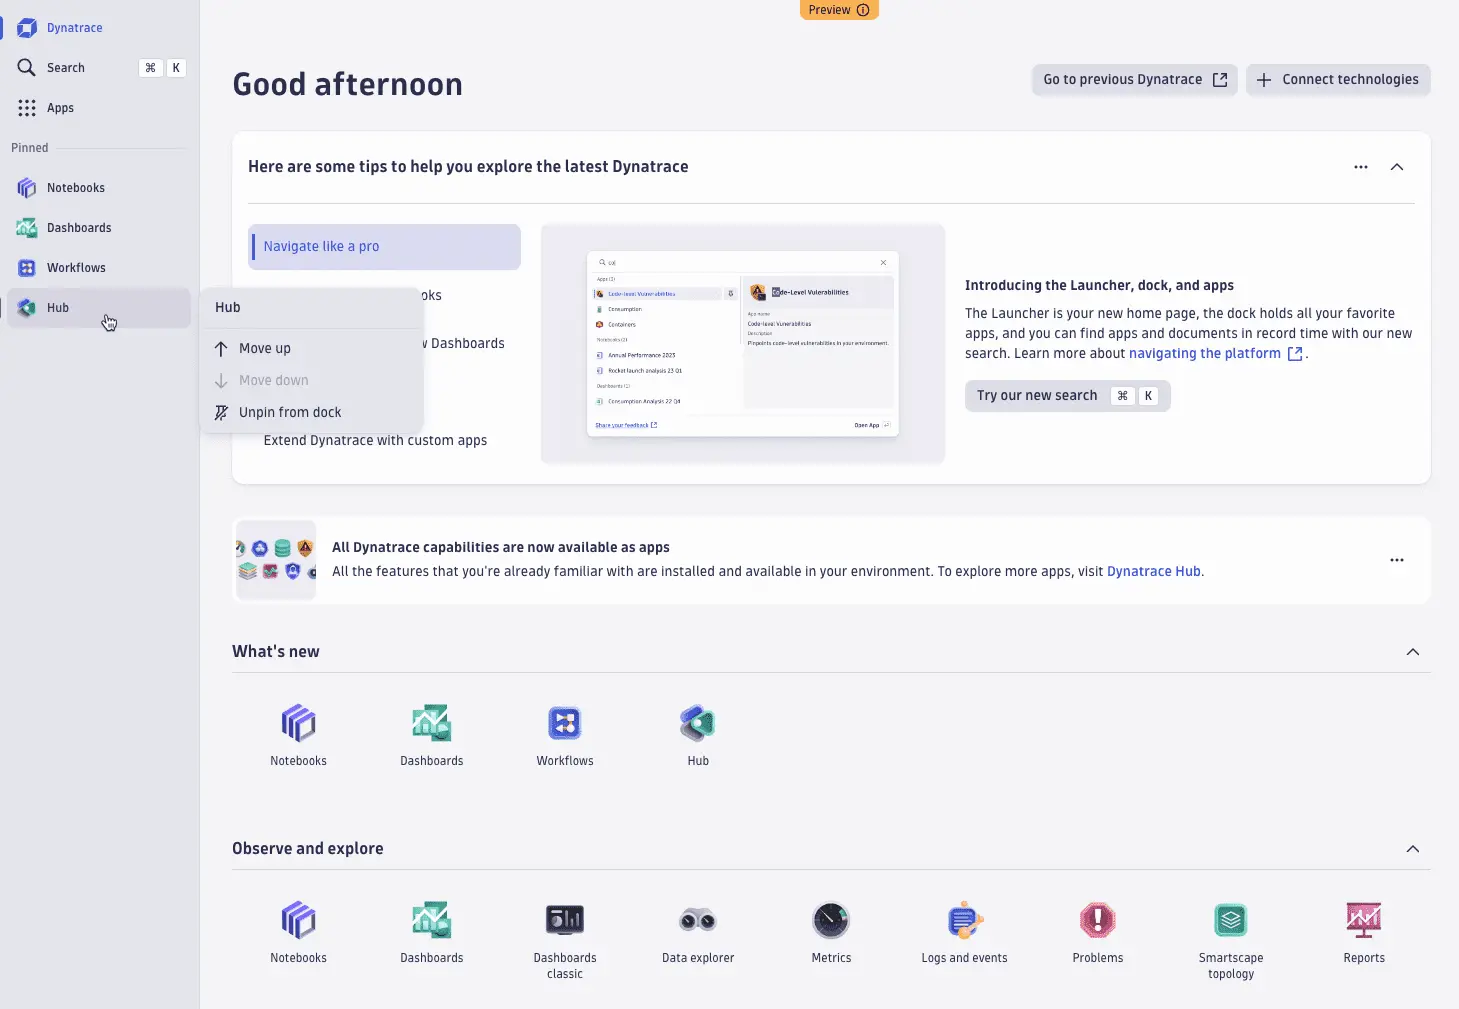
Dynatrace vs New Relic Infrastructure Monitoring: Dynatrace
Application Performance Monitoring
Dynatrace
Setting up Application Performance Monitoring (APM) in Dynatrace can be tricky, because the user interface isn't very intuitive. Dynatrace offers two instrumentation methods: OneAgent and OpenTelemetry. I managed it using the OneAgent SDK which works with the Dynatrace OneAgent.
The best thing about Dynatrace APM is its AI-driven automatic problem detection and resolution. This feature leverages artificial intelligence to continuously monitor and analyse application performance, automatically identifying anomalies and pinpointing the root causes of issues.
New Relic
New Relic features a user-friendly APM section, making it simple to monitor your application. After signing up and installing the appropriate agent for your app, New Relic automatically collects and displays your data in minutes. The whole process is smooth and straightforward.
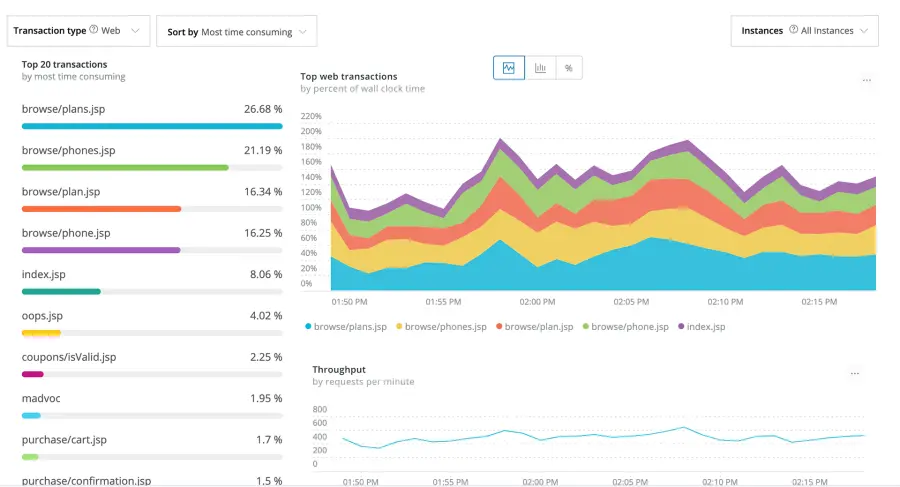
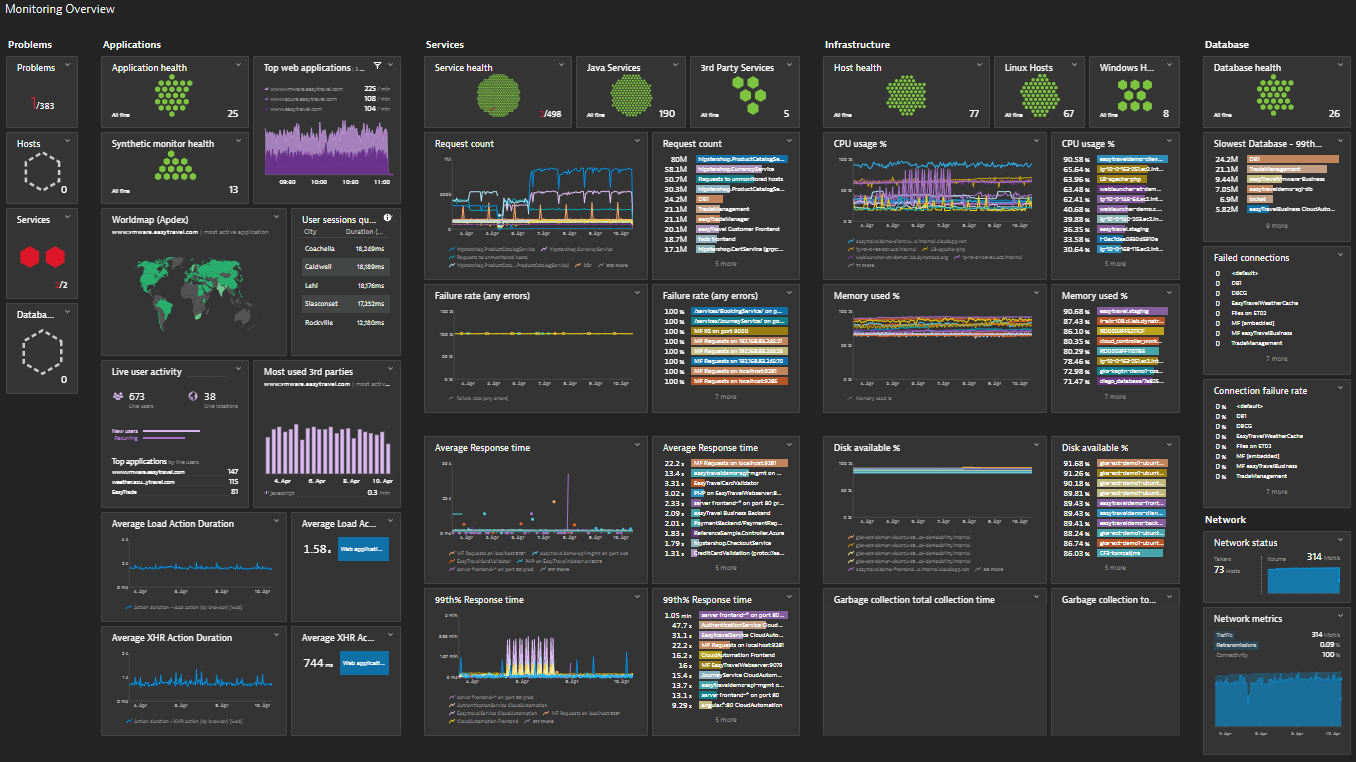
One of a standout feature of New Relic APM is its customizable dashboards. They allow you to easily create and view performance metrics. These metrics are customized to fit your specific needs.
Dynatrace vs New Relic APM: New Relic
Logs Monitoring
Dynatrace
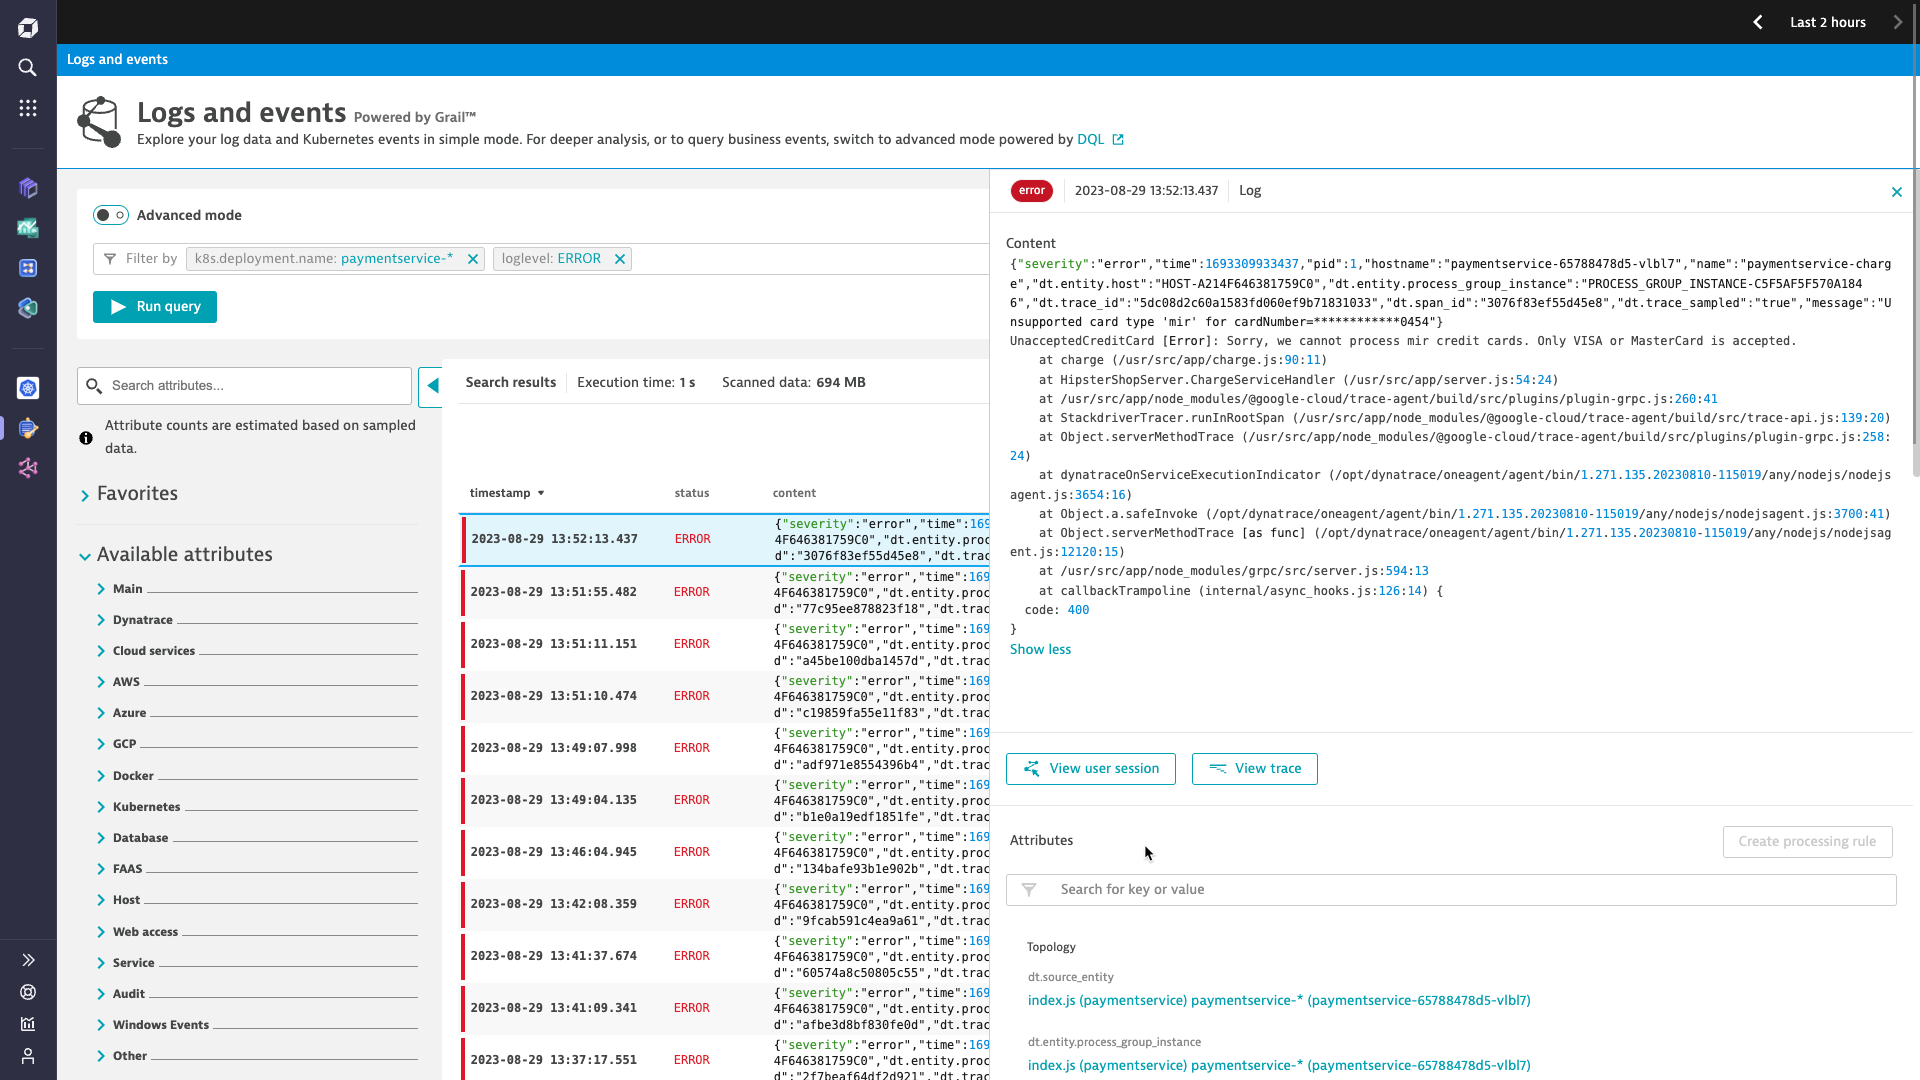
Once you deploy the OneAgent on your host machine, Dynatrace starts ingesting log data automatically. The process is seamless and requires no extra configuration. Within minutes, your logs are available for monitoring and analysis on the Dynatrace platform.
Dynatrace offers customizable dashboards for visualizing log data, allowing you to easily adjust them to your specific needs by pinning DQL queries and log metrics. Another useful feature is Grail's ability to store logs in different buckets, which improves query performance by narrowing the data scope and reducing execution time. By default, Grail includes built-in buckets that retain data for 35 days.
New Relic
Once New Relic is set up, it automatically collects logs from applications and displays them in the logs tab. It captures both infrastructure and application logs smoothly. No additional setup is required for this process. You can forward your log data to New Relic using APM agent, infrastructure agent, third-party log services, the Log API or TCP endpoint, or the OpenTelemetry SDK.
New Relic logs provide deeper visibility into application and infrastructure performance data, such as events, errors, and traces. This helps reduce MTTR and quickly troubleshoot production incidents. You can visualize everything in one place using the logs UI to spot important patterns. Additionally, you can examine more context around specific log lines for better insights.
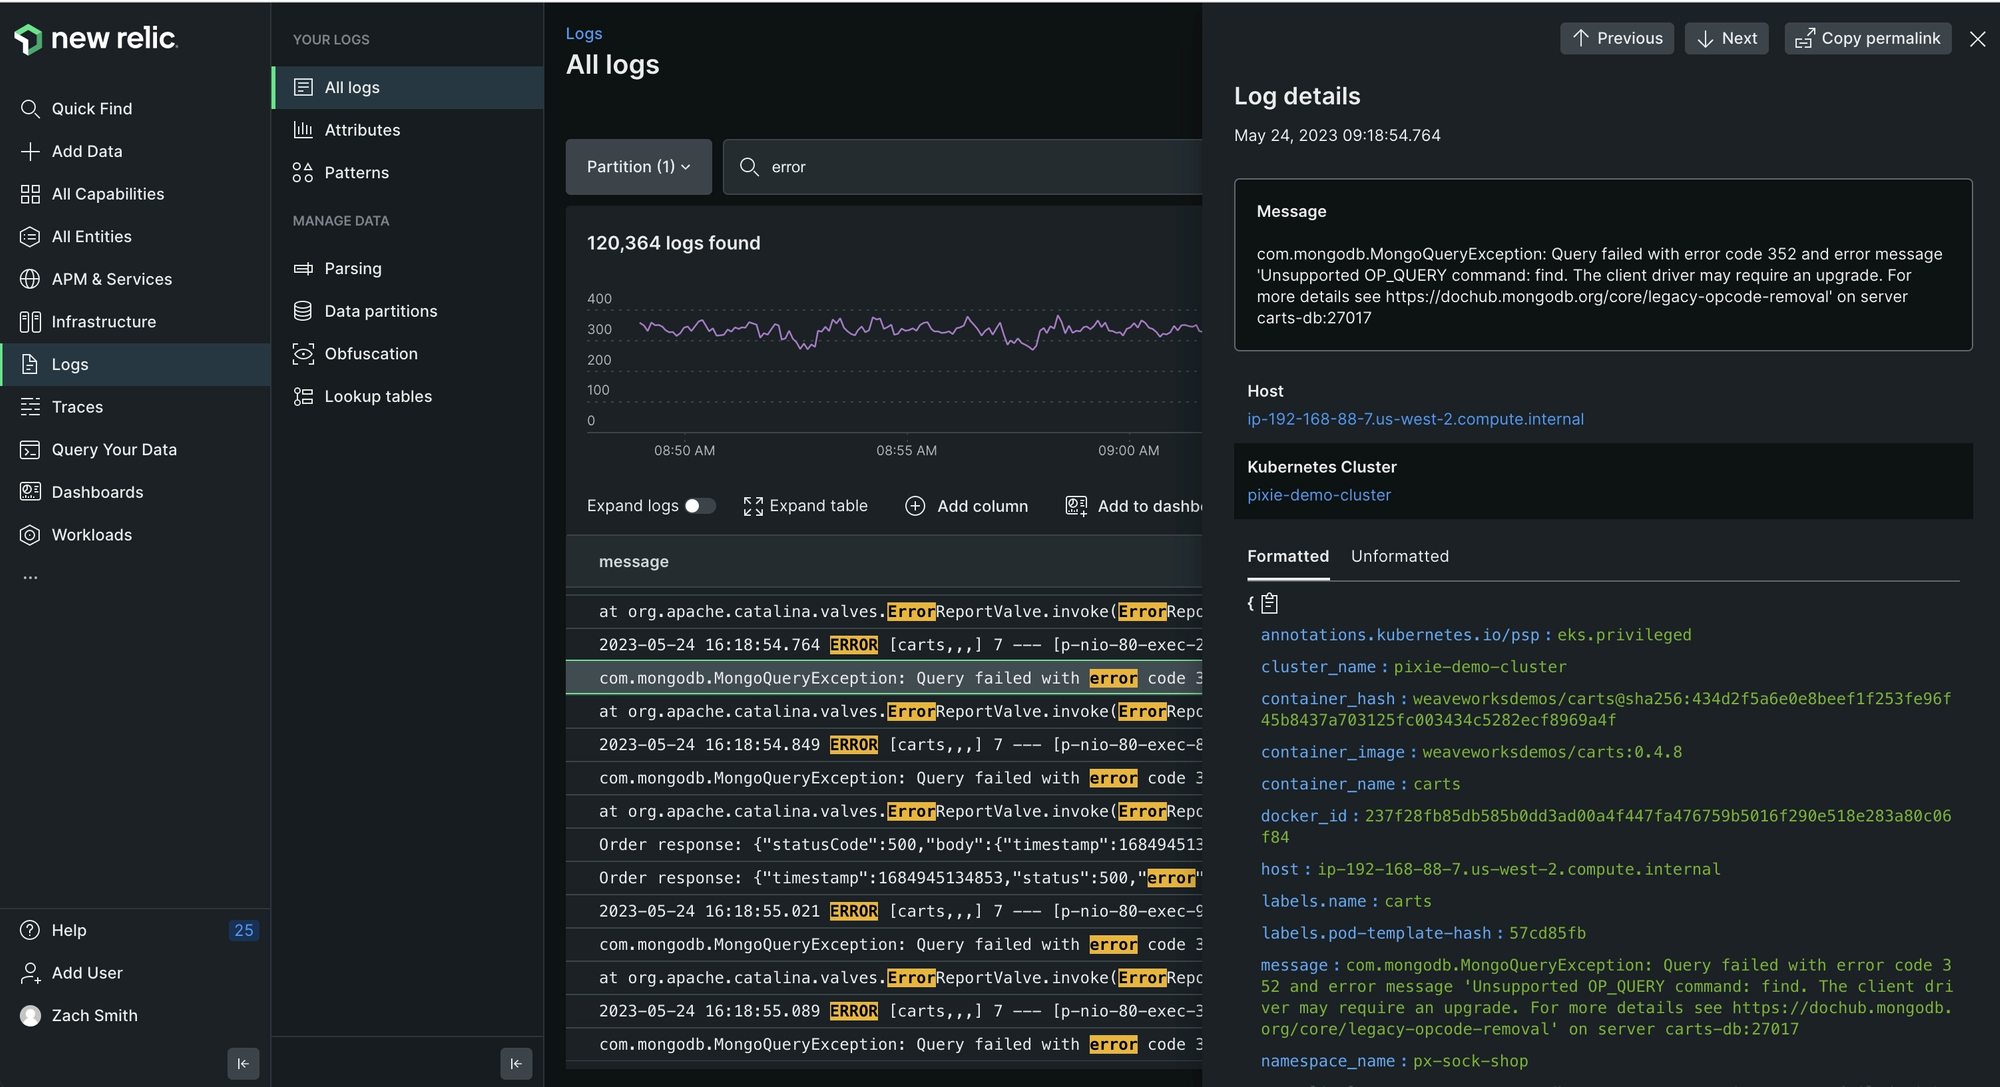
Dynatrace vs New Relic Logs Monitoring: Tie, Decide based on your need and cost
Data Query
Dynatrace
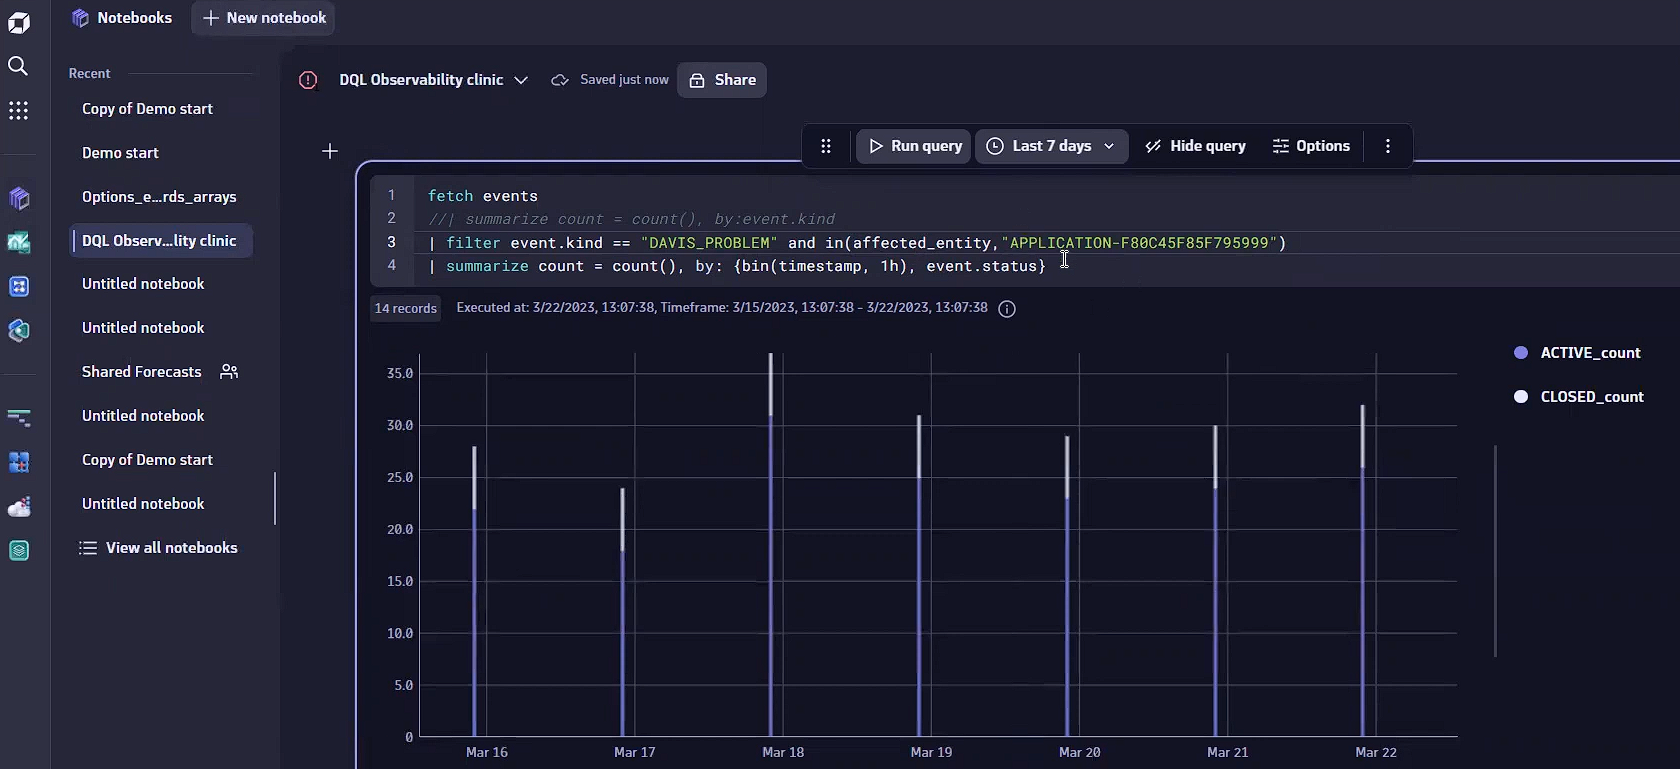
Dynatrace Query Language (DQL) lets you easily explore your data and find patterns, anomalies, and outliers. With DQL, you can create statistical models and more, using data stored in Dynatrace Grail storage. It’s designed for flexibility, handling diverse event data without needing a predefined schema, unlike traditional SQL databases.
New Relic
New Relic makes it easy to explore and visualize your data without needing to know any query languages. You can use the metrics and events data navigator to create visualizations and see your data clearly. For custom queries and charts, you can choose between NRQL mode and PromQL-style mode.
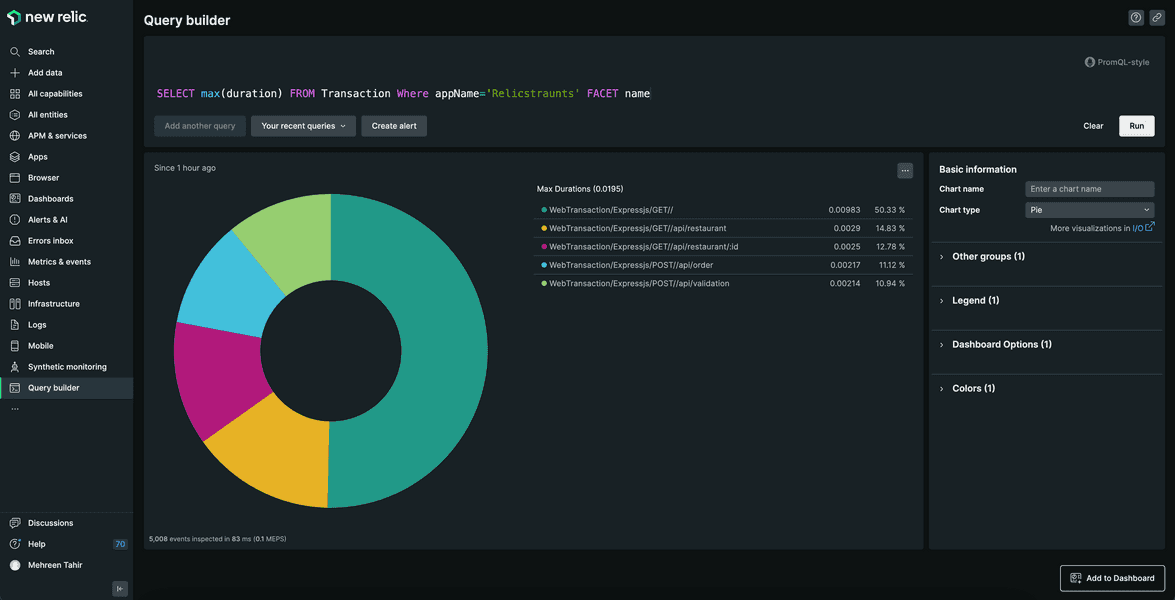
If you need more advanced features, NerdGraph API allows you to perform complex queries and access long-term data across accounts.
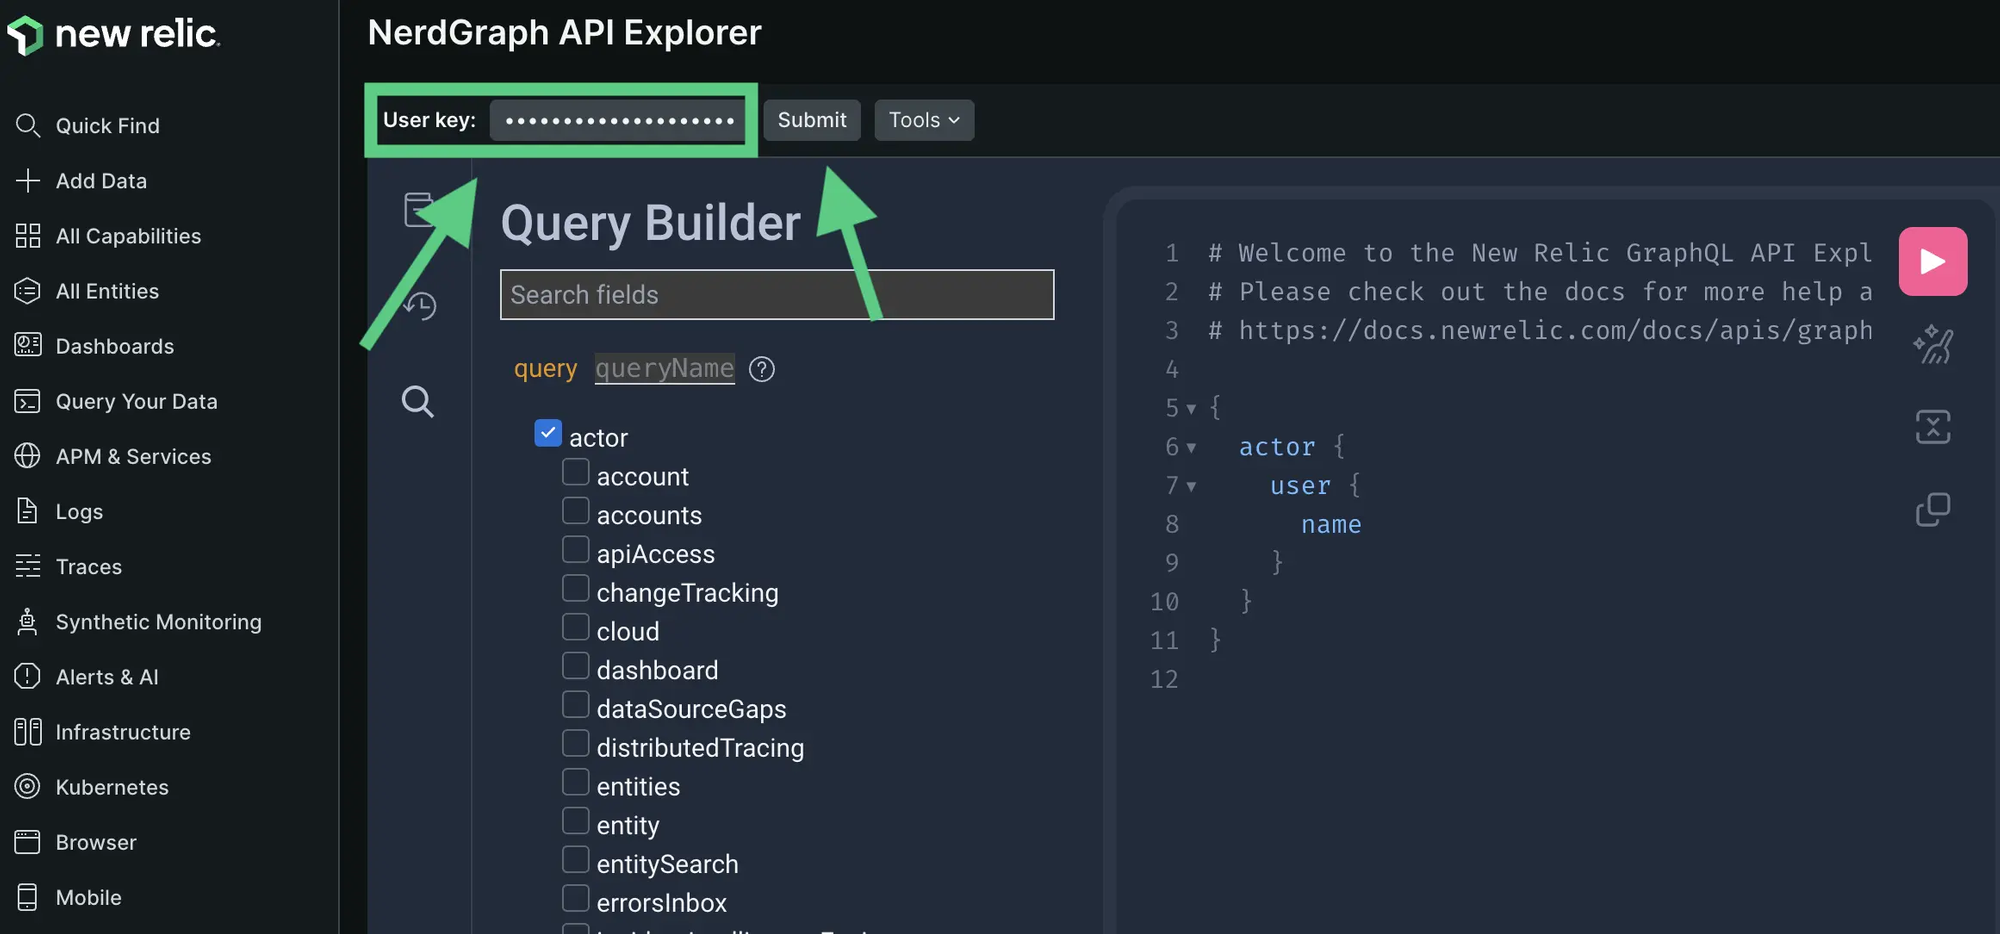
Dynatrace vs New Relic Data Query: Tie
Pricing
Dynatrace
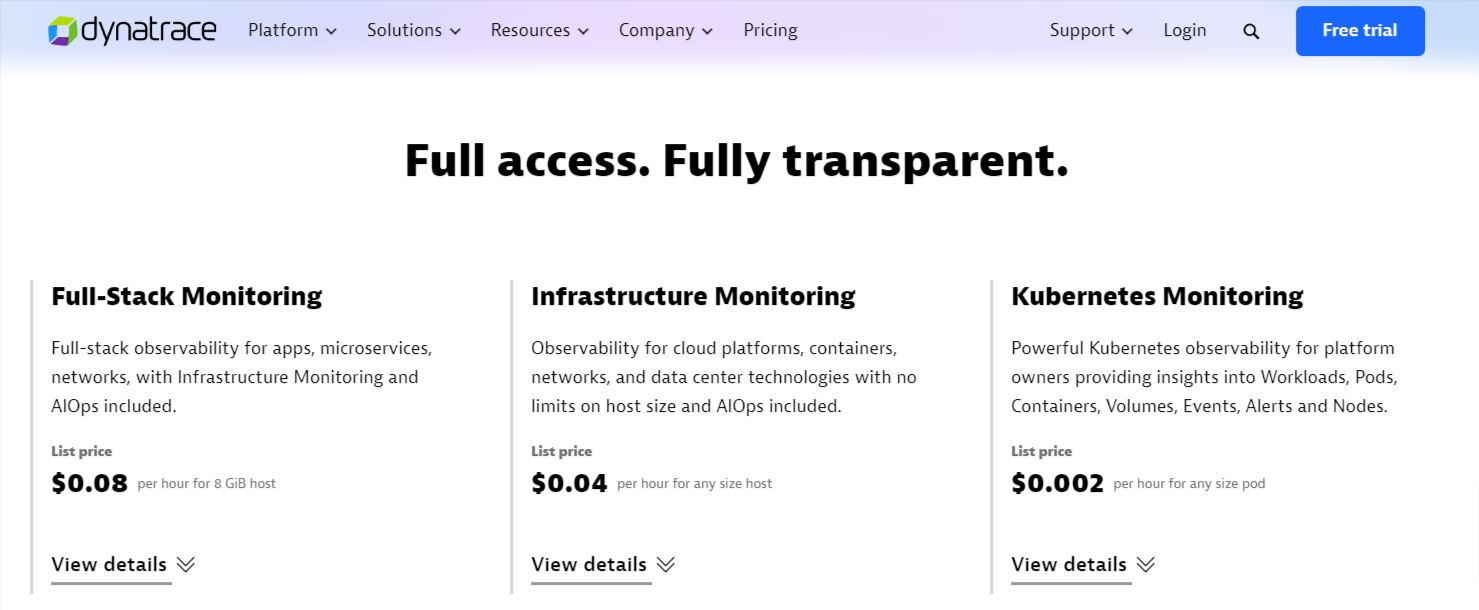
Dynatrace pricing varies depending on the specific services and features you use. Each service, like application monitoring or infrastructure monitoring, has its own pricing structure. This means that the cost you incur will depend on which services you choose and how extensively you use them.
New Relic
New Relic offers usage-based pricing with 100GB of free data ingestion each month. After exceeding 100GB, you’ll be charged $0.30 per GB or $0.50 per GB, depending on your plan.
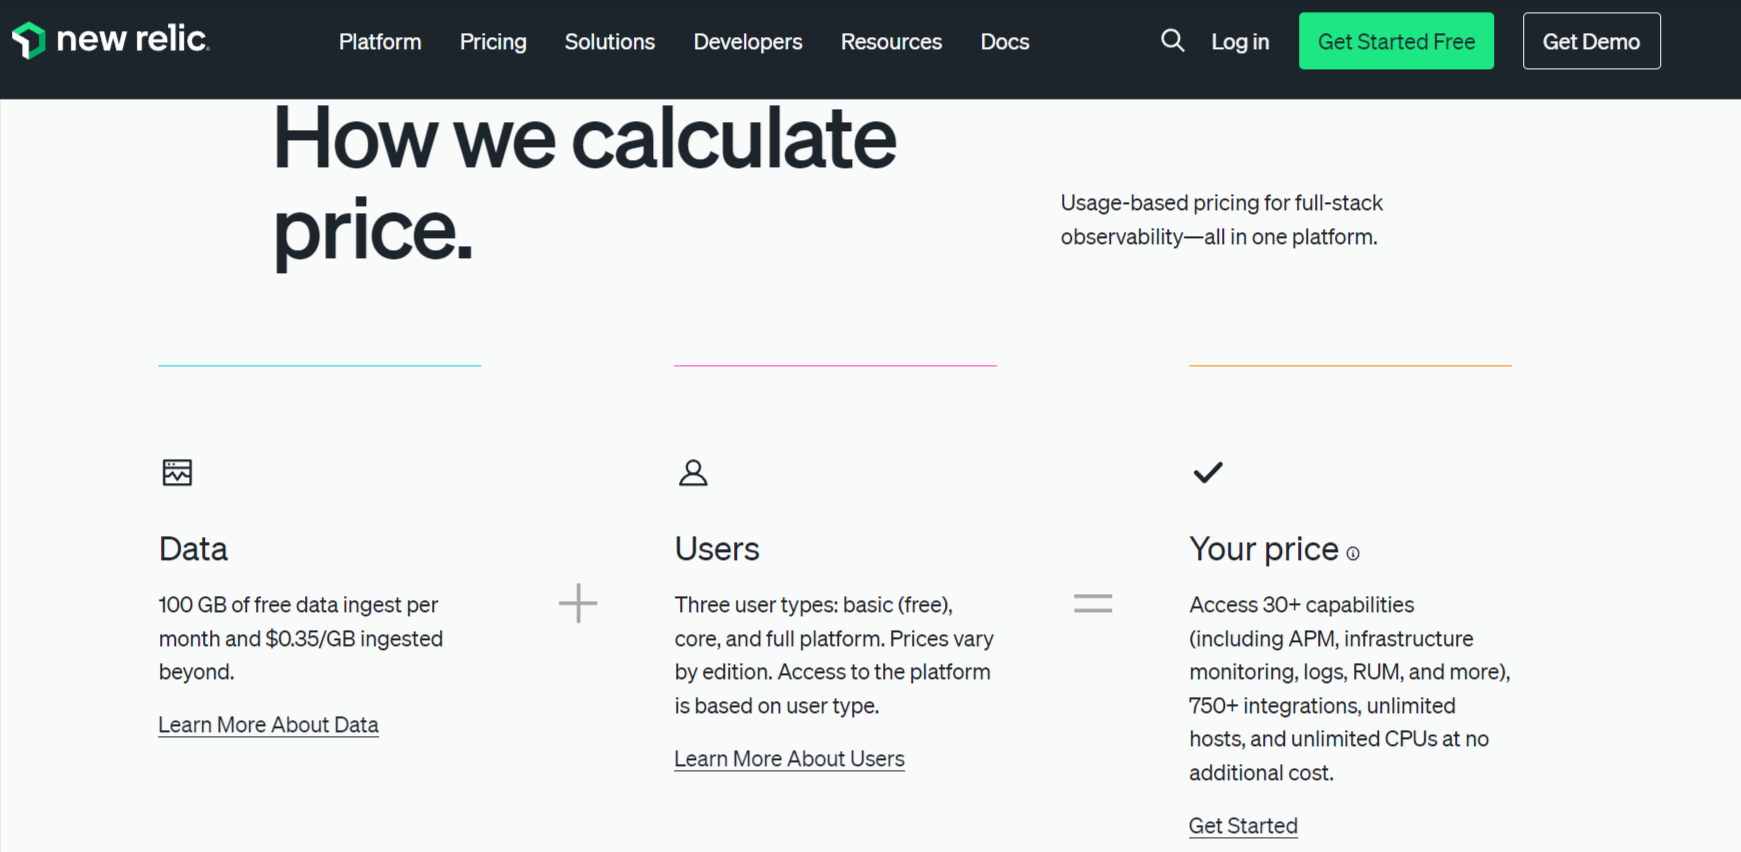
Dynatrace vs New Relic Pricing: New Relic
UI/UX and Documentation
Dynatrace's user interface can be challenging and less intuitive, requiring frequent reference to documentation. Navigating the platform isn't always straightforward, affecting the overall user experience.
New Relic offers an intuitive and easy-to-navigate interface, with ready-made dashboards and alert configurations that simplify usage. Its design enhances the overall user experience.
From a user perspective, I found New Relic's documentation well-structured and easy to follow with step-by-step explanations. In contrast, Dynatrace's documentation was less clear, often requiring me to jump between sections to find detailed information.
Dynatrace vs New Relic UI/UX: New Relic
Dynatrace vs New Relic: The Final Verdict
Datadog and Dynatrace are both effective choices for monitoring. After using both monitoring tools, I found it hard to choose a definitive winner. New Relic was more user-friendly, while Dynatrace provided deeper insights into my application.
From a user perspective, I prefer New Relic for its generous free tier, detailed documentation, and strong support. For larger-scale infrastructure monitoring, Dynatrace might be a better investment. However, it's important to note that Dynatrace can be complex, with a steep learning curve and a less intuitive UI, requiring extensive documentation to perform even simple tasks.
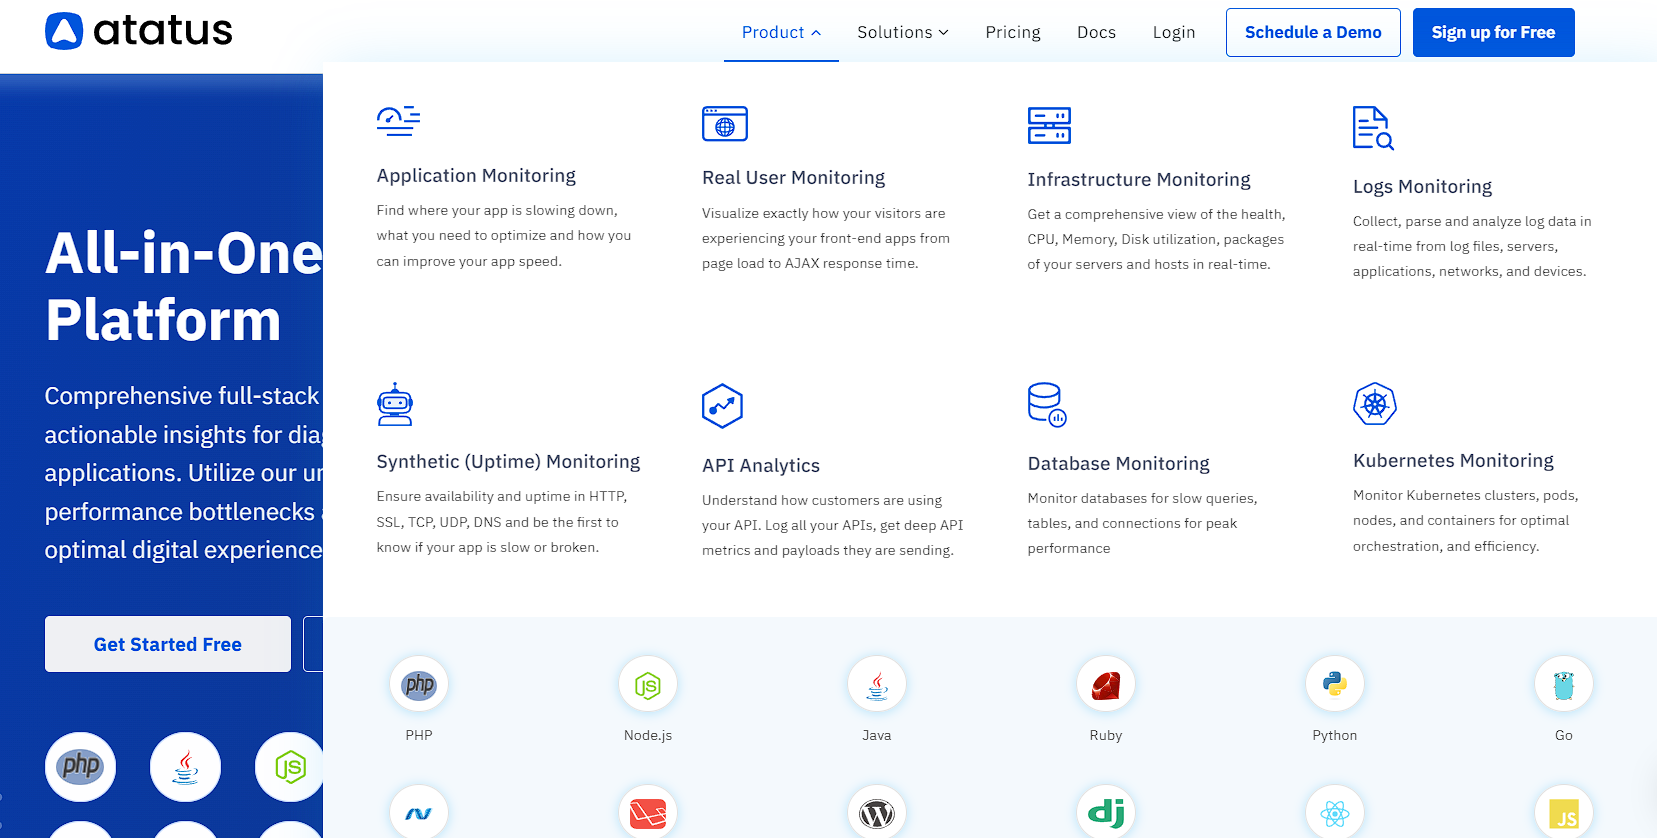
Atatus: Your Affordable Alternative to Dynatrace and New Relic
Atatus is a comprehensive observability solution that provides an excellent alternative to Dynatrace and New Relic.
Atatus offers a range of products including Application Performance Monitoring, Infrastructure Monitoring, Database Monitoring, Logs Monitoring, Real User Monitoring, API Analytics, and Uptime Monitoring (Synthetics) among others.
With Atatus, you get real-time insights into your application's performance, user experience, and infrastructure health. Customizable dashboards let you track performance metrics customised to your needs, and the alerting system notifies you of anomalies in real-time, enabling proactive troubleshooting.
Atatus is easy to use, with a user-friendly interface and intuitive setup process, allowing your team to focus on delivering exceptional user experiences without added complexity.
Atatus provides budget-friendly pricing plans that prioritize cost effectiveness without sacrificing features and functionalities. If you are not yet an Atatus customer, you can sign up for a 14-day free trial .
#1 Solution for Logs, Traces & Metrics
![]() APM
APM
![]() Kubernetes
Kubernetes
![]() Logs
Logs
![]() Synthetics
Synthetics
![]() RUM
RUM
![]() Serverless
Serverless
![]() Security
Security
![]() More
More


![New Relic vs Splunk - In-depth Comparison [2025]](/blog/content/images/size/w960/2024/10/Datadog-vs-sentry--19-.png)
![New Relic vs Sentry - Which Monitoring Tool to Choose? [2025]](/blog/content/images/size/w960/2024/10/VS--1-.png)