Dynatrace vs AppDynamics - A Feature Comparison Guide
Dynatrace and AppDynamics are two of the most well-known Observability and monitoring tools. Even though they share many features, they have several differences that might make you choose one over the other.
Dynatrace is great for comprehensive system performance monitoring. It covers everything from infrastructure and application performance to log management and real user monitoring.
AppDynamics, on the other hand, focuses more on application performance and business transactions. It offers detailed insights into how transactions perform, network monitoring, and user experience.
In this article, let us compare Dynatrace and AppDynamics side by side. Let us talk about their ease of use, APM features, pricing, and more, to help you decide which one is right for you.
Table of Contents
- Dynatrace vs AppDynamics - An overview
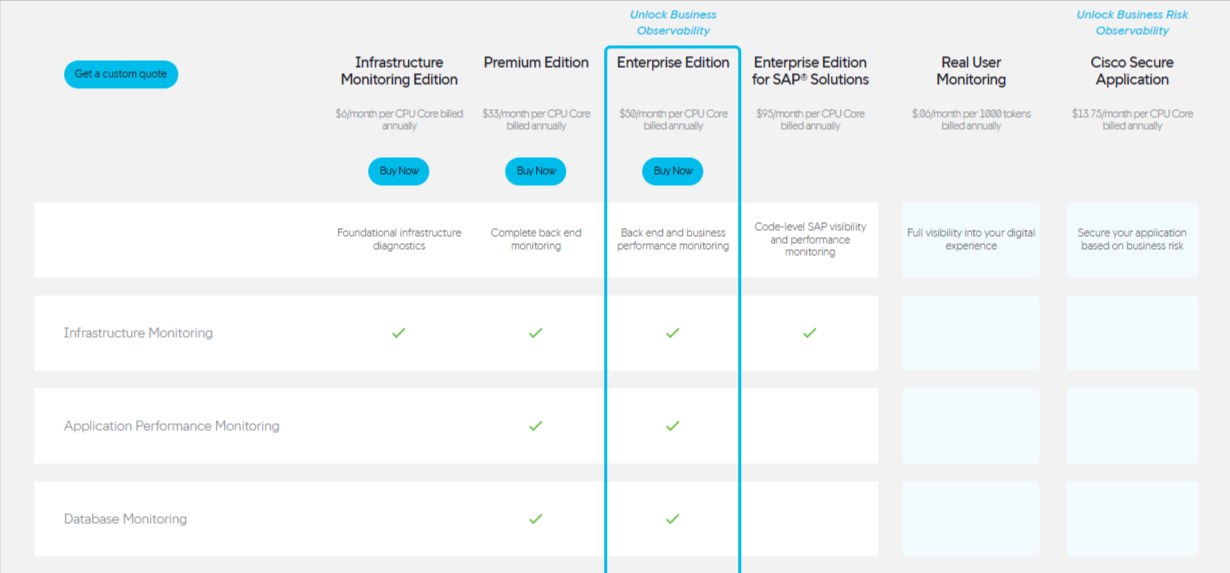
- Dynatrace vs AppDynamics: Exploring their range of products
- AI Capabilities: Dynatrace
- Application Security: AppDynamics
- Application Performance Monitoring (APM): AppDynamics
- Real User Monitoring: Dynatrace
- Documentation: Dynatrace
- Pricing: Both Dynatrace and AppDynamics can be costly.
- Dynatrace vs AppDynamics: Final Verdict
- A better Dynatrace and AppDynamics Alternative: Atatus
- Dynatrace vs AppDynamics vs Atatus
Dynatrace vs AppDynamics - An overview
What is Dynatrace?
Dynatrace is a comprehensive observability and monitoring platform that uses AI and automation to provide advanced insights and automated solutions for performance management. It helps organizations monitor, optimize, and manage the performance of their applications and infrastructure.
What is AppDynamics?
AppDynamics is a full-stack observability and monitoring platform that enables you to observe and visualize your entire technology stack, from databases and servers to cloud-native and hybrid environments. It provides comprehensive Application Performance Monitoring (APM) and IT operations analytics (ITOA).
Dynatrace vs AppDynamics: Exploring their range of products
| Features | Dynatrace | AppDynamics |
|---|---|---|
| APM | ✅ | ✅ |
| Log Monitoring | ✅ | ✅ |
| Application Security | ✅ | ✅ |
| Infrastructure Monitoring | ✅ | ✅ |
| RUM | ✅ | 🟡 |
| OpenTelemetry Support | ✅ | ✅ |
| AI Capabilities | ✅ | 🟡 |
| UI/UX | ✅ | ✅ |
| Trial | ✅ | ✅ |
| Budget-friendly | ❌ | ❌ |
✅ Available ❌ Not Available 🟡 Limited
AI Capabilities
Dynatrace
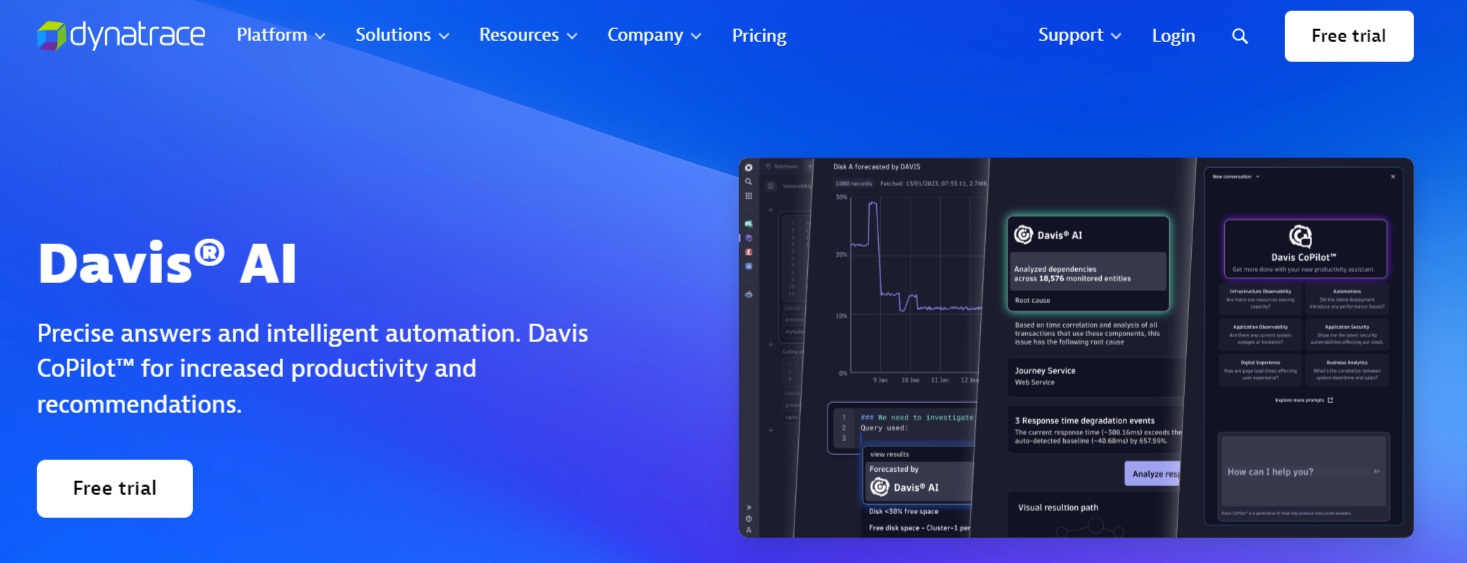
Dynatrace’s AI engine, Davis, provides automatic root cause analysis and anomaly detection, significantly reducing the time to identify and resolve issues. Davis AI performs automatic root cause analysis, auto application topology discovery, and auto-coded workflows.
AppDynamics
AppDynamics also employs AI to drive its analytics and monitoring capabilities. The features include AIOps, anomaly detection, and performance insights. It offers a solid performance but may require more manual configuration compared to Dynatrace.
Application Security
Dynatrace
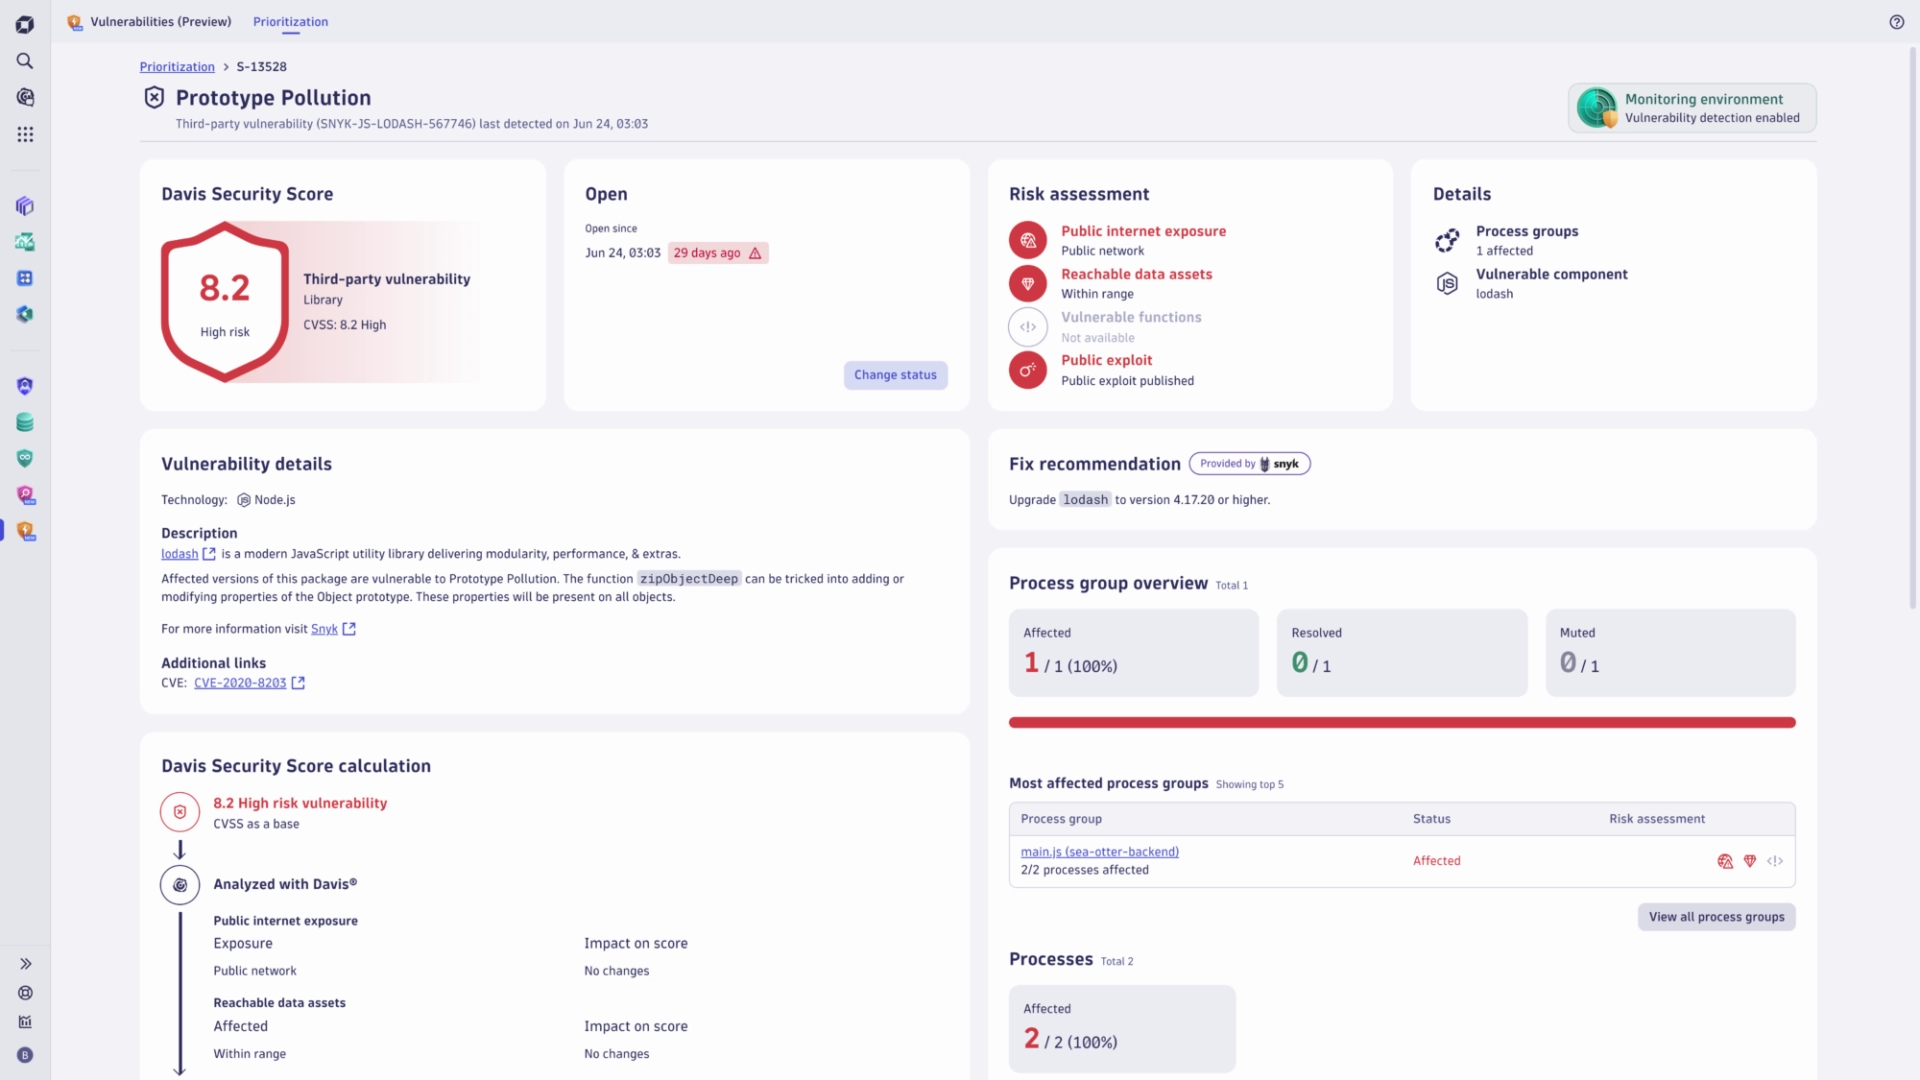
Dynatrace offers detailed security insights, giving you a clear view of vulnerabilities and how they might impact key components. It detects code and configuration issues in real-time, blocking exploits to keep everything running smoothly.
With Davis AI, it prioritizes the most critical vulnerabilities and cuts down on false alarms. Dynatrace also monitors data flow within applications to spot and stop malicious activity without disrupting important processes. Plus, it quickly identifies and helps you fix zero-day vulnerabilities, keeping your apps secure and performing well.
AppDynamics
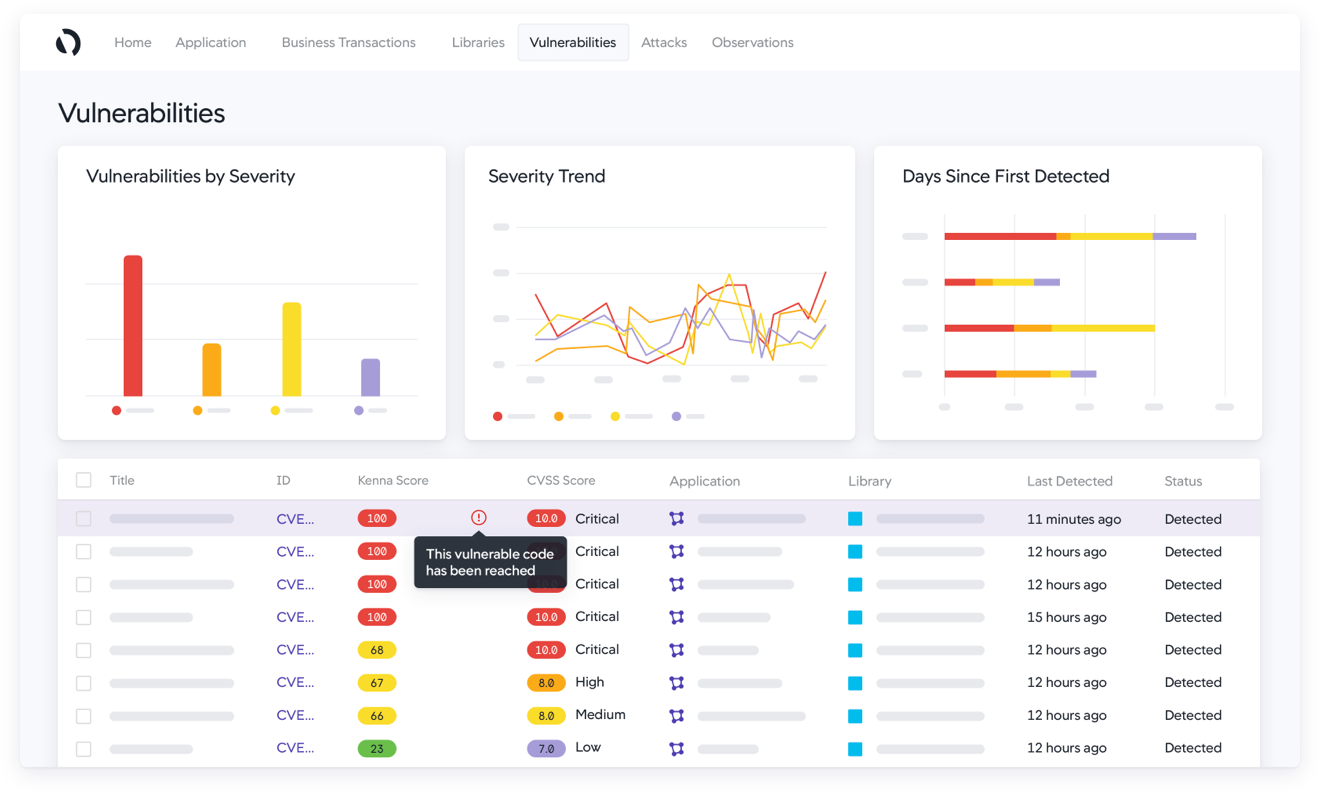
AppDynamics, smoothly blends performance and security insights without extra setup. It offers clear security views, spotting and fixing code and configuration problems as they happen.
AppDynamics keeps an eye out for threats all the time, blocking attacks automatically to keep things running fast and smoothly. Its RASP solution protects app communications without needing extra firewalls or proxies.
Application Performance Monitoring (APM)
Dynatrace
Dynatrace gives a complete view of your entire application stack, from user experience and application code to dependencies, databases, and infrastructure components. It analyse application performance throughout your application’s full stack, down to each individual transaction, across all layers.
With its advanced AI, it automatically spots anomalies and pinpoints root causes, so you can fix issues before they affect your users. I found its distributed tracing really helpful, offering detailed insights into each trace's relevant calls and the associated logs.
AppDynamics
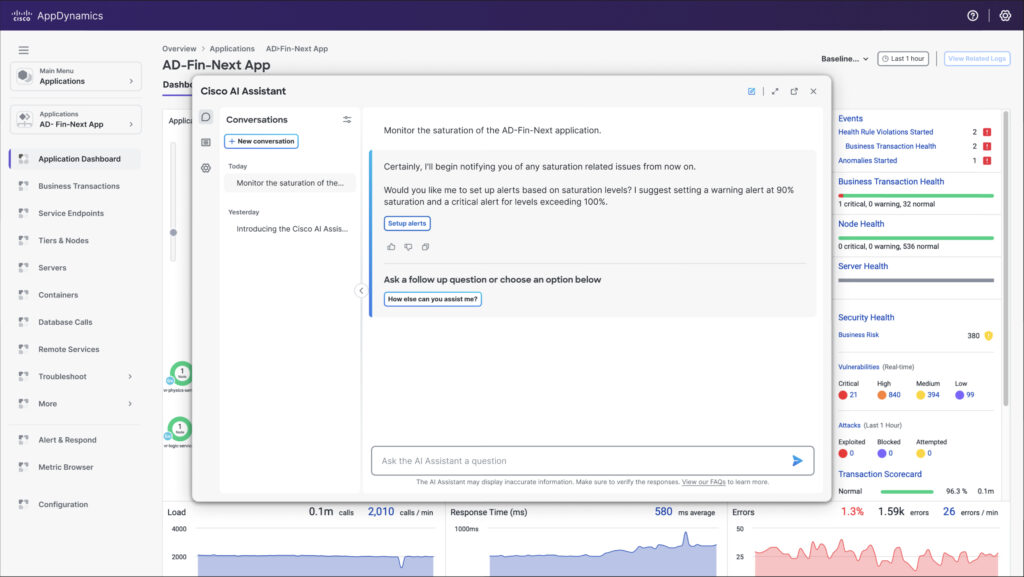
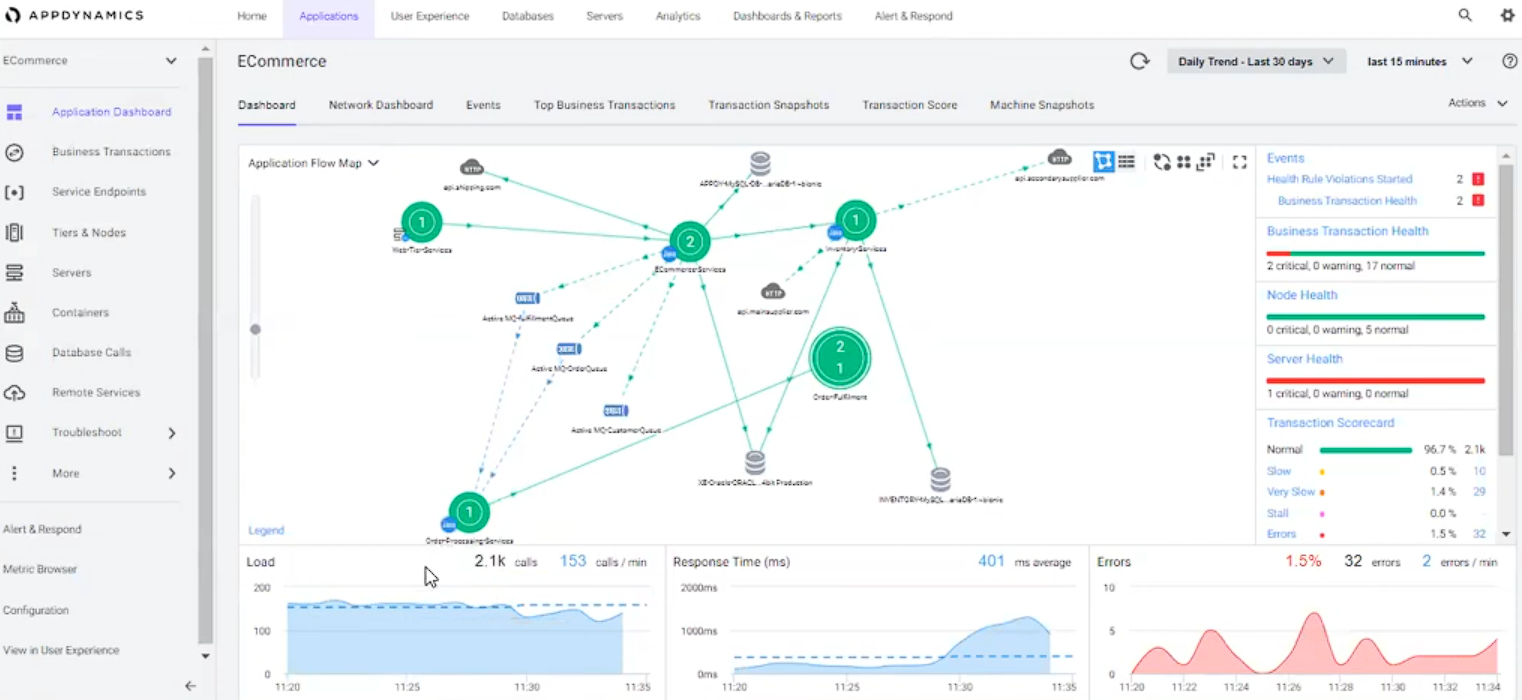
AppDynamics provides real-time performance data, offering visibility and intelligence to drive both application and business performance. It automatically detects anomalies to ensure smooth operations.
A standout feature is the flow maps, which provide a dynamic visual representation of your app's activities. These maps illustrate nodes, servers, databases, and other components, as well as the flow of business transactions through them.
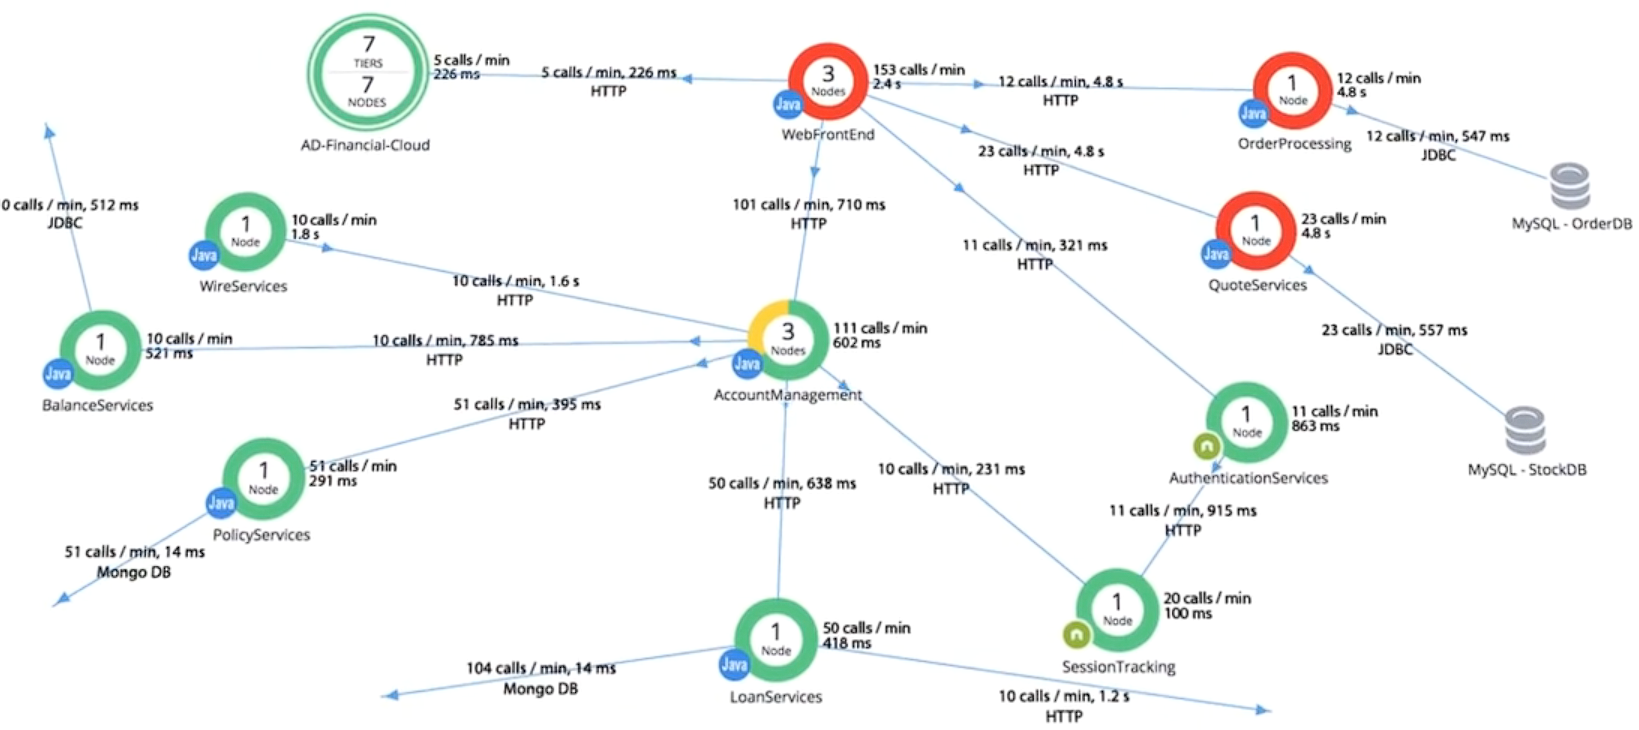
The dashboard shows an aggregated view of key metrics, including load, response time, and errors, enabling comprehensive monitoring and quick issue resolution.
Real User Monitoring
Dynatrace
Dynatrace Real User Monitoring (RUM) uses AI to pinpoint issues and identify root causes. This enables faster bug fixes with deep-dive analysis into source code and database statements. . It provides insights into key user metrics through Waterfall Analysis, including bytes downloaded, interactive time, network time, UX time, and visually complete.
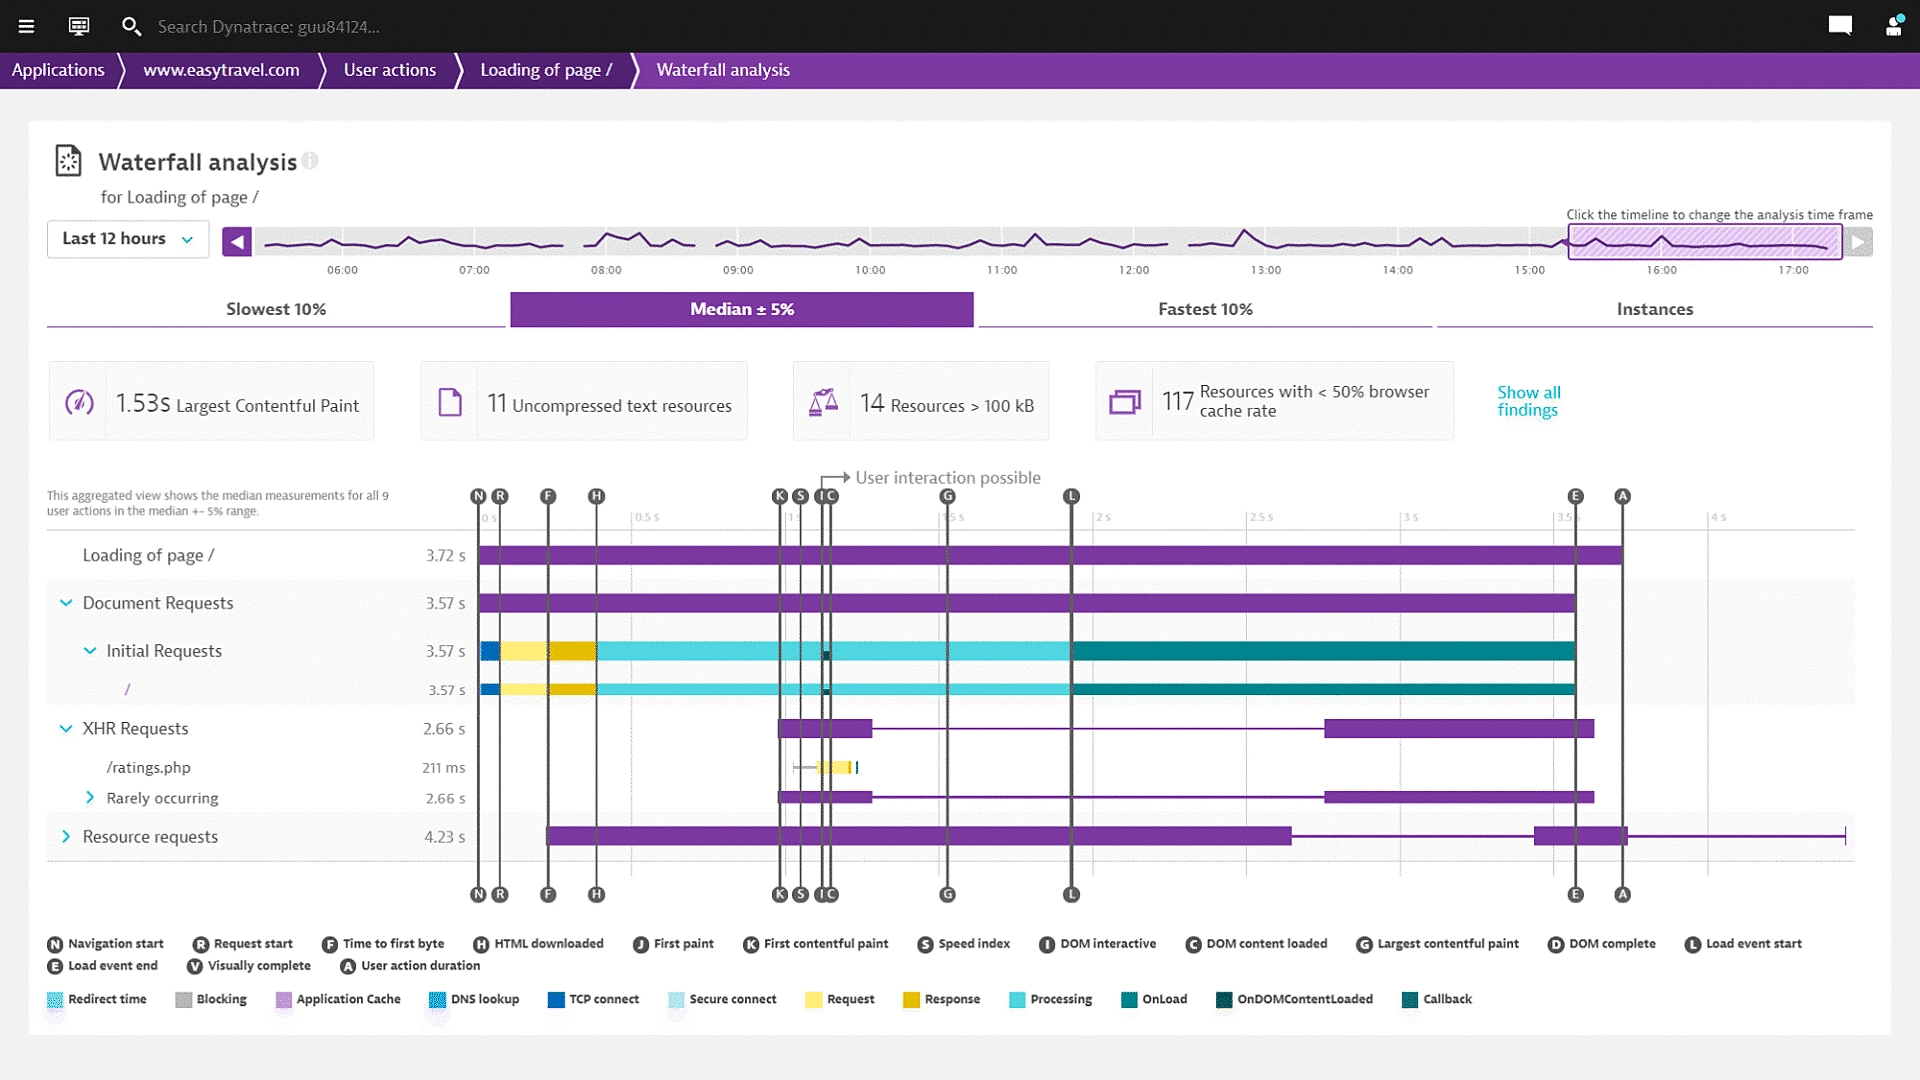
Dynatrace provides features to view JavaScript error messages, user actions, and stack traces, helping you understand and resolve errors. It goes beyond traditional metrics like time-to-first-byte, DOM-interactive, and full-page load. Instead, Dynatrace focuses on optimizing for visually complete and speed index, delivering a user experience that matches real-world interactions.
AppDynamics
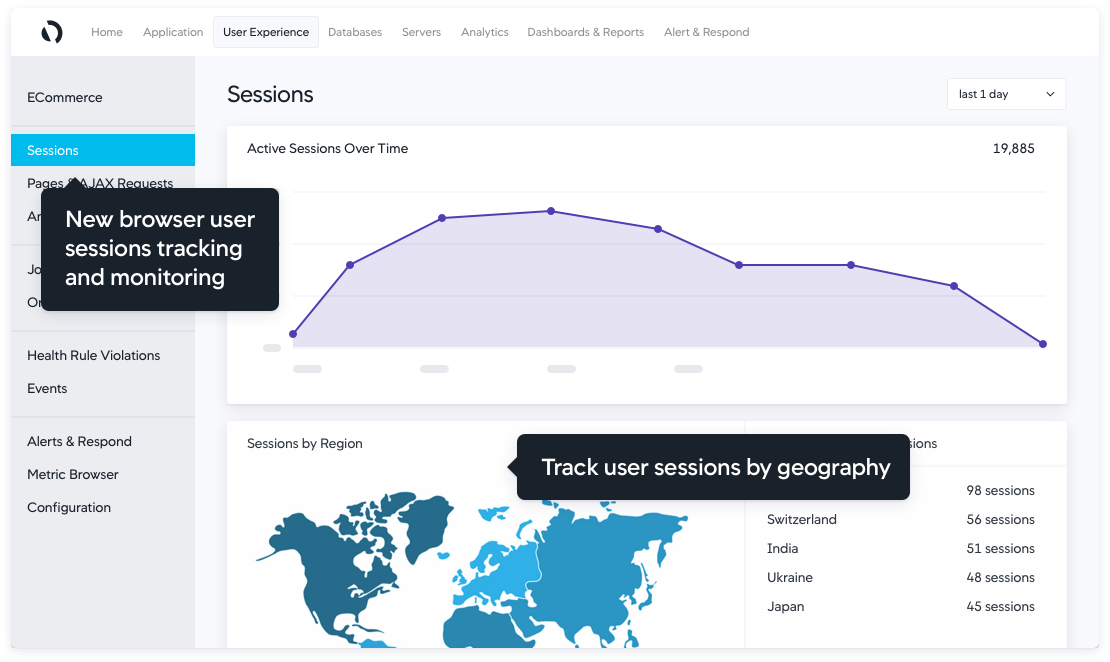
AppDynamics Real User Monitoring (RUM) provides a comprehensive view of global customer journeys, allowing you to track metrics like top page view requests and longest response times from a single dashboard. It helps to optimize web apps by using data such as response time, first byte time, and DOM ready time.
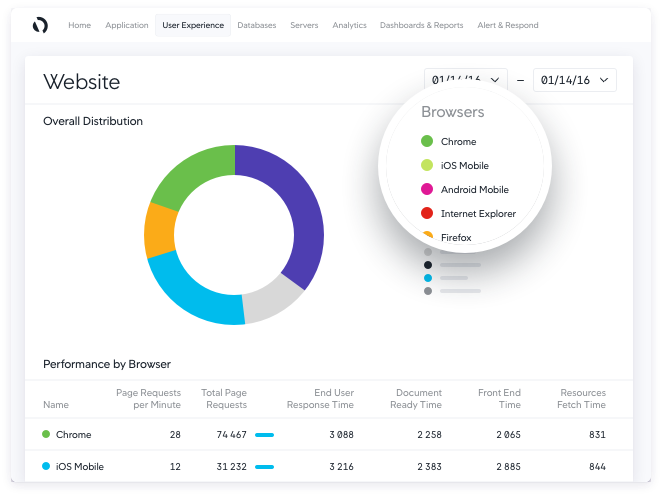
AppDynamics RUM provides insights into user distribution by browser, version, device, and location, enabling targeted optimizations. It also quickly identifies poorly performing lines of code from web apps to databases, enhancing collaboration between teams.
Documentation
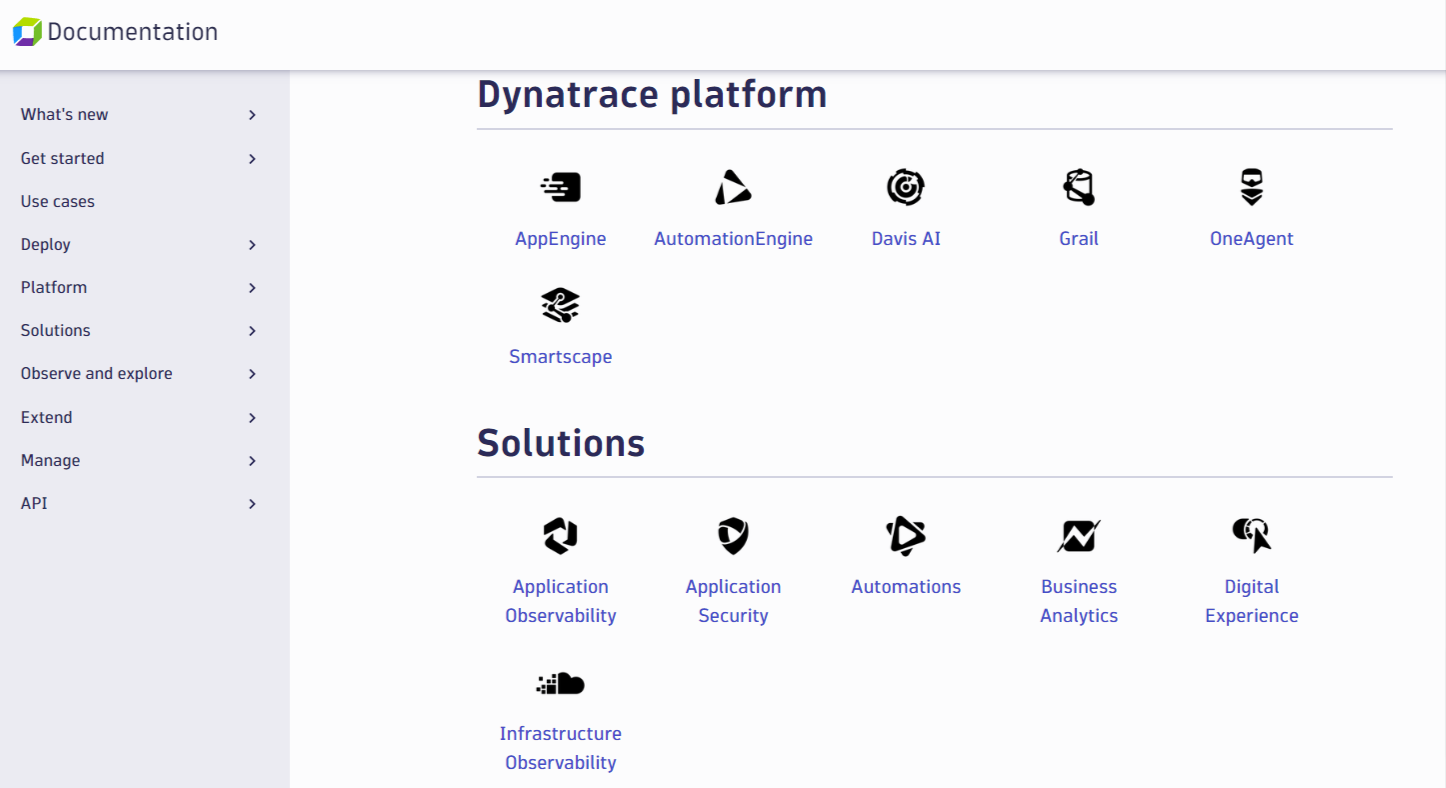
Dynatrace offers extensive official documentation, but finding specific information often requires navigating through multiple documents. While I found the documentation generally helpful, I struggled with some aspects and had to watch videos on their YouTube channel for better clarity.
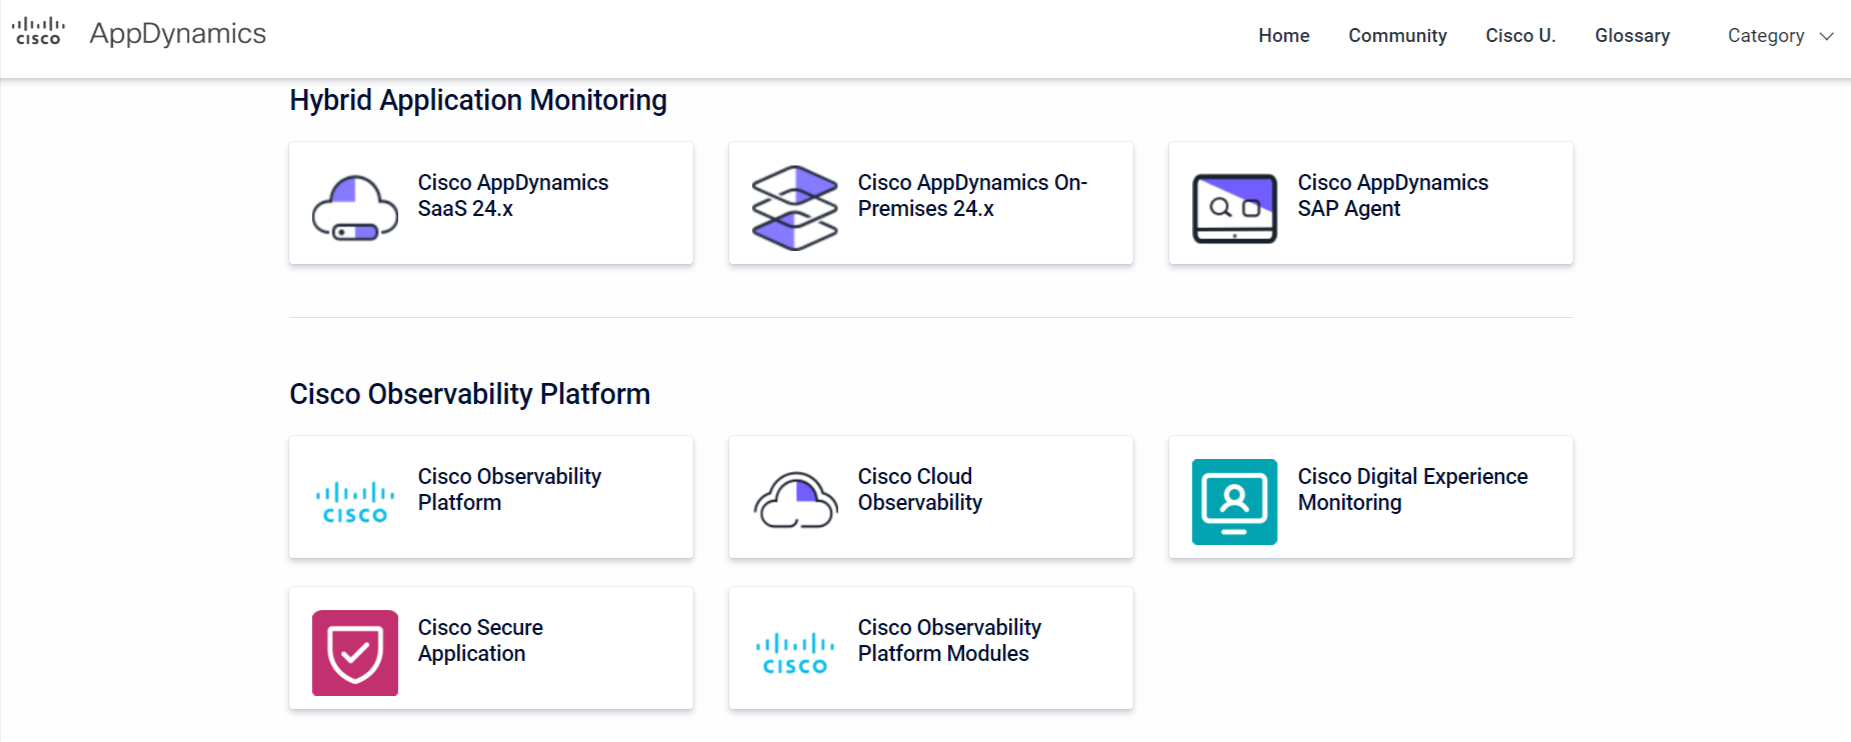
In contrast, AppDynamics documentation is good but not as well-structured as Dynatrace’s. I found it challenging to follow, making it harder to get the information I needed.
Pricing
Dynatrace
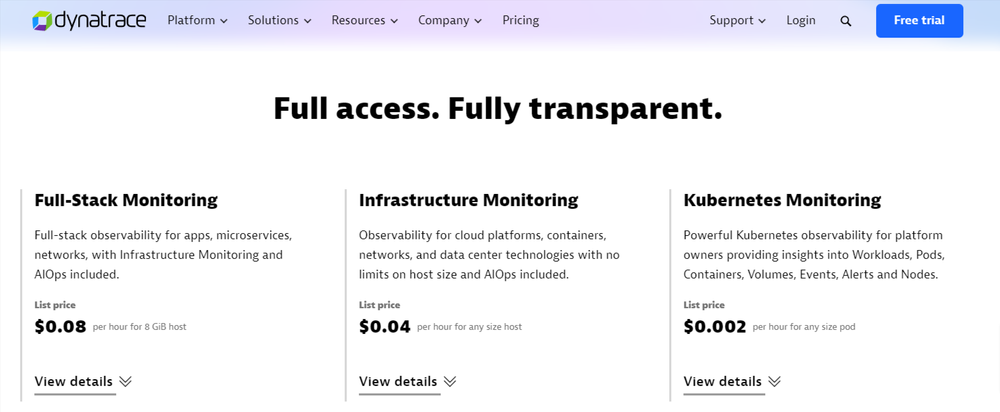
Dynatrace offers a more straightforward and flexible pricing model. Each service, like application monitoring or infrastructure monitoring, has its own pricing structure. This means your cost will depend on which services you choose and how much you use them.
AppDynamics
AppDynamics uses a subscription-based pricing model, where businesses pay a fixed fee each month or year for access to the platform's features, regardless of how much they use them. This simplifies budgeting, but it can also lead to under-utilization of resources and unnecessary expenses.
Dynatrace vs AppDynamics: Final Verdict
Choose Dynatrace if:
- You want an easy-to-use tool.
- You need AI for automatic issue detection and fixes.
- You are managing a large or complex setup and want built-in features.
- You prefer everything included without much customization.
Choose AppDynamics if:
- You don’t mind a steeper learning curve.
- You need lots of customization options.
- You like having detailed control over how monitoring works.
A better Dynatrace and AppDynamics Alternative: Atatus
Atatus is a comprehensive observability solution that provides an excellent alternative to Dynatrace and AppDynamics.
Atatus offers a range of products including Application Performance Monitoring, Infrastructure Monitoring, Database Monitoring, Logs Monitoring, Real User Monitoring, API Analytics, and Uptime Monitoring (Synthetics) among others.
Here are a few reasons to consider Atatus as an alternative to Dynatrace and AppDynamics.
- All-in-One Platform: Atatus offers a comprehensive platform that integrates all your monitoring needs in one place.
- APM (Application Performance Monitoring): Identify and fix spikes in endpoint failures and monitor application performance in real-time. Atatus APM offers features like transaction performance monitoring, database monitoring, network performance monitoring, API failures monitoring, error monitoring, deployment tracking.
- Infrastructure Monitoring: Atatus infrastructure monitoring allows you to monitor, quickly pinpoint and fix the issues of your entire infrastructure. Monitor all key infrastructure performance metrics and get notified on downtime of your applications.
- Logs Monitoring: Atatus provides complete visibility by processing all your logs, generating metrics, and visualizing log data from a central location. Choose what to log and control costs effectively.
- Database Monitoring: Atatus helps you identify the slowest database queries by analyzing traces, request details, and dependent services. It allows you to monitor database performance with query metrics and troubleshoot high CPU and memory utilization issues.
- Real User Monitoring: Atatus Real User Monitoring helps you identify and fix slow frontend performance issues. It provides detailed insights into which page views are calling server-side controllers, including response time, callback time, throughput, HTTP failures, data transfer size, and more.
- Uptime Monitoring (Synthetics): Atatus Synthetic helps you achieve high performance by testing how well your site works and identifying potential performance bottlenecks in your application. Explore the metrics it provides to optimize critical transactions that cause errors.
- Affordable Pricing: Atatus provides budget-friendly pricing plans that prioritize cost effectiveness without sacrificing features and functionalities.
Dynatrace vs AppDynamics vs Atatus
| Features | Dynatrace | AppDynamics | Atatus |
|---|---|---|---|
| APM | ✅ | ✅ | ✅ |
| Log Monitoring | ✅ | ✅ | ✅ |
| Application Security | ✅ | ✅ | ✅ |
| Infrastructure Monitoring | ✅ | ✅ | ✅ |
| RUM | ✅ | 🟡 | ✅ |
| OpenTelemetry Support | ✅ | ✅ | ✅ |
| AI Capabilities | ✅ | 🟡 | 🟡 |
| UI/UX | ✅ | ✅ | ✅ |
| Trial | ✅ | ✅ | ✅ |
| Budget-friendly | ❌ | ❌ | ✅ |
✅ Available ❌ Not Available 🟡 Limited
Not an Atatus customer yet? Try it out with a 14-day free trial.
#1 Solution for Logs, Traces & Metrics
![]() APM
APM
![]() Kubernetes
Kubernetes
![]() Logs
Logs
![]() Synthetics
Synthetics
![]() RUM
RUM
![]() Serverless
Serverless
![]() Security
Security
![]() More
More


![New Relic vs Splunk - In-depth Comparison [2025]](/blog/content/images/size/w960/2024/10/Datadog-vs-sentry--19-.png)
![New Relic vs Sentry - Which Monitoring Tool to Choose? [2025]](/blog/content/images/size/w960/2024/10/VS--1-.png)