Datadog vs Splunk: A Side-by-Side Comparison [2025]
![Datadog vs Splunk: A Side-by-Side Comparison [2025]](/blog/content/images/size/w960/2024/12/Untitled-design--41-.png)
Datadog and Splunk are both leading tools for monitoring and observability. Each offers a range of features designed to help you understand and manage your data.
Datadog provides tools for tracking application performance and analyzing logs in real-time. Splunk, meanwhile, is known for its powerful log analysis and search capabilities.
In this post, we will compare Datadog and Splunk on important aspects like APM, log management, search capabilities, and more. This will give you a better idea of which tool is right for your needs.
In this blog post:
- What is Datadog?
- What is Splunk?
- Comparing Datadog and Splunk
- Datadog vs Splunk: Understanding the Best Use Cases
- Atatus: A Better Alternative to Datadog and Splunk
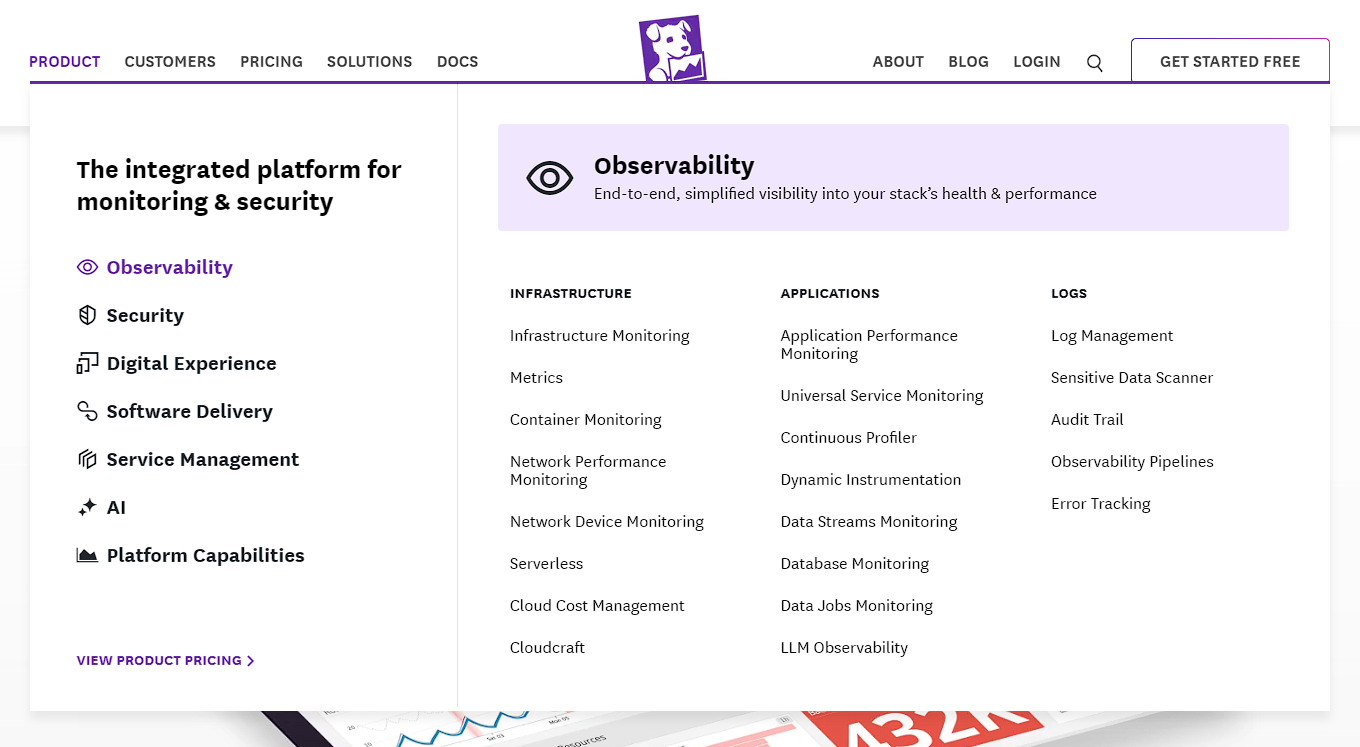
What is Datadog?
Datadog is a cloud-based platform for monitoring and analytics. It offers a SaaS solution that integrates and automates infrastructure monitoring, application performance monitoring, log management, real-user monitoring, and various other capabilities, providing unified, real-time observability and security across an entire technology stack. With more than 750 built-in integrations, Datadog allows you to gain visibility across all your systems, apps, and services.
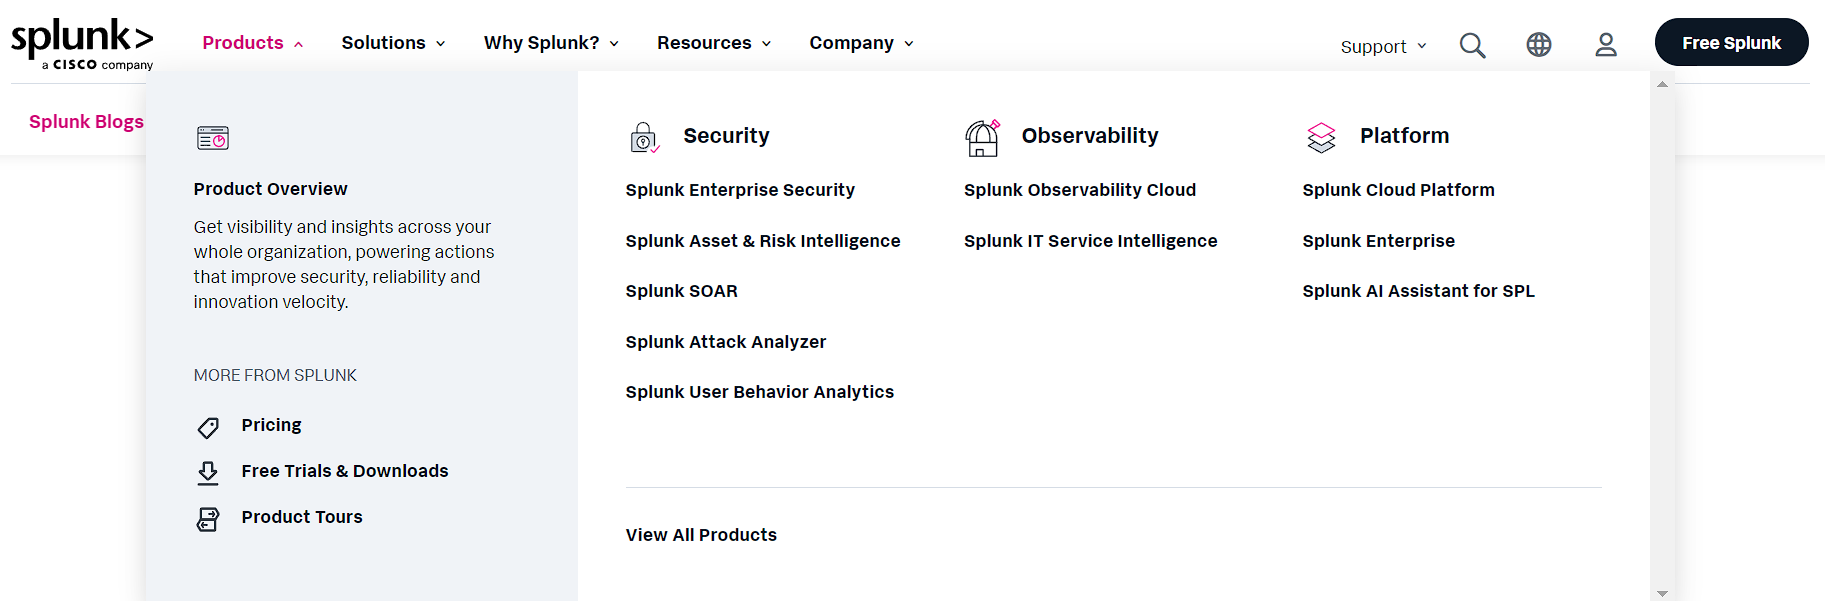
What is Splunk?
Splunk is a powerful data platform designed for searching, monitoring, and analysing machine-generated data. It specializes in turning large volumes of machine data into actionable insights, supporting use cases like log management, and security. Additionally, Splunk offers a wide range of integrations, allowing users to connect and analyse data from various systems, applications, and services for comprehensive insights.
Comparing Datadog and Splunk
A Quick Overview of Datadog vs. Splunk Features:
| Feature | Datadog | Splunk |
|---|---|---|
| Infrastructure Monitoring | ✅ | ✅ |
| APM | ✅ | ✅ |
| Log Management | 🟡 | ✅ |
| Synthetic Monitoring | ✅ | ✅ |
| Cloud SIEM | 🟡 | ✅ |
| Search Capabilities | 🟡 | ✅ |
| Alerting | ✅ | ✅ |
| Free Trial | 🟡 | 🟡 |
Infrastructure Monitoring
Datadog
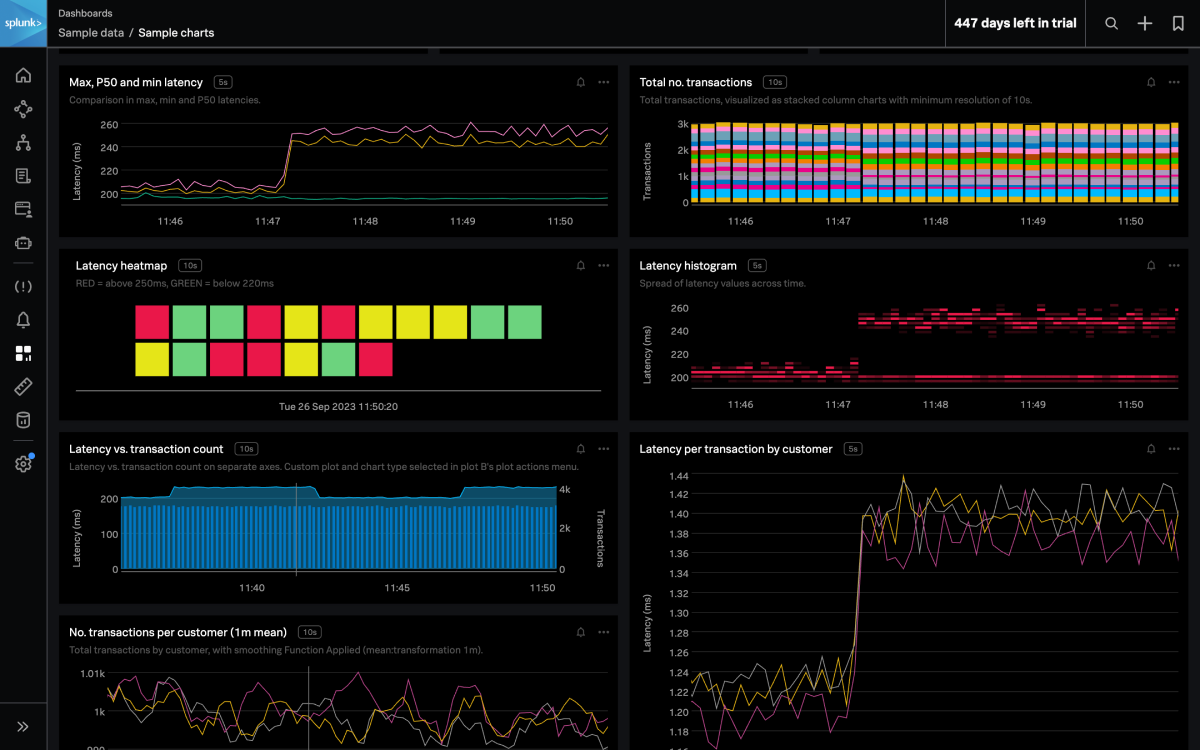
Once you install the Datadog agent, it automatically starts monitoring infrastructure. It’s a straightforward process. Infrastructure monitoring in Datadog covers essential features that let you visualize, monitor, and measure how your hosts, containers, and processes are performing.
You can easily see all the hosts monitored by Datadog in the infrastructure list. The host and container maps let you see all your hosts on one screen with customizable groupings, filters, and metrics that are easy to understand.
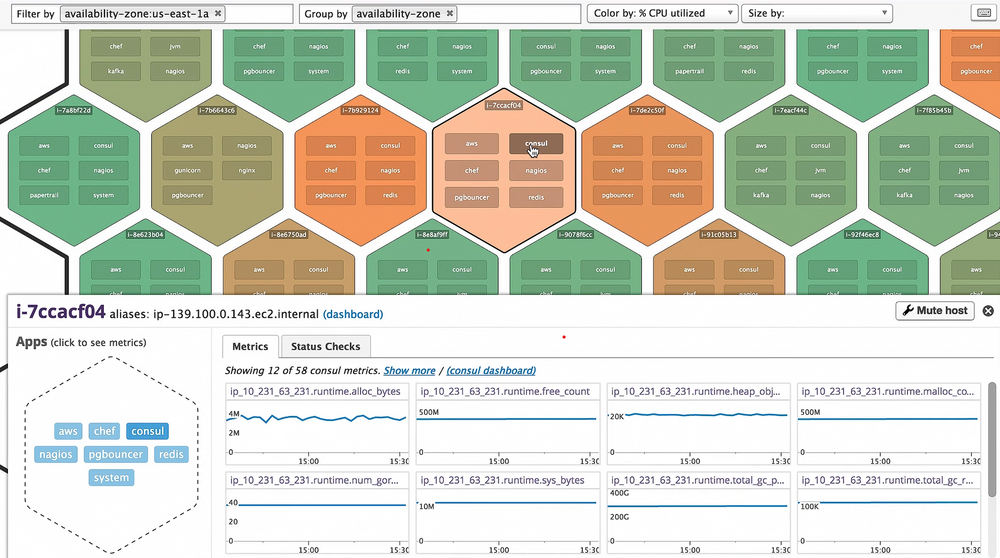
The containers view provides real-time visibility into all your containers, and the processes view offers a detailed look at the most granular elements in your deployment, also in real-time.
Splunk
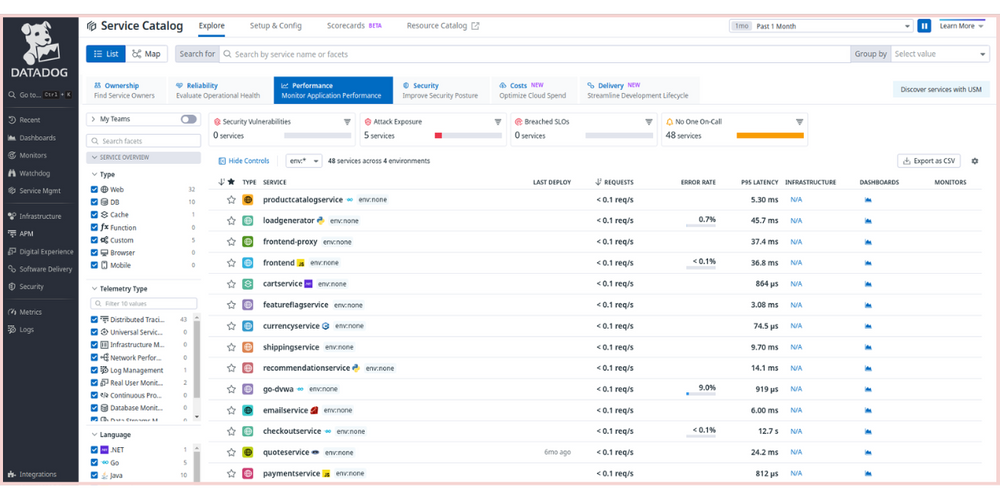
Connecting Splunk Observability Cloud to your cloud service provider lets you collect data from services in AWS, GCP, or Azure. While it’s not required to connect to cloud services to monitor hosts or Kubernetes clusters running in the cloud, connecting your cloud account is the only way to gather cloud metadata.
To view your infrastructure, go to the navigation menu and select infrastructure overview. Here, you can explore different layers of your tech stack, including cloud services, containers, and hosts. You can also visualize metrics for a quick understanding of your system and receive alerts and notifications to stay on top of key indicators for services, infrastructure, and applications.
Both tools are great for infrastructure monitoring, but looking at the costs can help you decide which one fits your needs and budget better.
Application Performance Monitoring(APM)
Datadog
Starting with Datadog APM is easiest with single step instrumentation. You just need to install the Datadog agent and instrument your application in one go, no extra setup needed. Datadog APM offers deep visibility into your applications, making it easier to identify performance bottlenecks and troubleshoot issues.
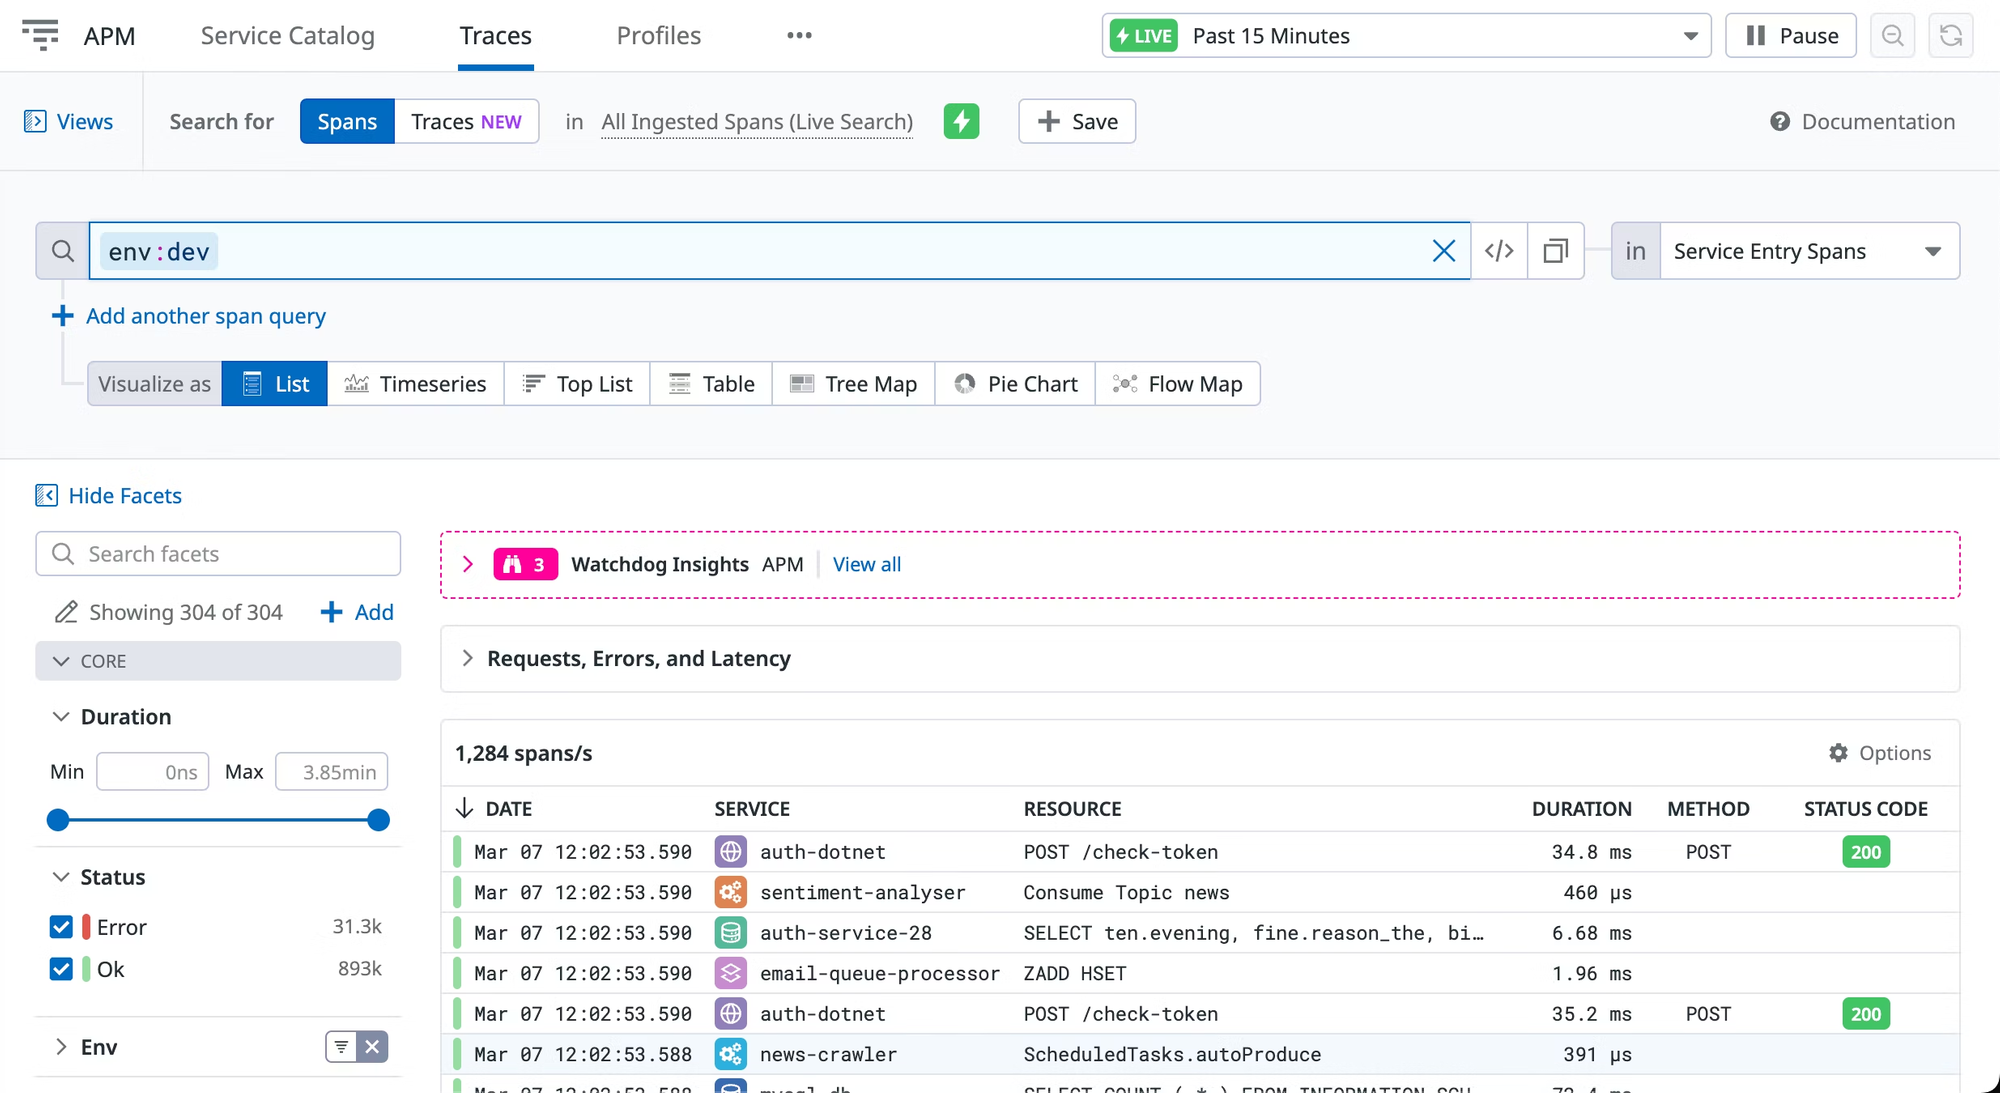
The trace explorer feature allows you to search and analyse traces in real-time, helping you quickly understand the full context of any problem by connecting to related logs and metrics.
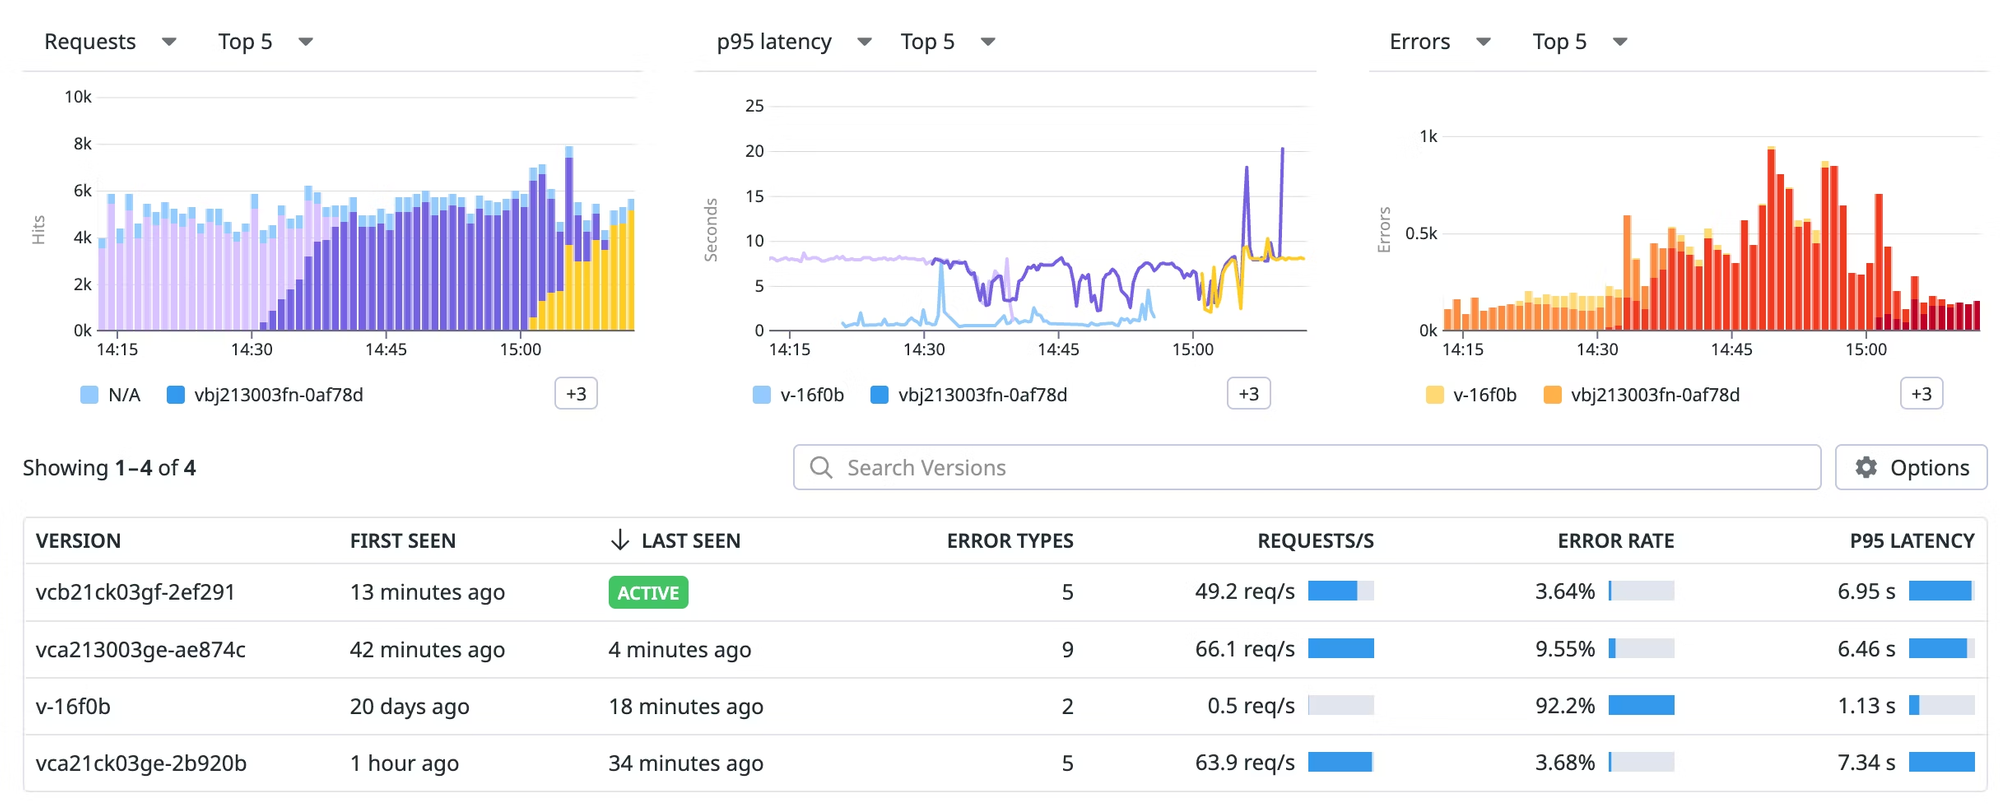
The service page is also great for monitoring performance and comparing versions during deployments. These are just a few ways Datadog APM has made my experience smoother and more efficient.
Splunk
I set up Splunk APM by first installing the SignalFx-SmartAgent on my server. The other option is to use the OpenTelemetry Collector. After that, I updated the configuration file to start accepting APM traces.
I then navigated to the service map by clicking the APM tab. This instantly provided me with visibility into service interactions, inferred services, dependencies, and overall performance, showing all the instrumented services.
To troubleshoot further, I used the Troubleshooting tab, where I could see service latency and identify root errors.
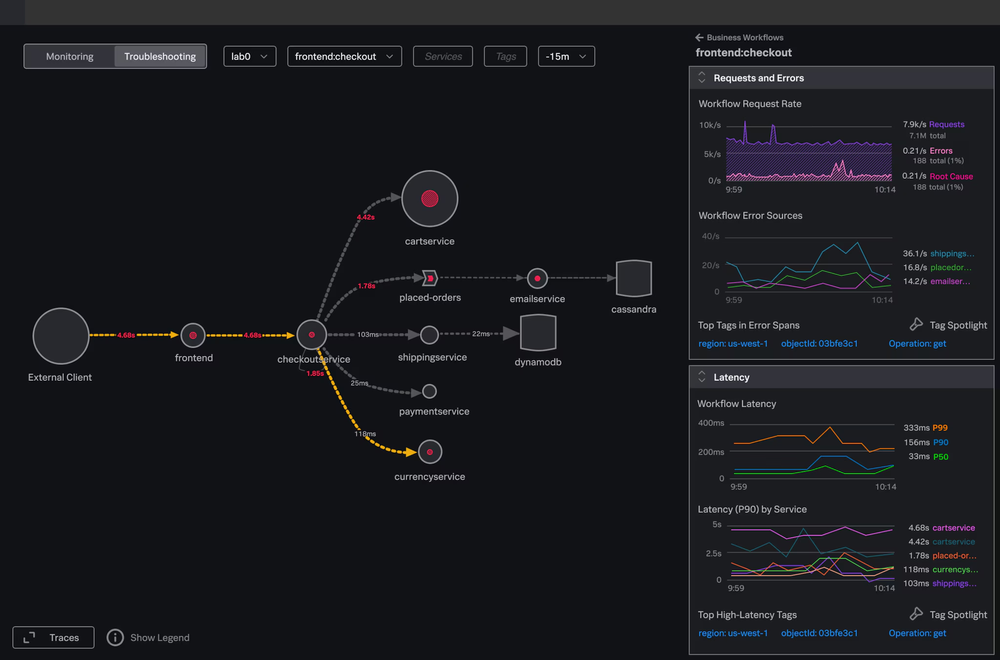
you can view and drill down into a trace by clicking the Show Traces button at the bottom left of the troubleshooting service map. This opens options to filter traces by environment, service, tags, and timeframe. Once filters are applied, individual trace IDs and spans can be clicked to view their detailed metadata.
Both tools provide good APM capabilities, but Datadog stands out for its strong features, ease of use, and comprehensive functionality.
Log Management
Datadog
When I set up the Datadog agent, enabling log collection was a simple process. All I had to do was change logs_enabled: false to logs_enabled: true in the main configuration file (datadog.yaml). Once that was done, the agent was ready to start tracking log files.
After the logs are collected and ingested, they appear in the log explorer, which has become my go-to tool for log troubleshooting and exploration. The log explorer offers a range of features that make it easy to manage and analyze logs.
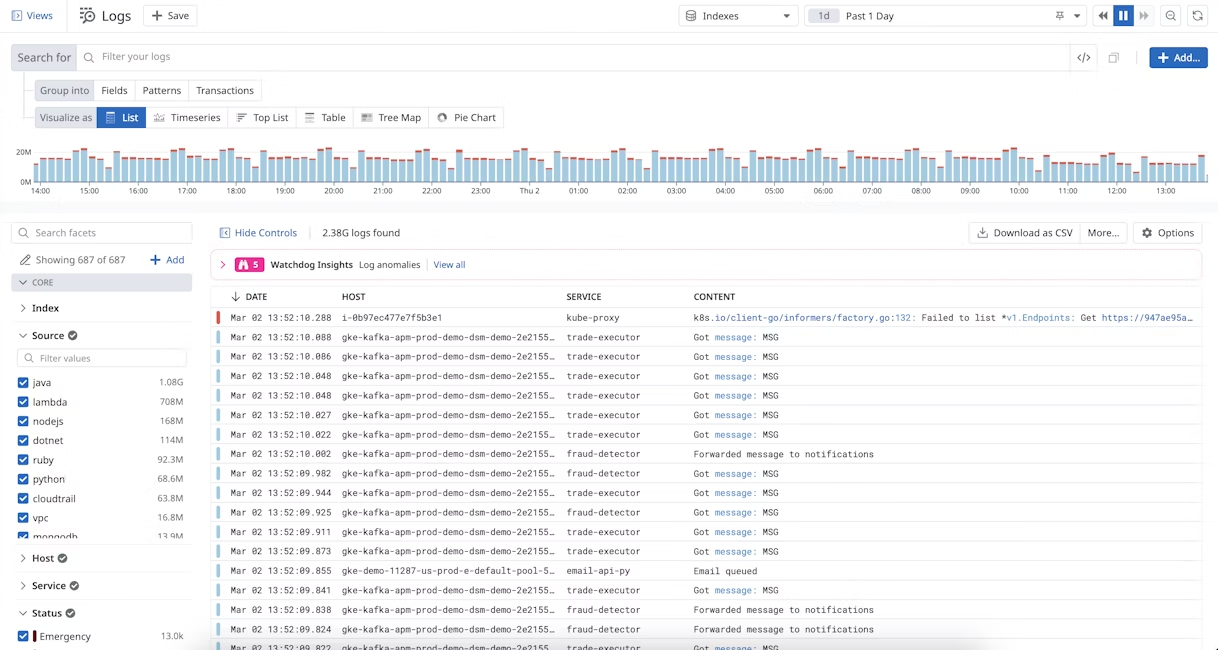
You can search and filter logs to focus on specific details, group logs into higher-level entities like fields or patterns to consolidate information, and visualize the results to gain insights. Additionally, Datadog offers the ability to export your Log Explorer view, allowing you to reuse it later or in different contexts.
Splunk
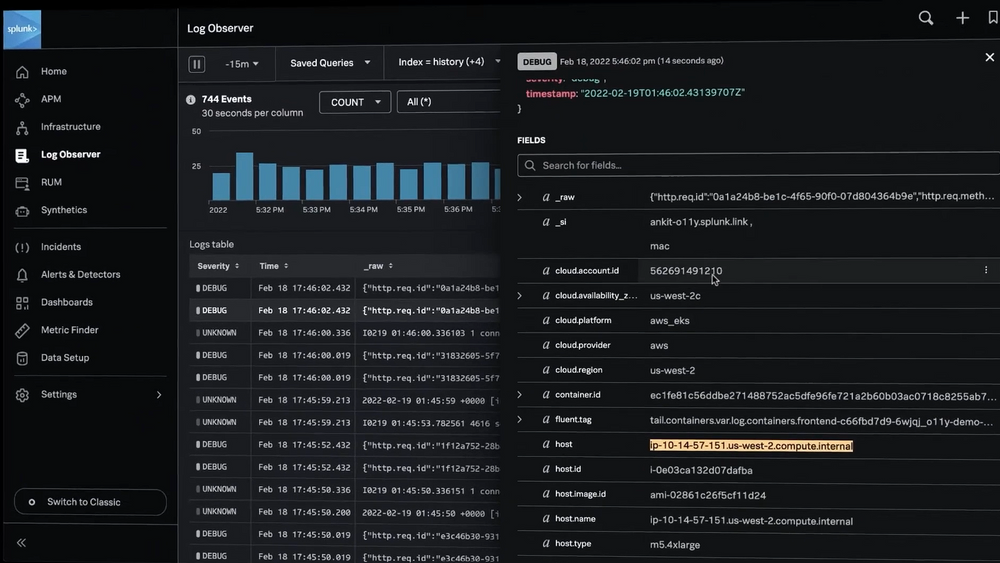
Splunk is great for managing large volumes of data, but it doesn't automatically collect logs from applications. To capture those logs, you need to install and configure the Universal Forwarder (UF) to properly format the data before sending it to Splunk.
For better log management, Log Observer Connect, a feature in Splunk Observability Cloud, makes it easy to import the same log data into a user-friendly, codeless interface. This feature helps quickly identify and resolve issues.
For large datasets and heavy log volumes, Splunk is the better choice. If you need less log management and analysis, Datadog is a good option.
Synthetic Monitoring
Datadog
Datadog Synthetic Monitoring, it’s a reliable tool that lets you set up tests for APIs, browsers, and mobile apps without needing to write code. These tests simulate real user actions and requests, helping you catch issues before they affect your users. One thing I find useful is how it shows step-by-step screenshots and session replays, so you can see exactly what’s happening at each step.
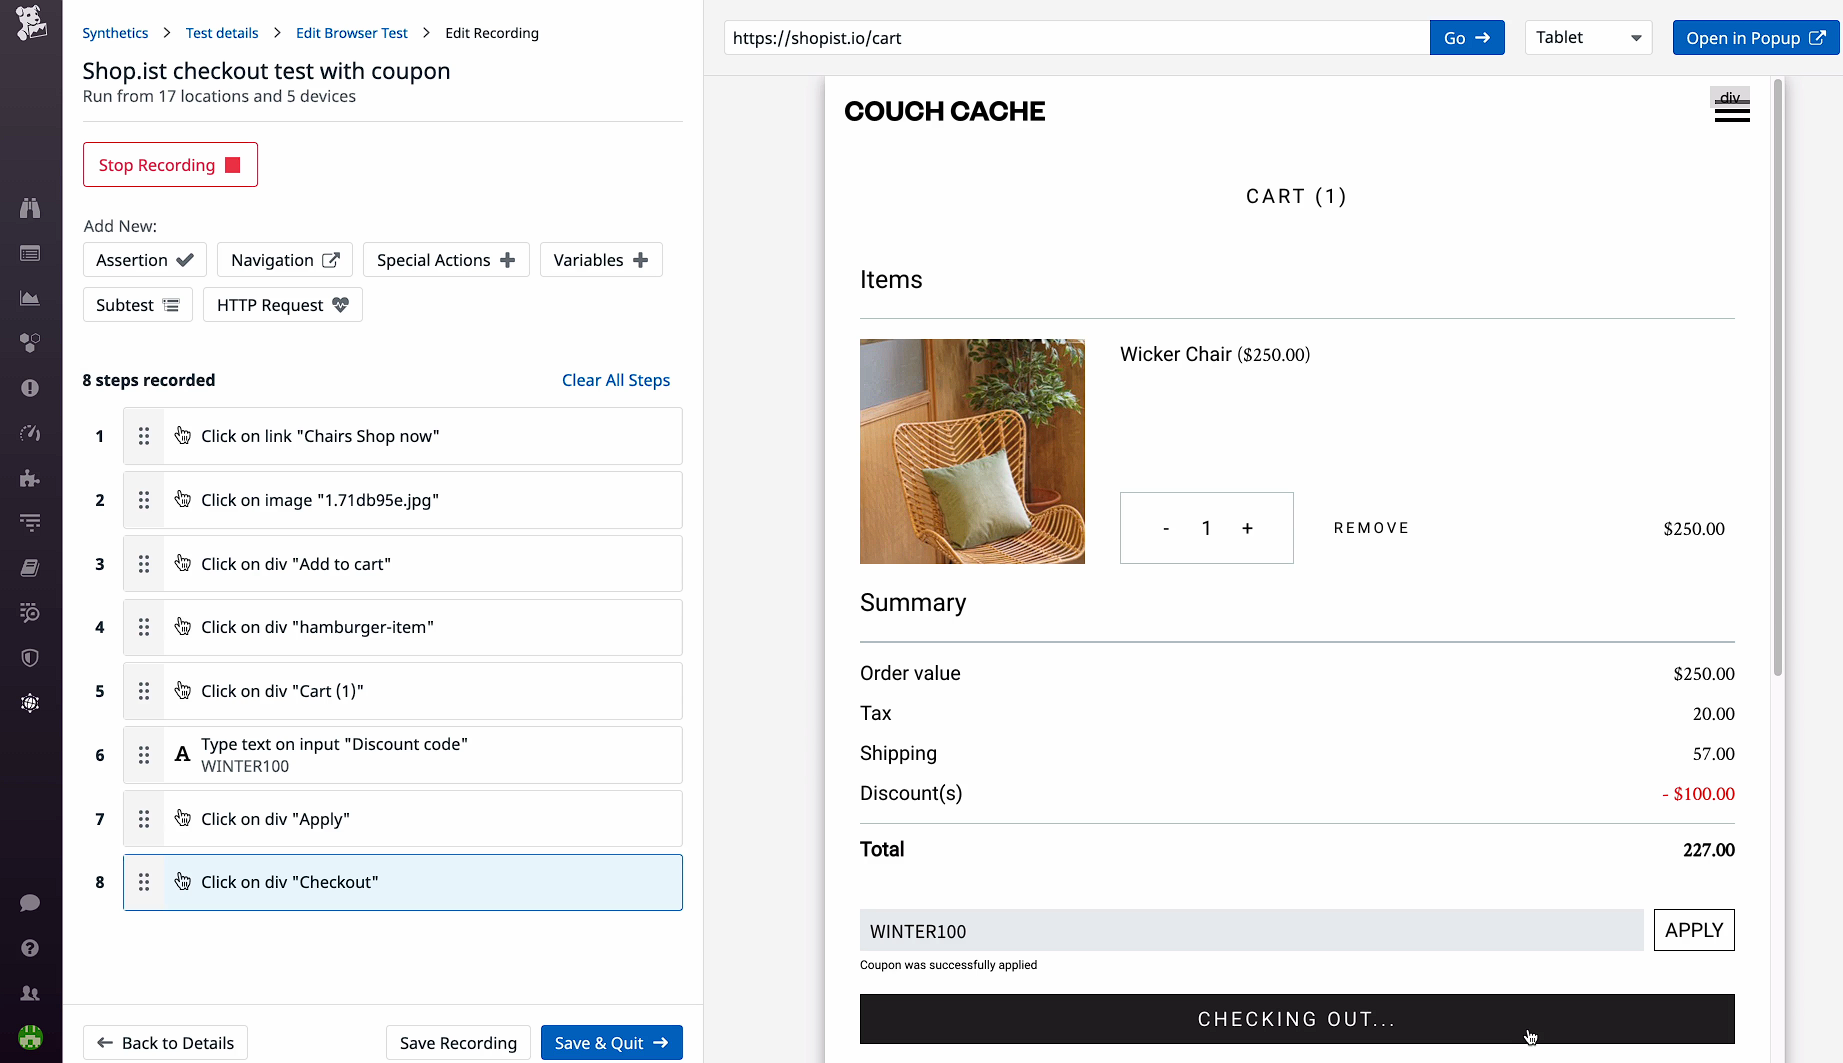
It also lets you track network and performance metrics and validate your systems from both global and private locations. Plus, it is effective for monitoring uptime and performance alongside your business metrics, making it easier to stay on top of your SLAs and SLOs.
Splunk
Using Splunk Synthetic Monitoring, I can quickly detect and resolve issues across webpages and APIs. The end-to-end testing helped me catch performance problems before customers do.
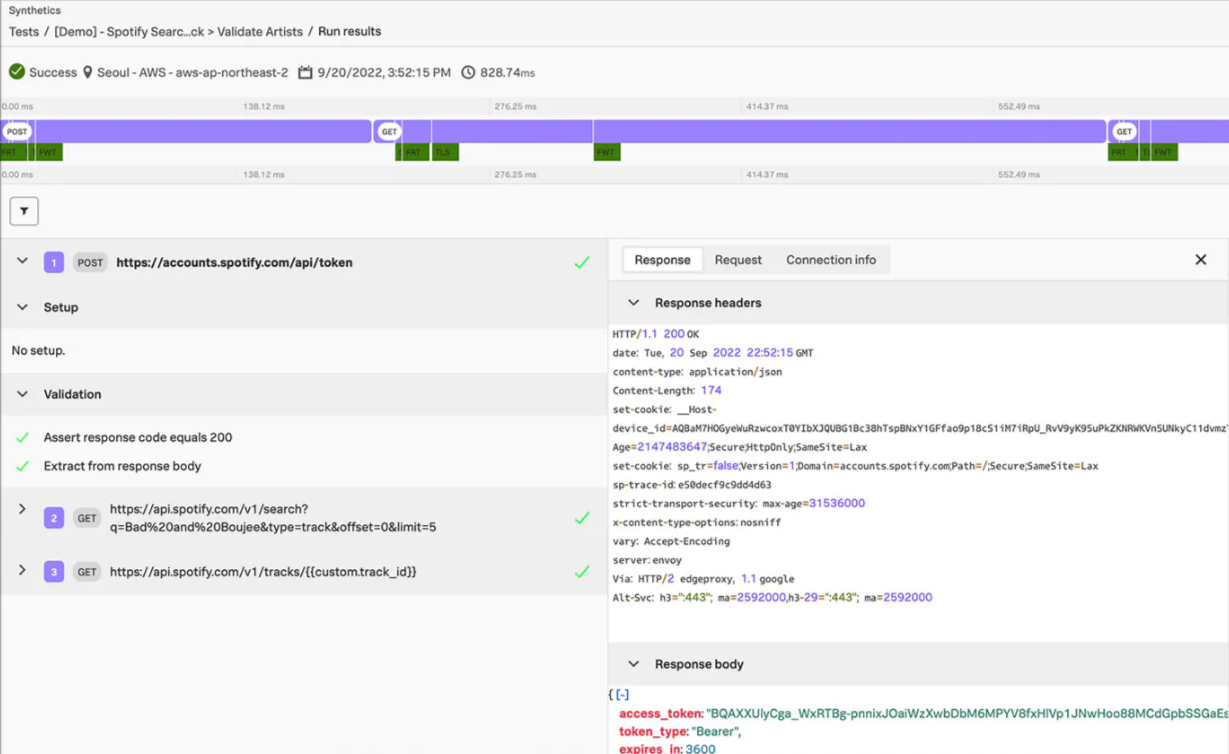
I can easily track and report uptime and performance, and compare my site's performance with competitors and industry standards to know where to improve. Creating dashboards to show SLAs for availability and performance, along with the alert history, is simple and straightforward.
Search Capability
Datadog
Datadog features a user-friendly query language that simplifies searches across logs, metrics, and traces. Its design focuses on ease of use, making real-time monitoring and data searches efficient. This capability is ideal for users who need quick access to information without complex query requirements.
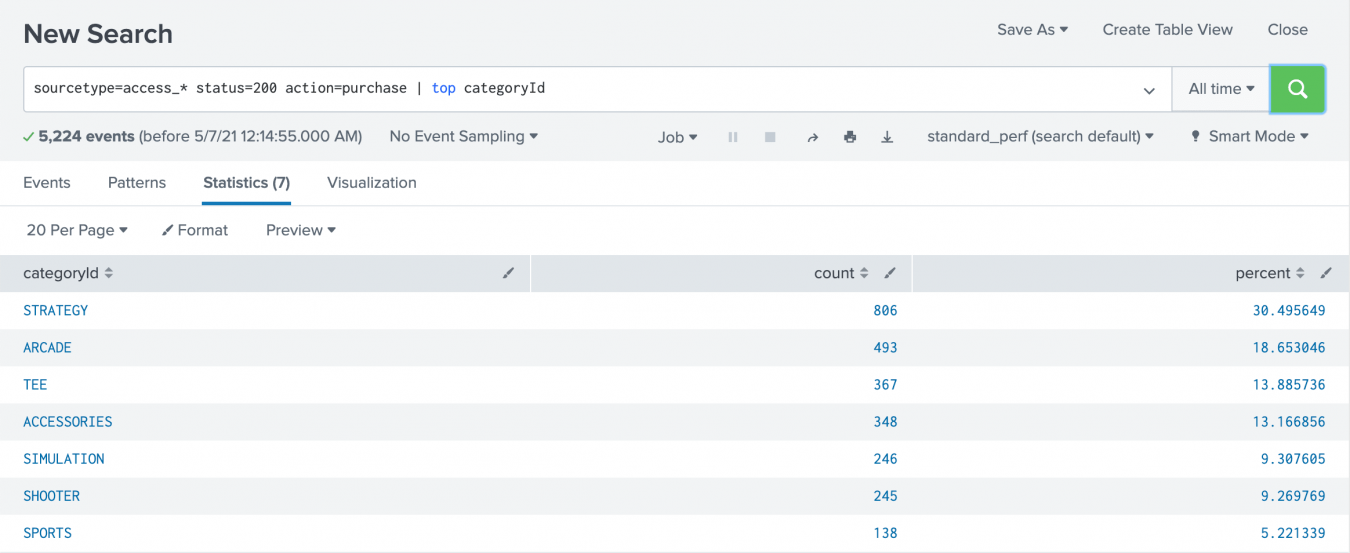
Splunk
Splunk uses a powerful Search Processing Language (SPL), which supports complex and detailed queries. It excels in handling large volumes of data and performing advanced data correlation across various sources. This makes Splunk suitable for in-depth analysis and extensive data exploration.
Datadog is better for easy and quick searches with a user-friendly interface. Splunk is better for handling large data volumes and complex queries.
Learning Curve
Datadog
Datadog is relatively easy to learn with its intuitive user interface and straightforward setup. The documentation is clear and helpful, making it accessible for beginners. Its integration and dashboard features are designed to be user-friendly.
Splunk
Splunk has a steeper learning curve due to its complex features and extensive configuration options. It often requires more time to master, especially for advanced functionalities. The documentation is comprehensive but can be overwhelming for new users.
User Interface and User Experience
Datadog
Datadog offers a clean and intuitive interface that's easy to navigate. The user experience is designed for quick access to metrics and insights, making it straightforward to set up dashboards and visualize data. It’s generally considered user-friendly, especially for new users.
Splunk
Splunk's interface is more complex due to its extensive features and customization options. While it provides powerful tools for in-depth analysis, the user experience often requires a steeper learning curve. The layout can be less intuitive, especially for those unfamiliar with its advanced functionalities.
Pricing
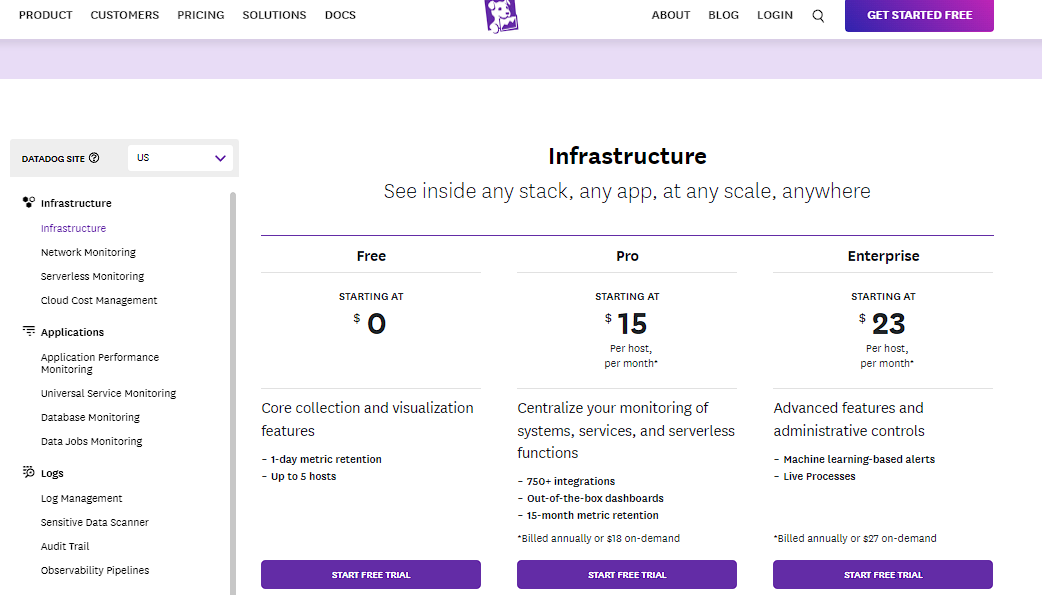
Datadog Pricing:
Datadog uses a decentralized pricing model, where each product has its own pricing structure. This setup can be complicated and may result in unexpected costs, as customers are billed monthly.
Splunk Pricing:
Splunk’s pricing can be quite complex and may become costly due to its handling of large-scale data. Users can start with a 15-day free trial to explore the platform. Exact prices are not published on their website, you will need to contact Splunk’s sales team to get detailed pricing information.
Datadog vs Splunk: Understanding the Best Use Cases
Datadog:
- Cloud Monitoring: Best for monitoring cloud infrastructure and services.
- Application Performance: Ideal for tracking and optimizing app performance.
- Unified Monitoring: Great for combining metrics, traces, and logs in one place.
- Automation: Excellent for automated alerts and dashboards for infrastructure.
Splunk:
- Log Management: Superior for handling large volumes of log data and detailed analysis.
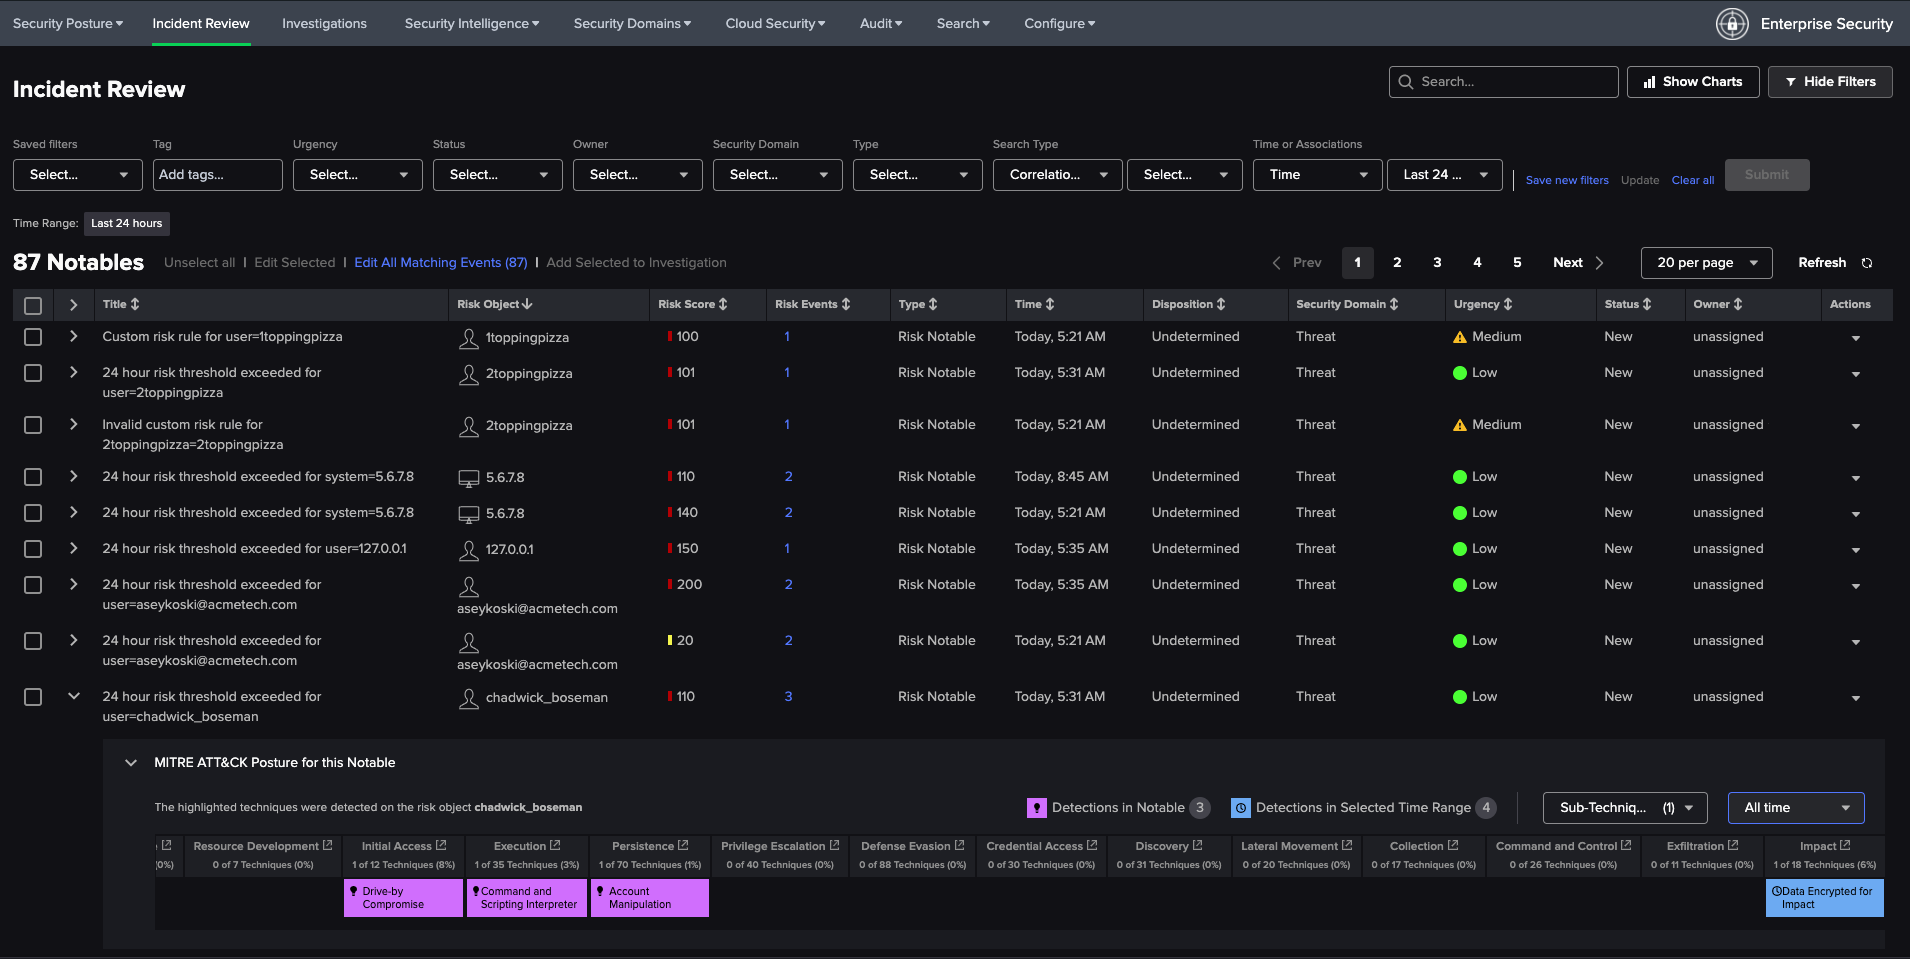
- SIEM: Preferred for advanced security analytics and incident response.
- Data Analytics: Powerful for in-depth data analysis and visualization across various data sources.
Atatus: A Better Alternative to Datadog and Splunk
Atatus is a full-stack observability and monitoring platform that provides comprehensive visibility into your application. It offers detailed insights into your logs, metrics, and traces, all in one place.
Why Atatus is a Better Alternative to Datadog and Splunk?
- Atatus offers advanced APM to identify endpoint failures and monitor performance in real-time, delivering deep insights into transactions, slow queries, and network calls.
- With flexible log management and an integrated UI, Atatus enables seamless log correlation with APM traces and errors, providing a comprehensive view of performance.
- Atatus provides in-depth API analytics and built-in vulnerability management, offering detailed performance insights and security risk identification in one solution.
- Enjoy highly customizable dashboards and alerts tailored to your team's needs, offering more flexibility than Datadog and Splunk.
- Atatus features straightforward pricing with no hidden fees, charging only for the hosts you monitor, unlike Datadog’s and Splunk’s complex and potentially costly models.
If you are not yet an Atatus customer, you can sign up for a 14-day free trial.
#1 Solution for Logs, Traces & Metrics
![]() APM
APM
![]() Kubernetes
Kubernetes
![]() Logs
Logs
![]() Synthetics
Synthetics
![]() RUM
RUM
![]() Serverless
Serverless
![]() Security
Security
![]() More
More


![New Relic vs Splunk - In-depth Comparison [2026]](/blog/content/images/size/w960/2024/10/Datadog-vs-sentry--19-.png)