Datadog vs Dynatrace - A Detailed Comparison
Datadog and Dynatrace are comprehensive monitoring tools that help businesses keep track of their infrastructure, applications, and overall system performance. They offer a variety of products and services for monitoring.
In this blog post, I have compared Datadog and Dynatrace based on several crucial features such as infrastructure monitoring, log management, Application Performance Monitoring (APM), and more.
This comparison aims to provide details into how each tool performs in these areas, helping you make an informed decision about which monitoring solution best meets your needs.
Table of Contents
- Datadog vs Dynatrace: Overview
- Exploring their Range of Products
- Agent Installation
- Infrastructure Monitoring
- Application Performance Monitoring
- Log Management
- Ease of Use and User Interface
- Documentation
- Pricing
- Datadog vs Dynatrace: The Final Verdict
- Atatus: A Cost-Effective Alternative to Datadog and Dynatrace
Datadog vs Dynatrace: Overview
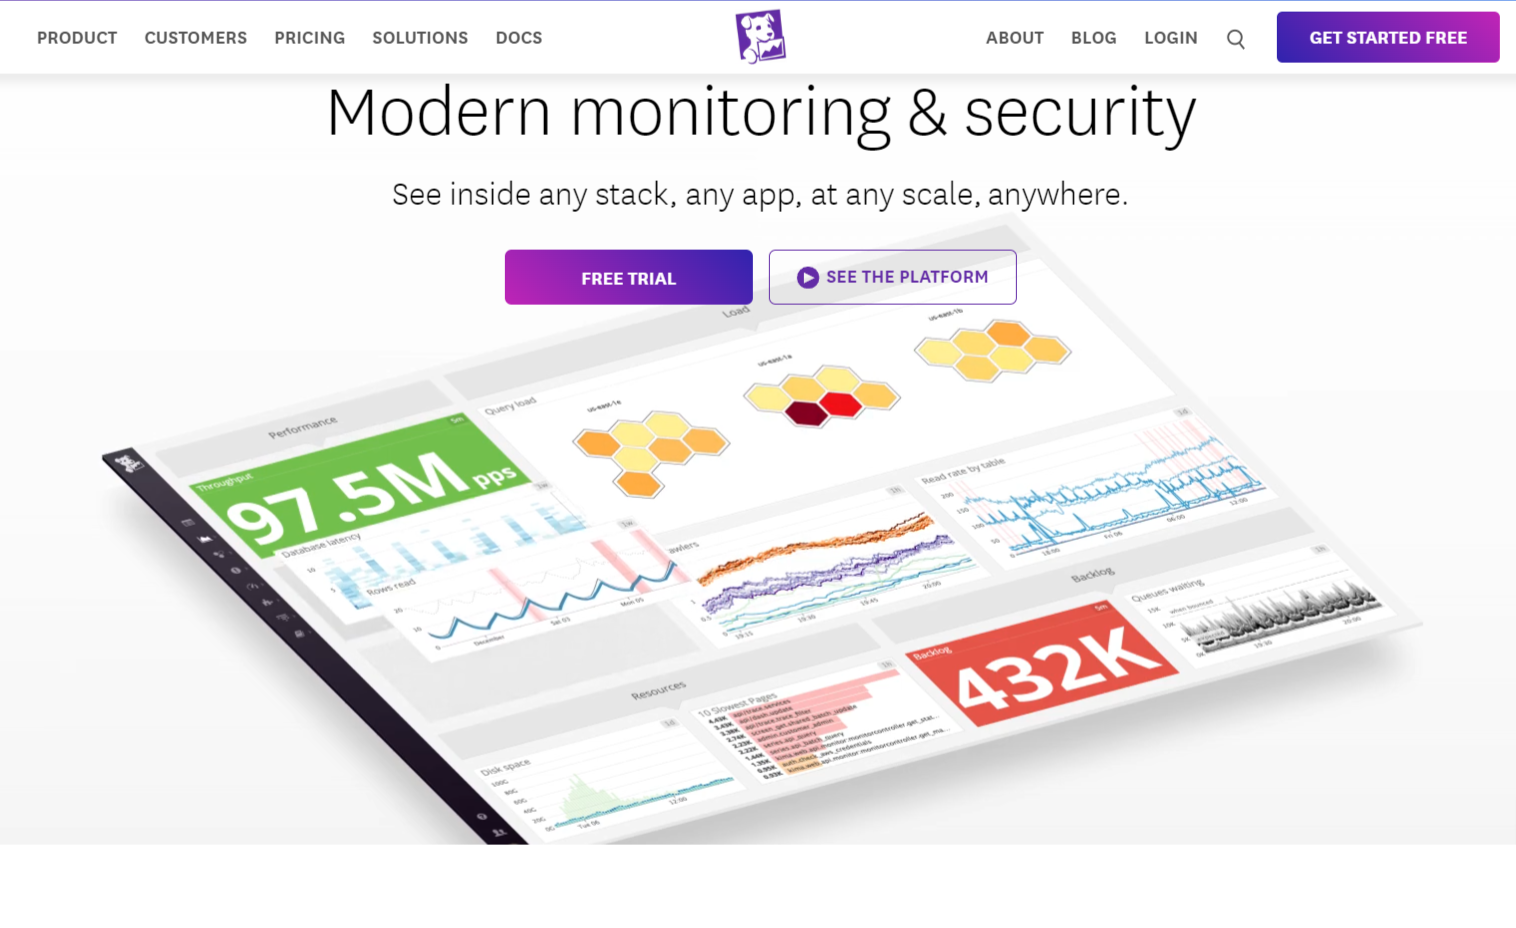
Datadog is a powerful observability platform designed to help organizations monitor and analyse the performance and health of their applications and infrastructure. It enables the collection, visualization, and analysis of data from various sources, including servers, databases, applications, and services.
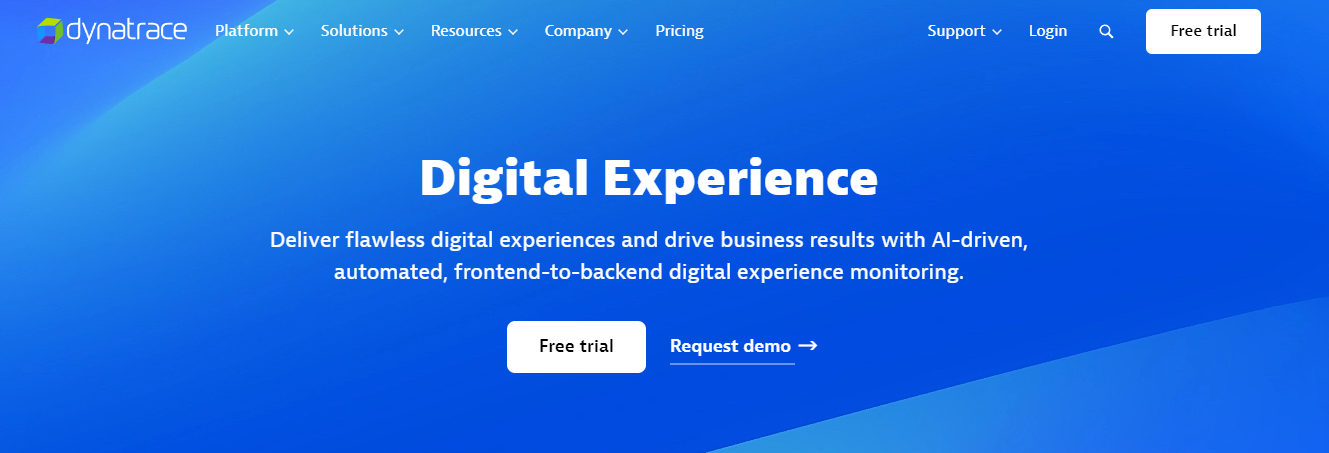
Similarly, Dynatrace is a comprehensive observability platform designed to simplify the complexity of cloud environments. It combines deep observability, artificial intelligence (AI), automation, and application security into a single, powerful, and open platform.
Exploring their Range of Products
| Features | Datadog | Dynatrace |
|---|---|---|
| Infrastructure Monitoring | ✅ | ✅ |
| APM | ✅ | ✅ |
| RUM | ✅ | ✅ |
| Log Monitoring | ✅ | ✅ |
| SLA Monitoring | ✅ | ✅ |
| OpenTelemetry Support | ✅(Limited) | ✅ |
| Application Security Monitoring | ✅ | ✅ | Cloud SIEM | ✅ | ✅(Limited) |
| Access Control | ✅ | ✅ |
| Incident Management | ✅ | ❌ |
| Cloud Security Monitoring | ✅ | ✅(Limited) |
| UI/UX | ✅(Good) | ✅ |
| Budget-friendly for Startups | ❌ | ❌ |
✅ - Available ❌ - Not Available
Agent Installation
Datadog
The Datadog Agent is a software application installed on your servers. It gathers events and metrics from these servers and sends the data to Datadog for analysis. The Agent is open-source, and you can find its code on GitHub DataDog/datadog-agent.
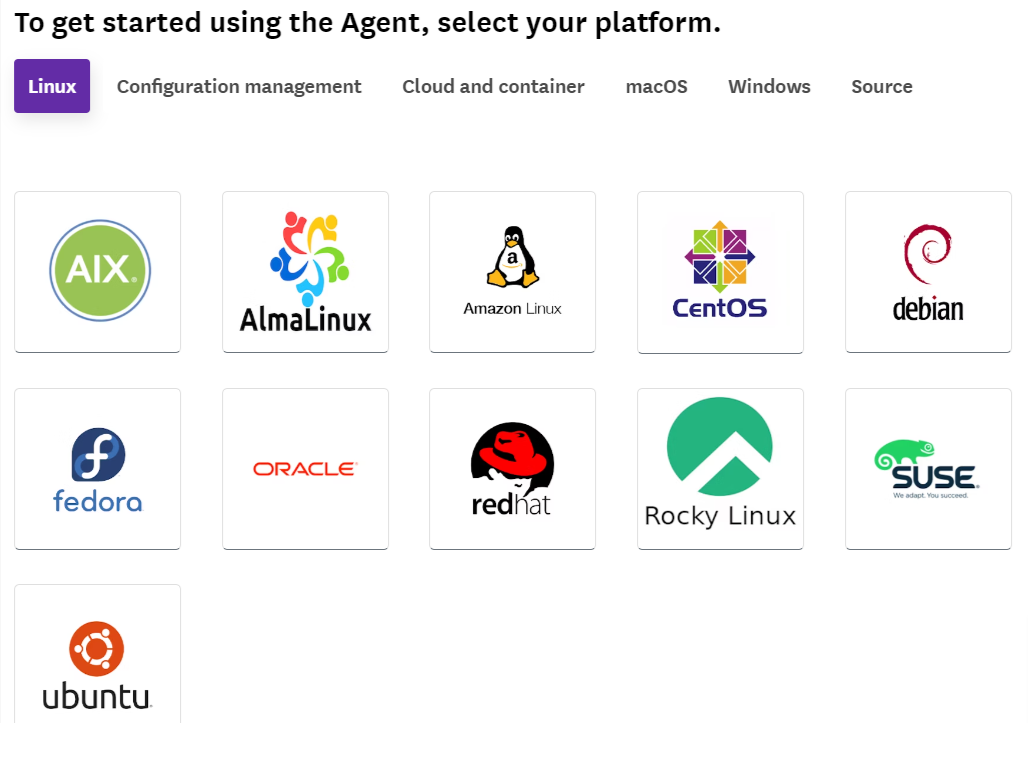
To install the Datadog Agent, the process begins by selecting the appropriate platform on the agent installation page. After the platform is chosen, a command is provided to install the Agent, which downloads and installs the required packages.
Once the installation is complete, the Datadog Agent starts running on the machine. Initially, it only provides infrastructure metrics, and monitoring application metrics requires installing a separate agent.
Dynatrace
Similarly, Dynatrace utilizes OneAgent to perform comprehensive monitoring of your infrastructure and the services running on it.
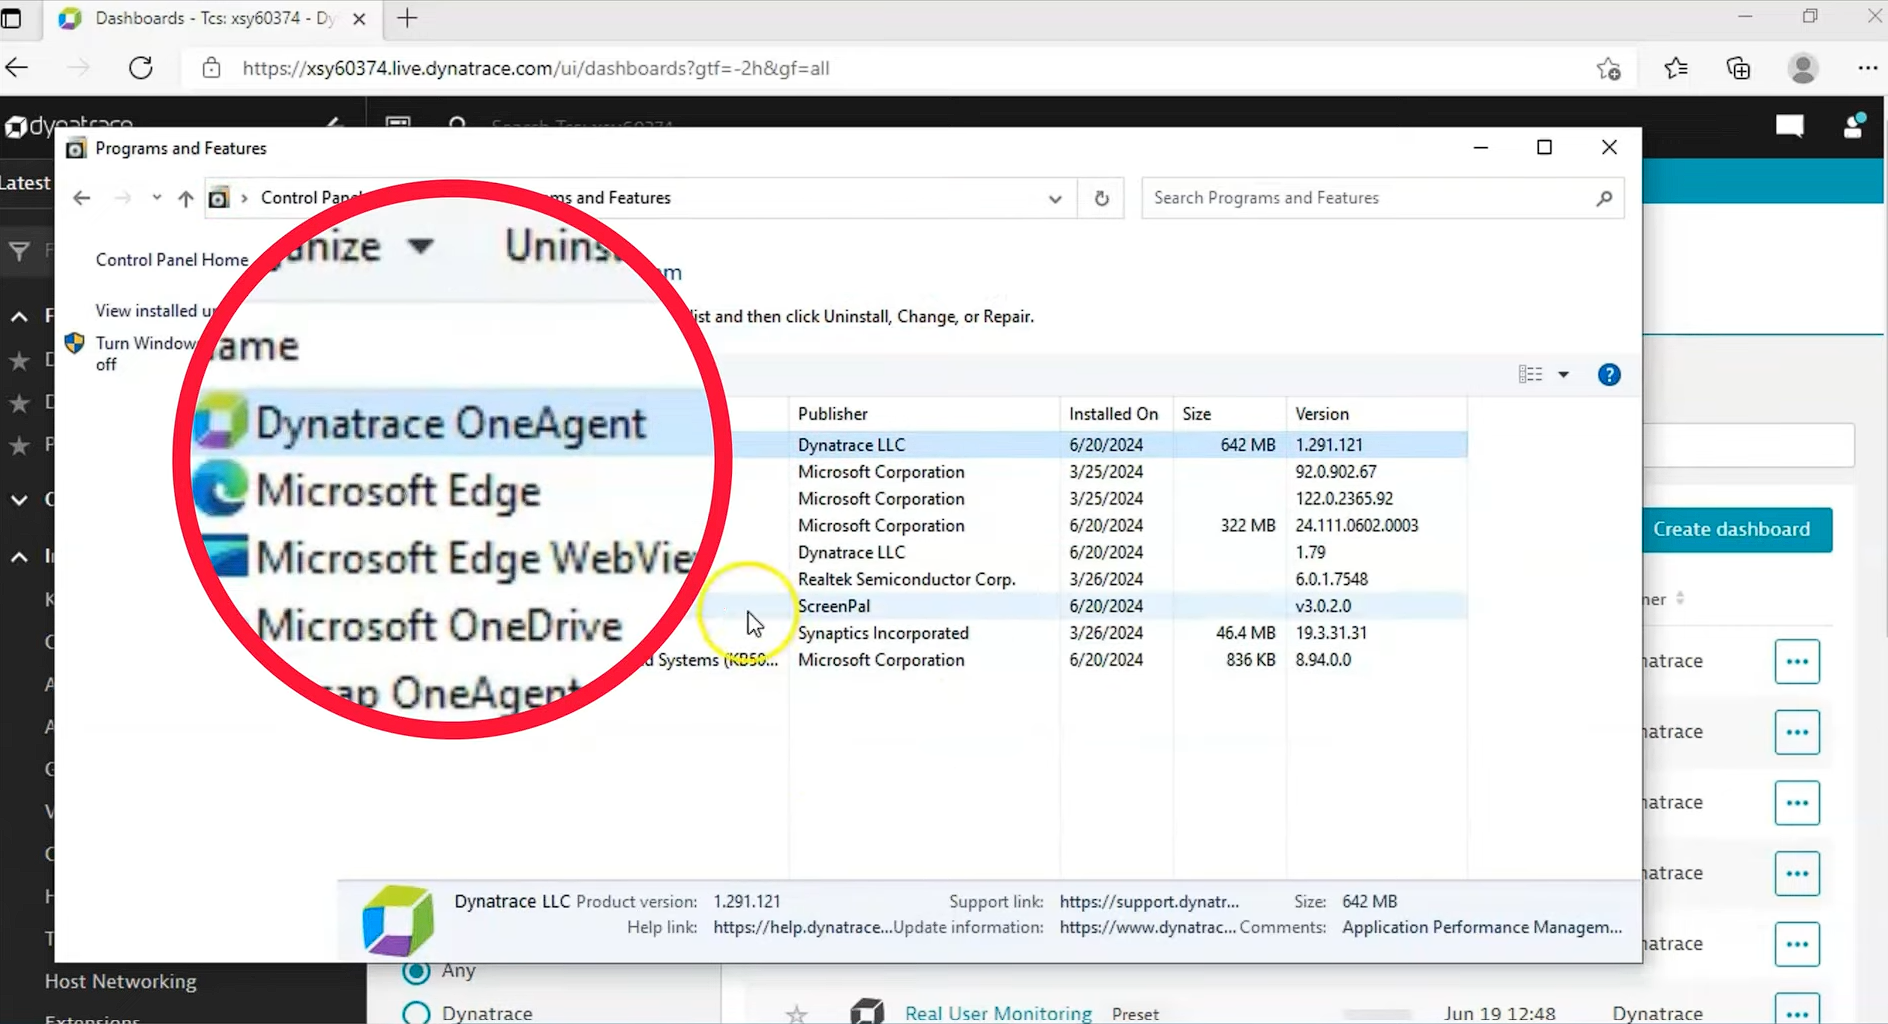
Setting up Dynatrace's OneAgent involves a more complex process compared to Datadog's straightforward installation. It requires executing multiple code snippets for deployment, adding more complexity to the setup compared to Datadog.
Once installed, unlike Datadog, the Dynatrace Agent automatically started reporting on logs, infrastructure metrics, and application metrics without requiring any additional installations at that time.
Infrastructure Monitoring
Datadog
When using Datadog, configuring files manually is necessary after installing its agent using a command from its UI. Once the agent is installed, it automatically starts monitoring the infrastructure.
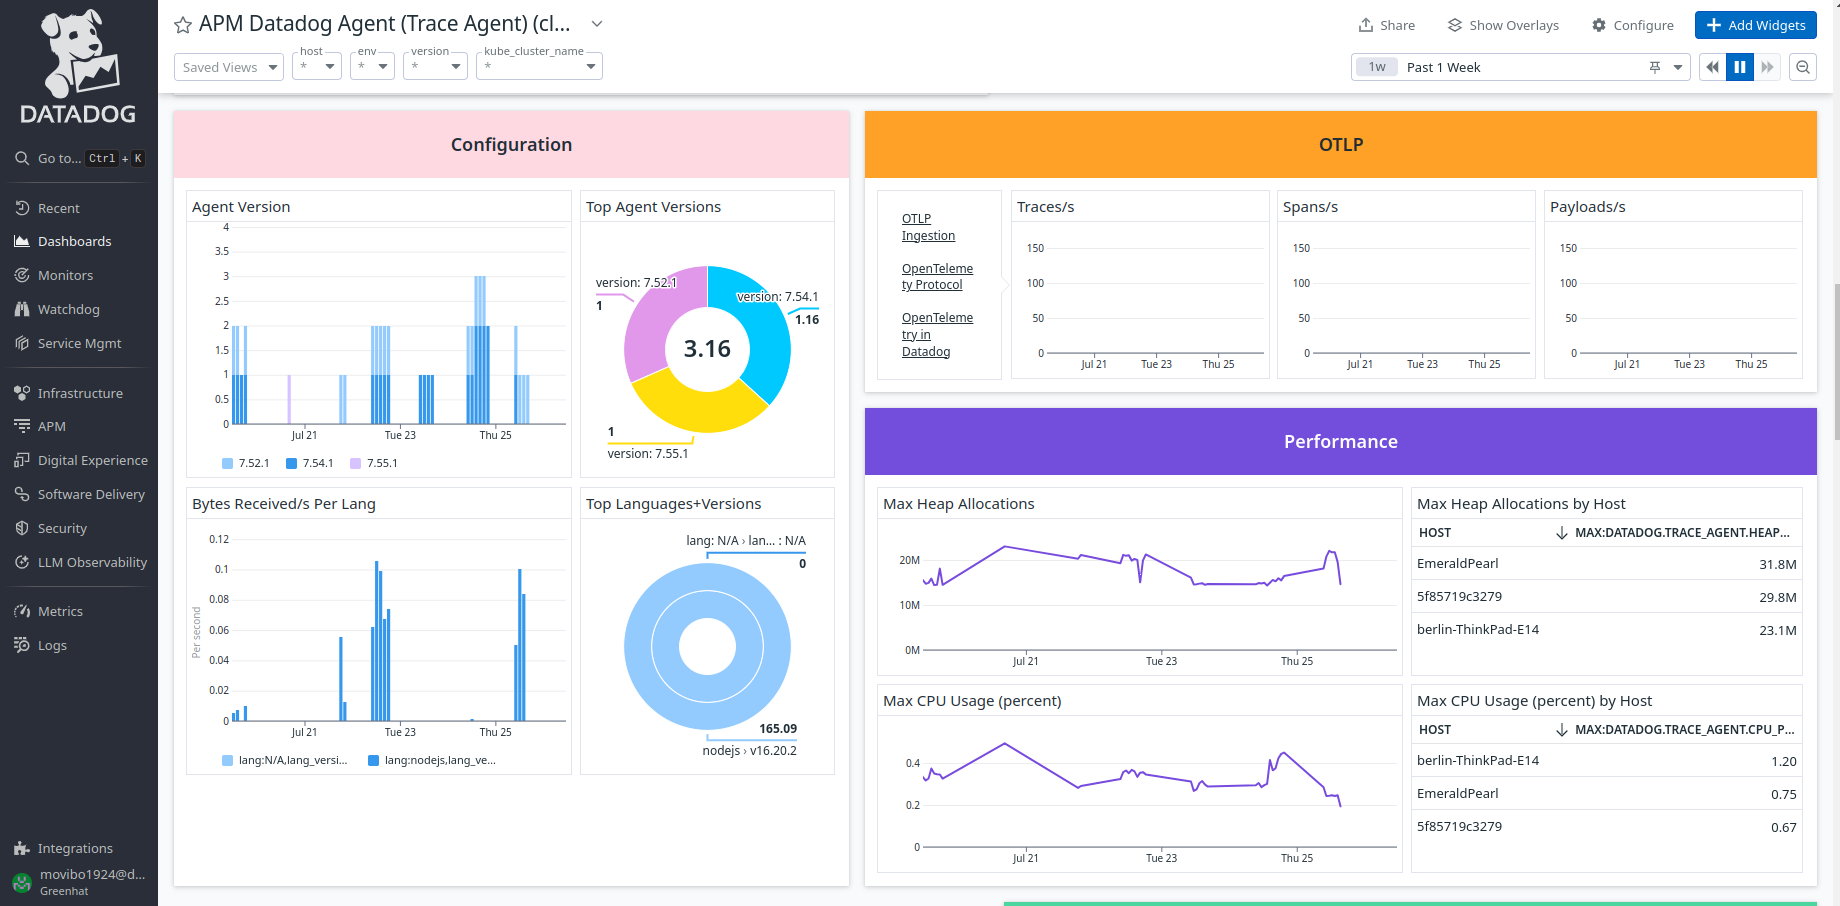
The dashboard is very user-friendly, allowing all metrics and logs to be viewed in one place and customized to prioritize what's most important. However, to check application performance metrics, switching to a separate tab is required. All machines can be easily found listed in the infrastructure section. Each machine includes specific tags and metrics attached to it.
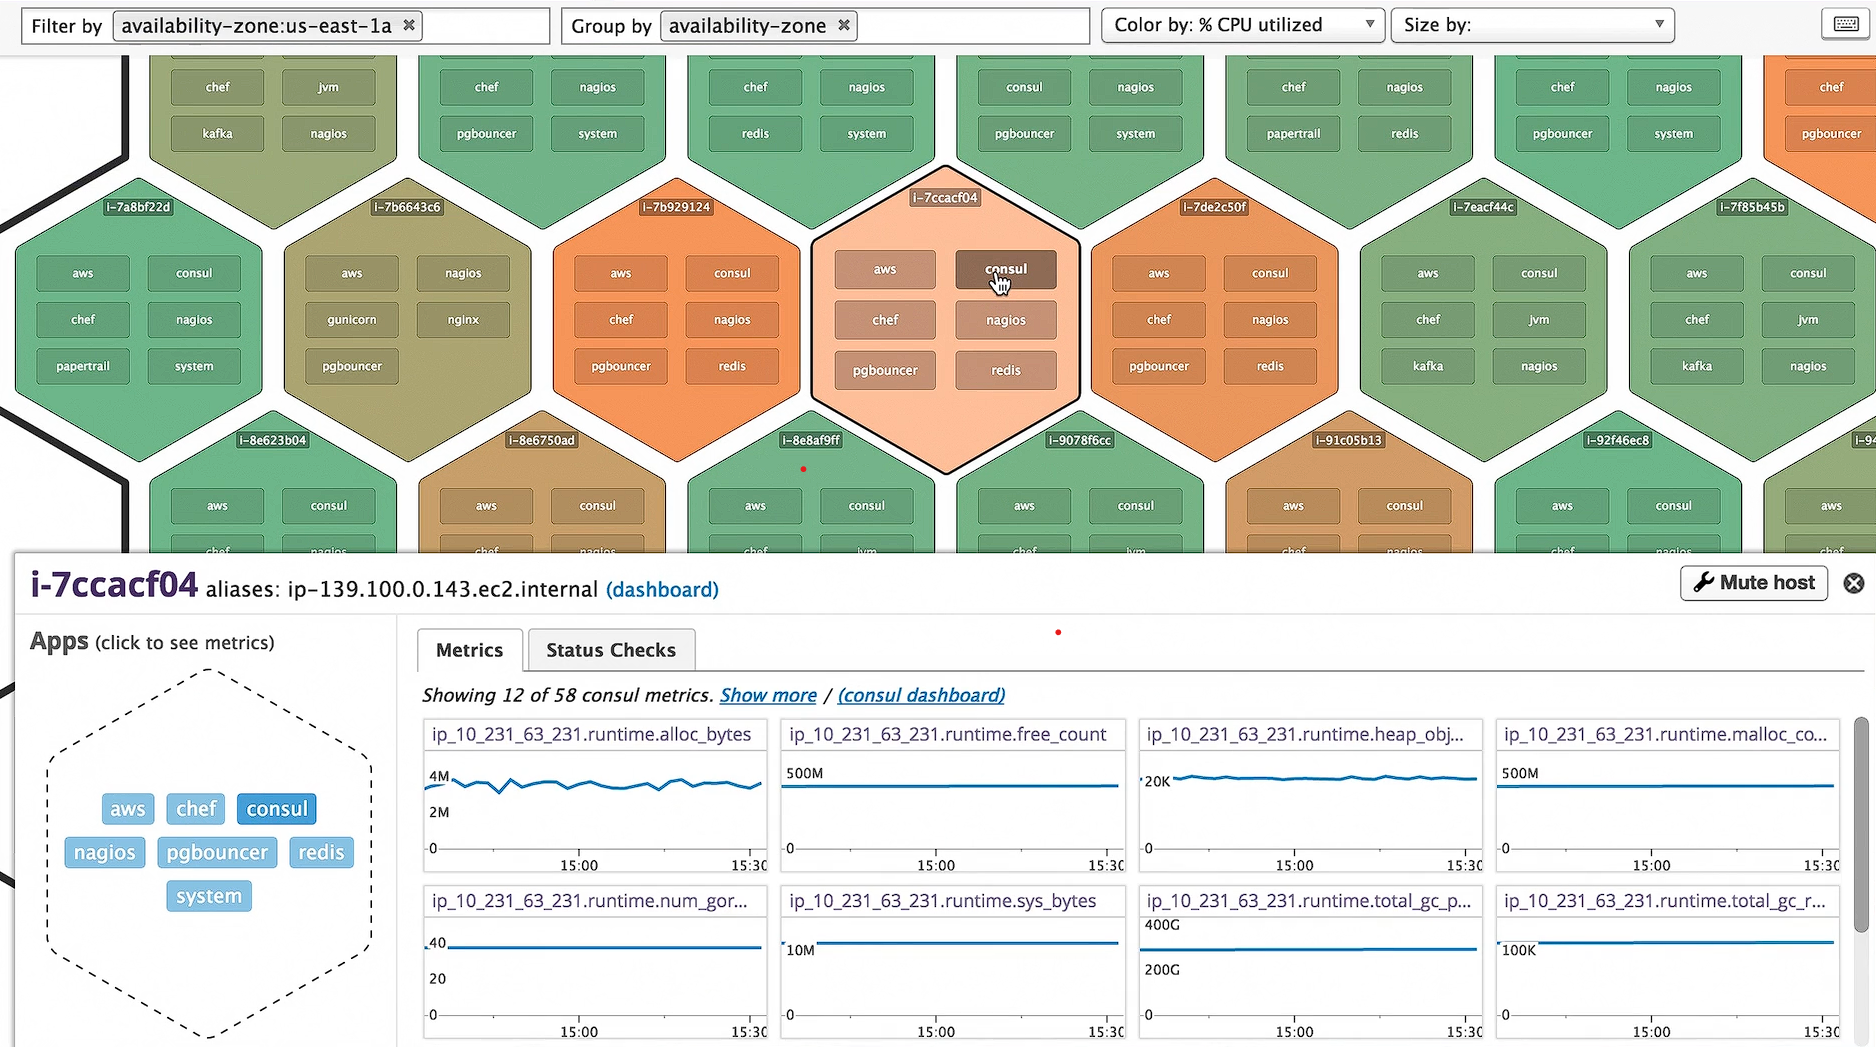
The Host map feature offers a visual display of all hosts on one screen, grouped and filtered as needed, using colour and shape to make metrics clear. This level of visualization is useful for identifying outliers, tracking usage patterns, preventing resource issues, and optimizing infrastructure management. This feature is particularly useful for monitoring the overall health and connectivity of your infrastructure in real-time.
Dynatrace
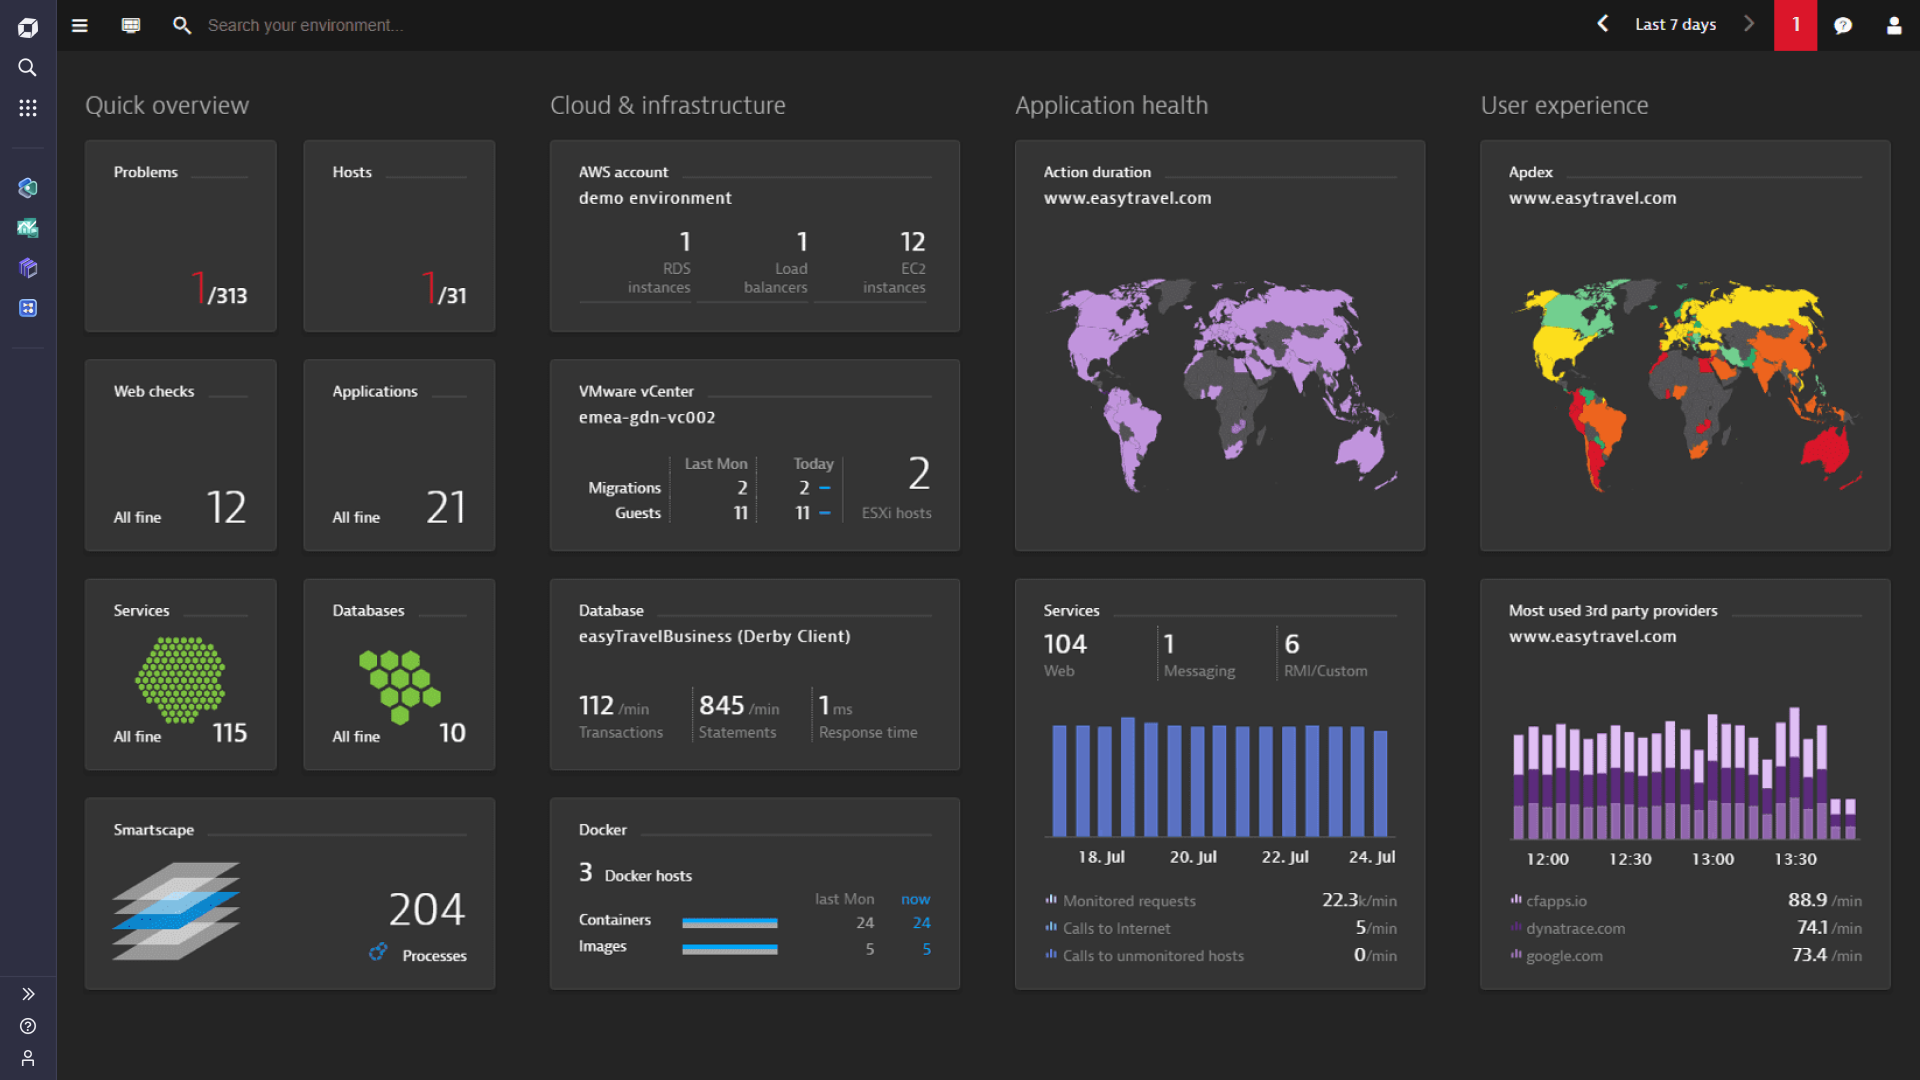
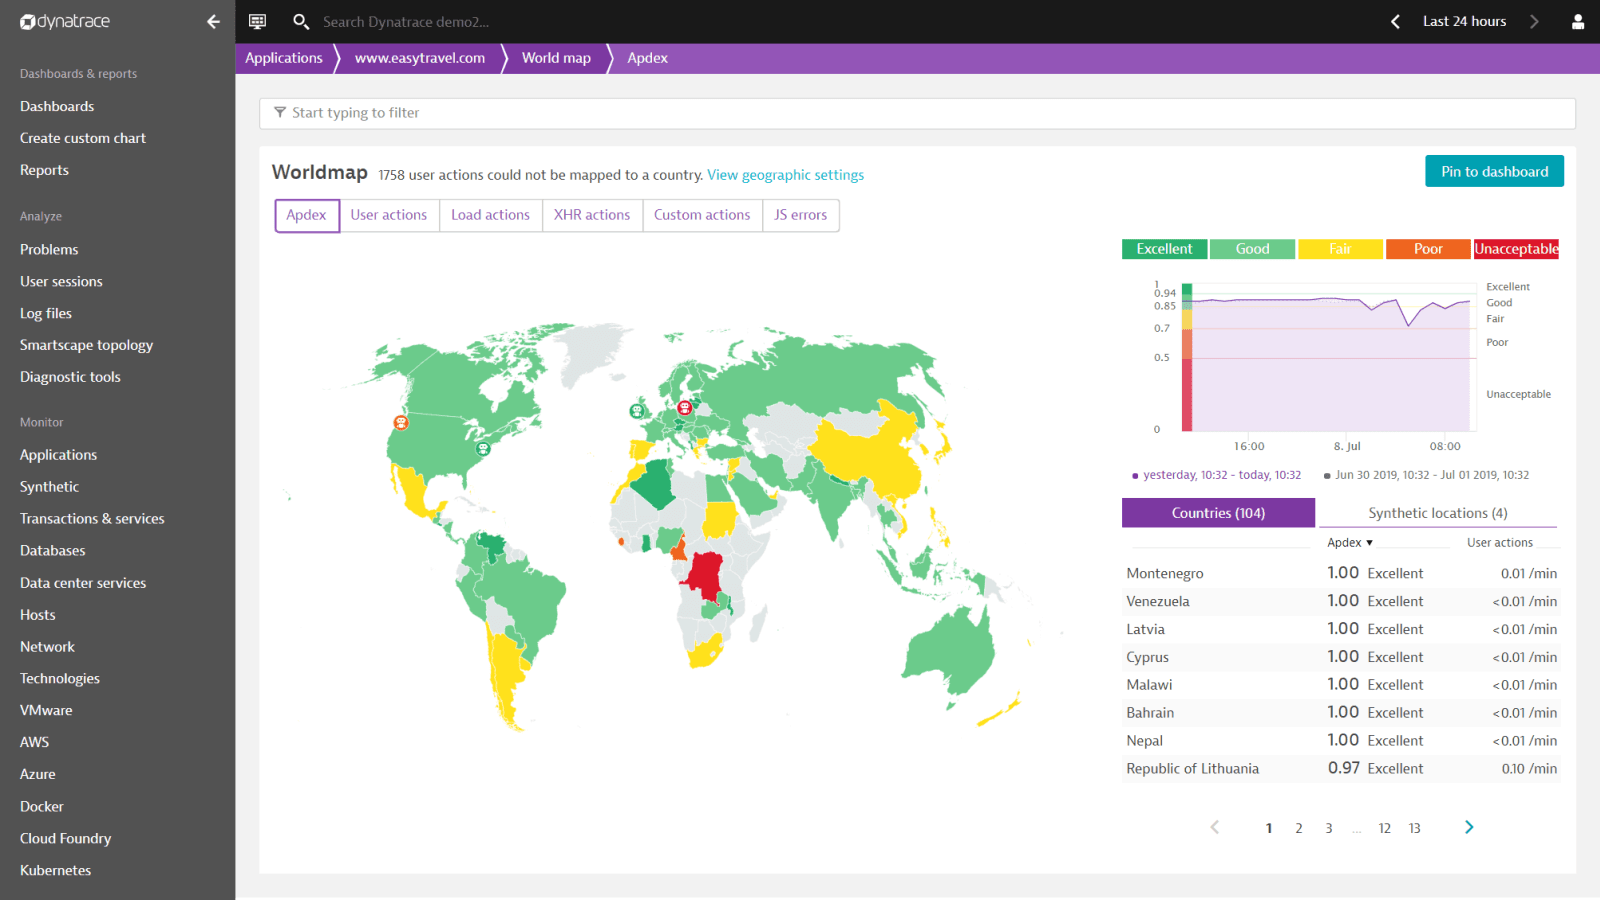
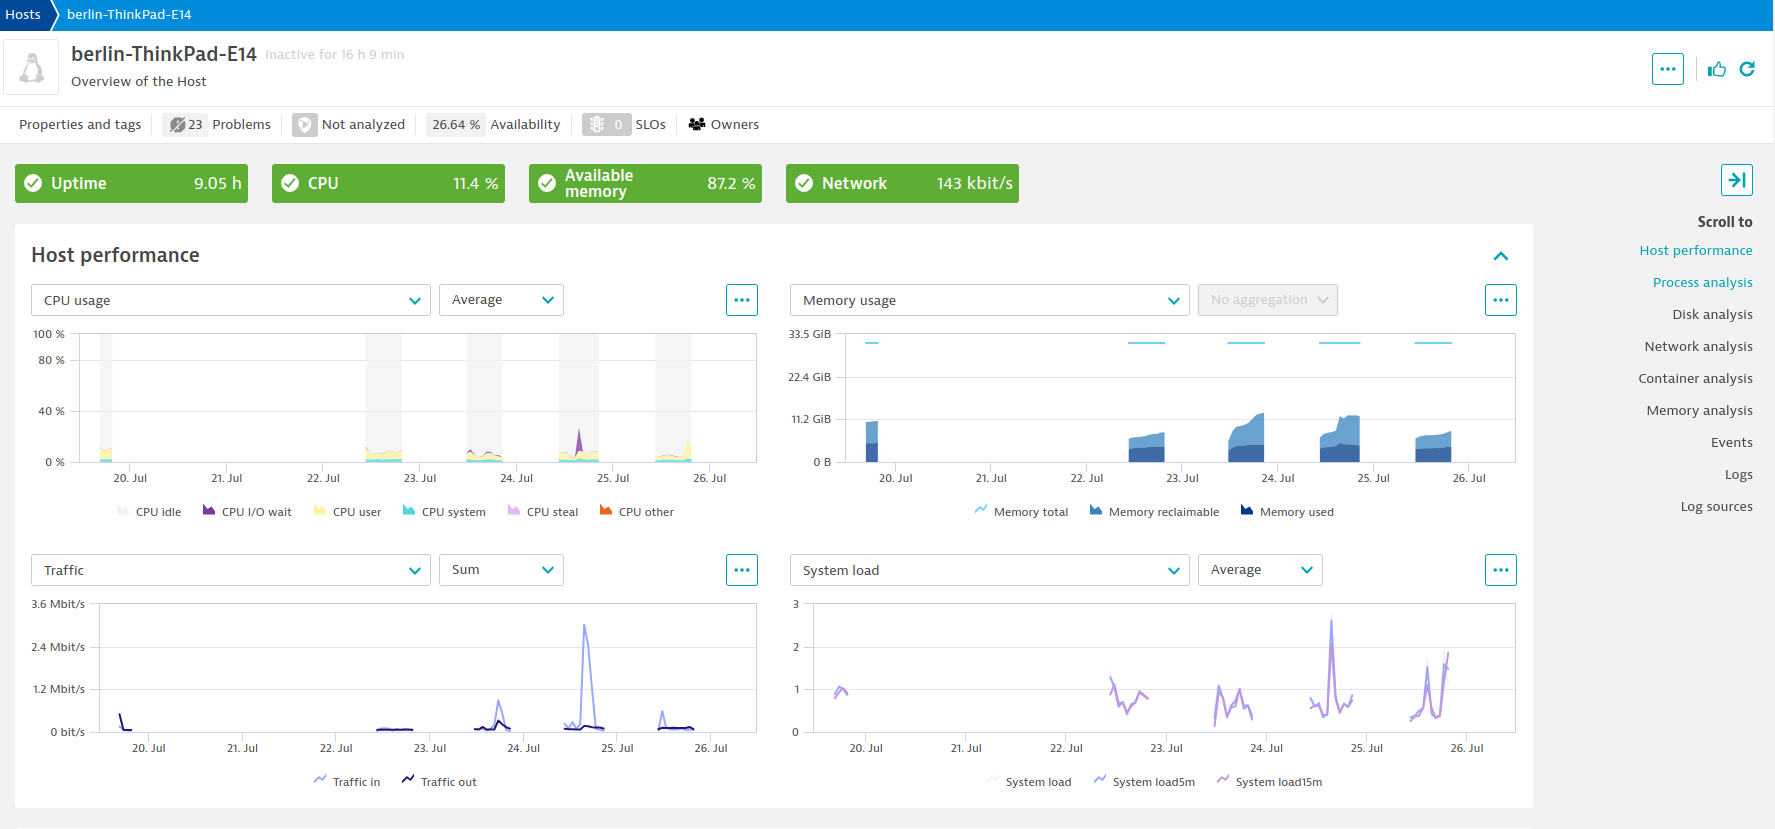
On the other hand, Dynatrace simplifies things significantly. Its OneAgent starts collecting data automatically across the setup right after installation. It provides a comprehensive view of the infrastructure performance, including incoming and outgoing connections, host performance, process analysis, disk usage, and more.
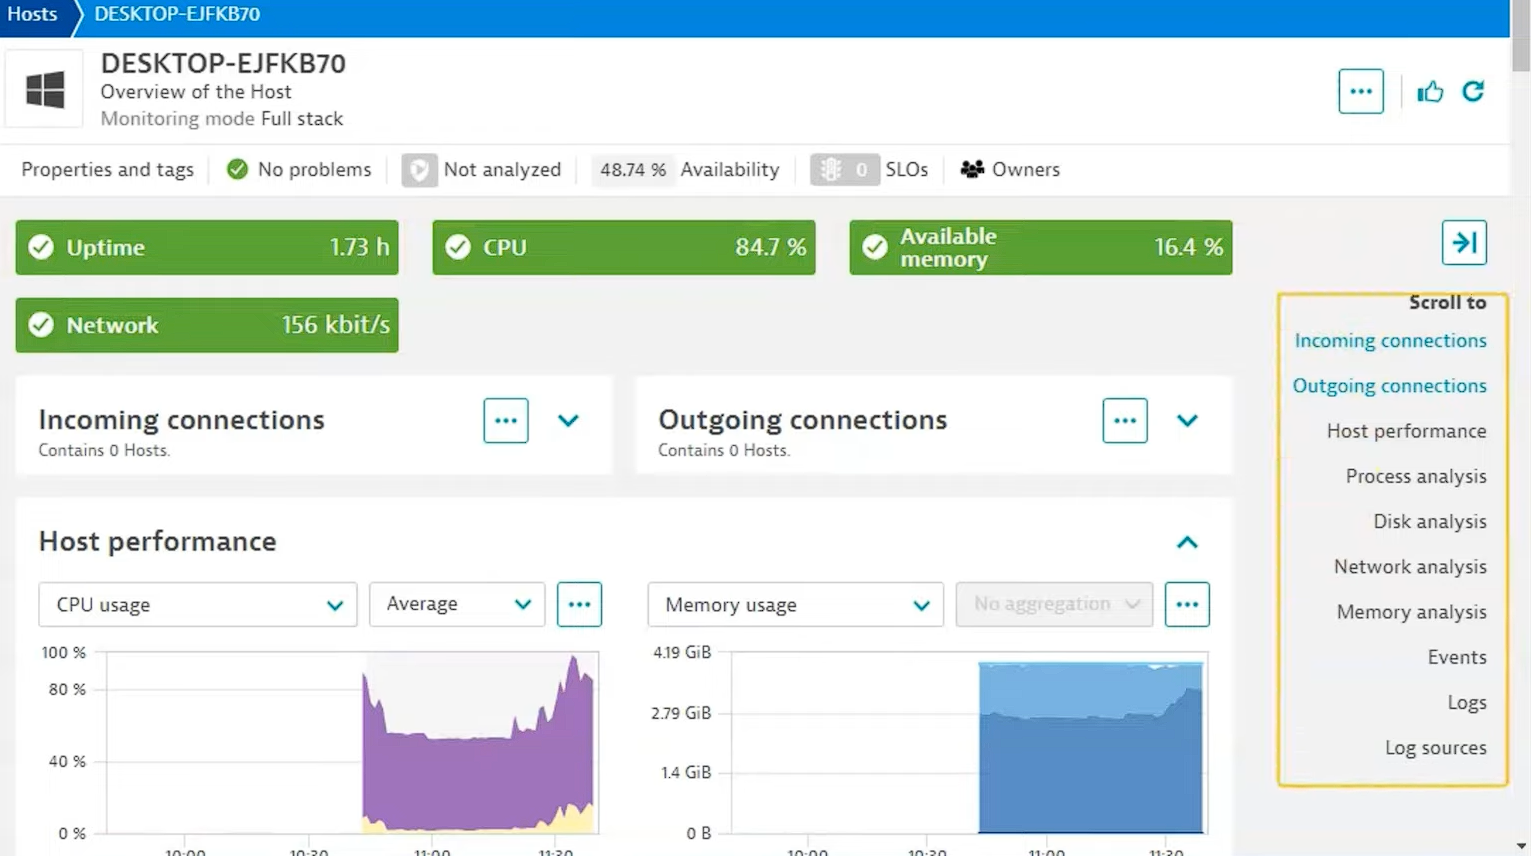
The dashboard consolidates all metrics in one place, giving a comprehensive view of the system's performance without needing to jump around different screens.
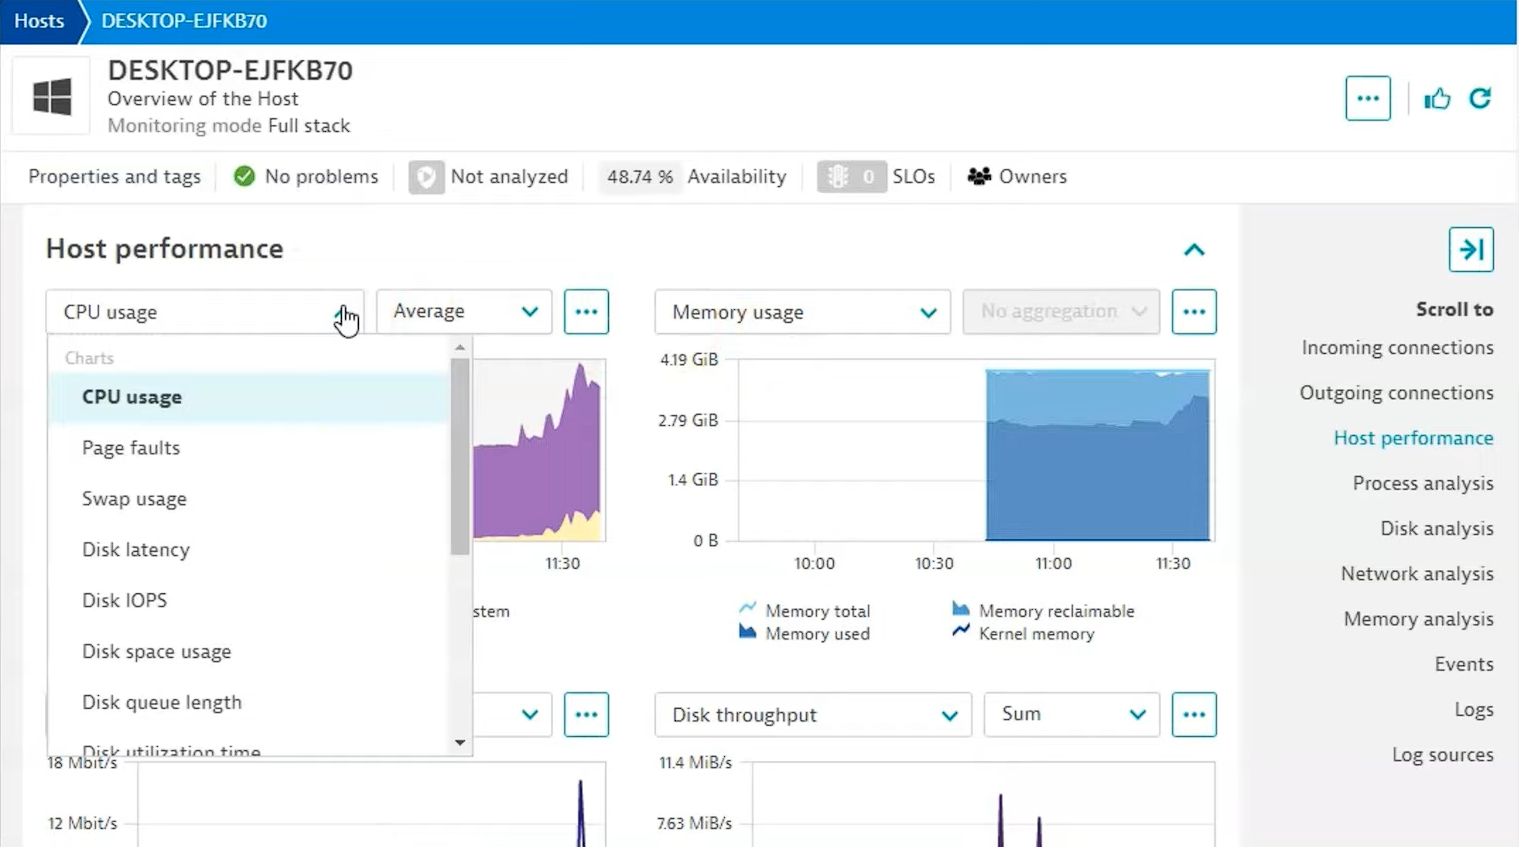
The Host performance analysis provides detailed information on CPU usage, memory usage, traffic, and disk throughput. Depending on needs, additional information such as swap usage, disk latency, and disk space usage can also be accessed. This level of detail is invaluable for monitoring the system's performance.
When it comes to infrastructure monitoring, both Datadog and Dynatrace is good. Choosing between Datadog and Dynatrace often comes down to personal preference.
Application Performance Monitoring
Datadog
Setting up APM in Datadog requires installing an application-specific agent along with a programming language-specific agent. With Datadog APM, end-to-end application monitoring is provided from browsers all the way down to individual database queries and code profiles.
Datadog has a separate tab for APM, and once the setup is complete, a list of spans and their corresponding flame graphs for traces can be viewed.
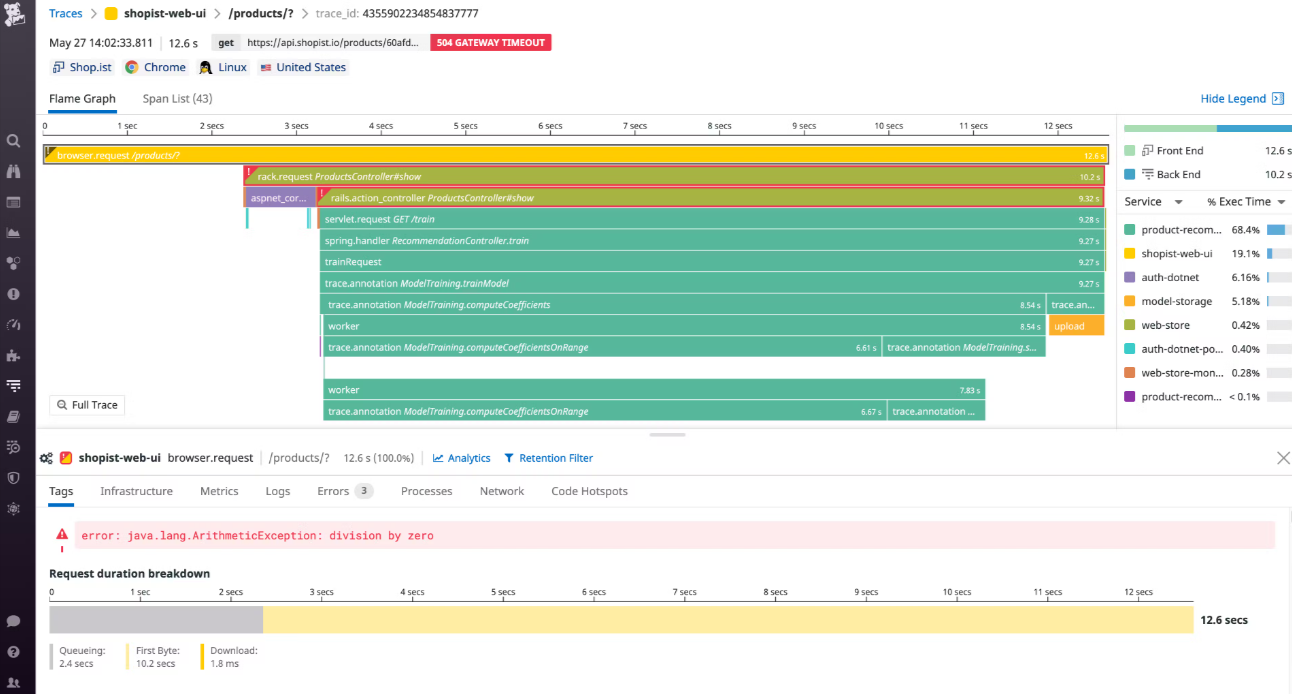
This flame graph visualizes a request that timed out due to backend errors. Each trace captures the end-to-end lifespan of a request, allowing bottlenecks or errors in monolithic or microservice architectures to be found within seconds.
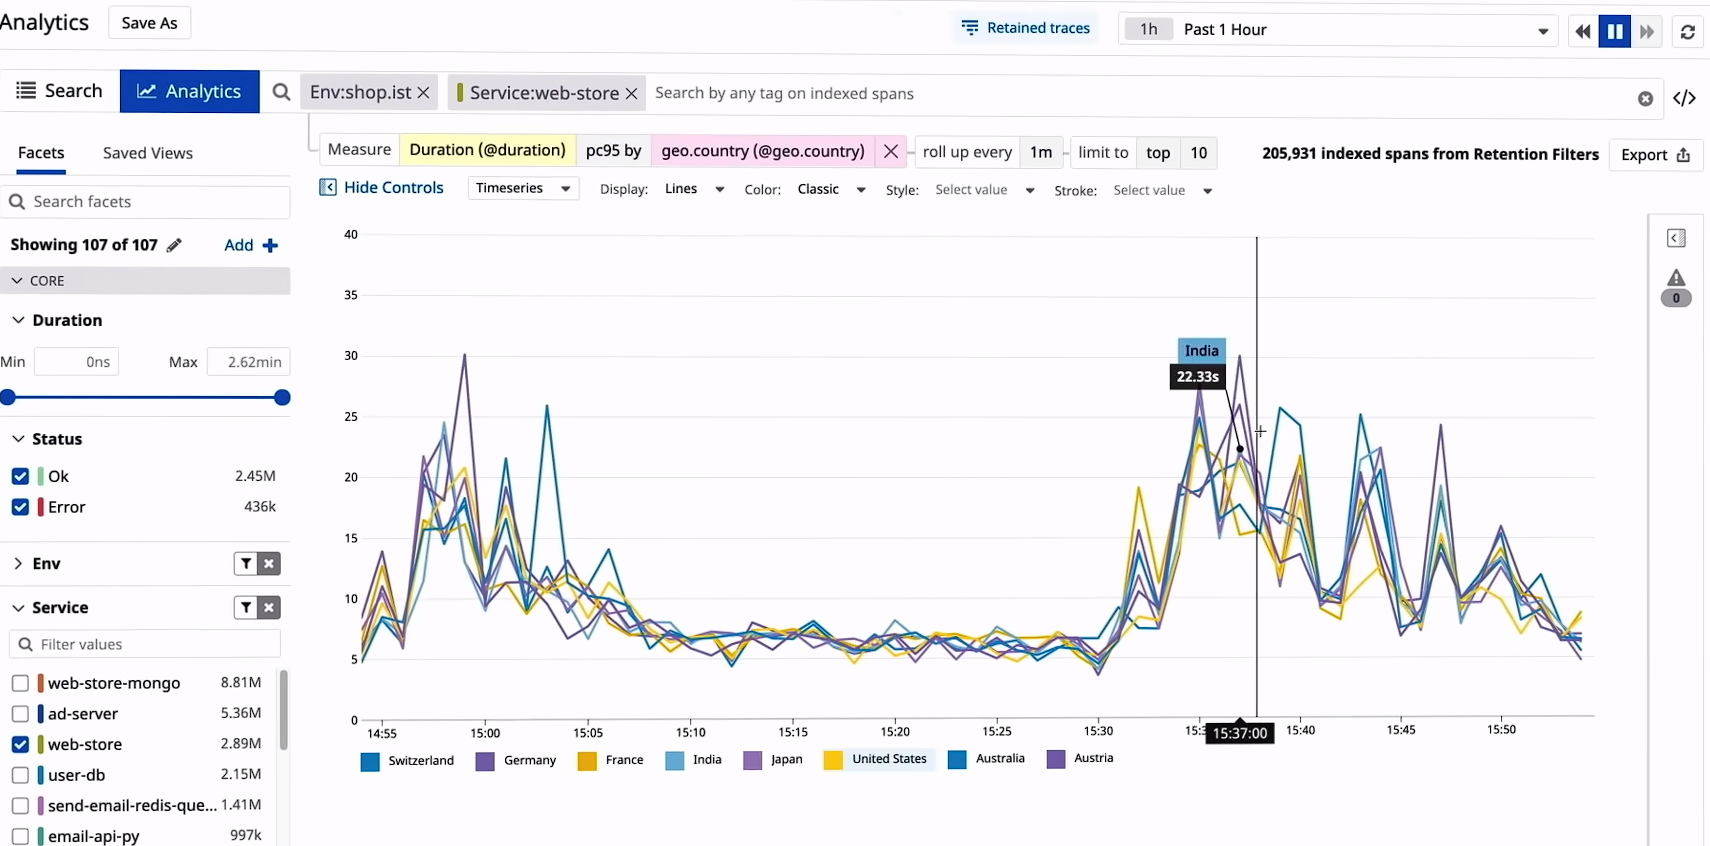
Application performance can be analysed in detail, identifying customers, pages, endpoints, countries, cloud providers, or any other tags that are experiencing the slowest responses.
Dynatrace
Setting up Application Performance Monitoring (APM) in Dynatrace can be a bit confusing as the APM feature is not immediately visible within the user interface. Navigating through the UI to find the necessary options can be challenging.
Dynatrace offers two methods for instrumentation: using the OneAgent module or employing OpenTelemetry. It provides comprehensive end-to-end visibility into the entire application stack. This enables the analysis of application performance throughout the full stack, down to individual transactions, across all layers and technologies.
The platform uses metrics from real users and synthetic monitoring to proactively monitor web and mobile apps. It tracks every customer journey from start to finish.
Considering the ease of setup and simplicity of Datadog, it stands out as the preferred option. However, if a powerful, AI-driven platform that provides real-time insights into application performance is needed, then Dynatrace is the better choice.
Log Management
Datadog
By default, the log exporter is disabled in the Datadog Agent. It must be manually enabled by setting logs_enabled to true in the datadog.yaml file and then restarting the Datadog Agent. The Datadog documentation provides the necessary steps to follow.
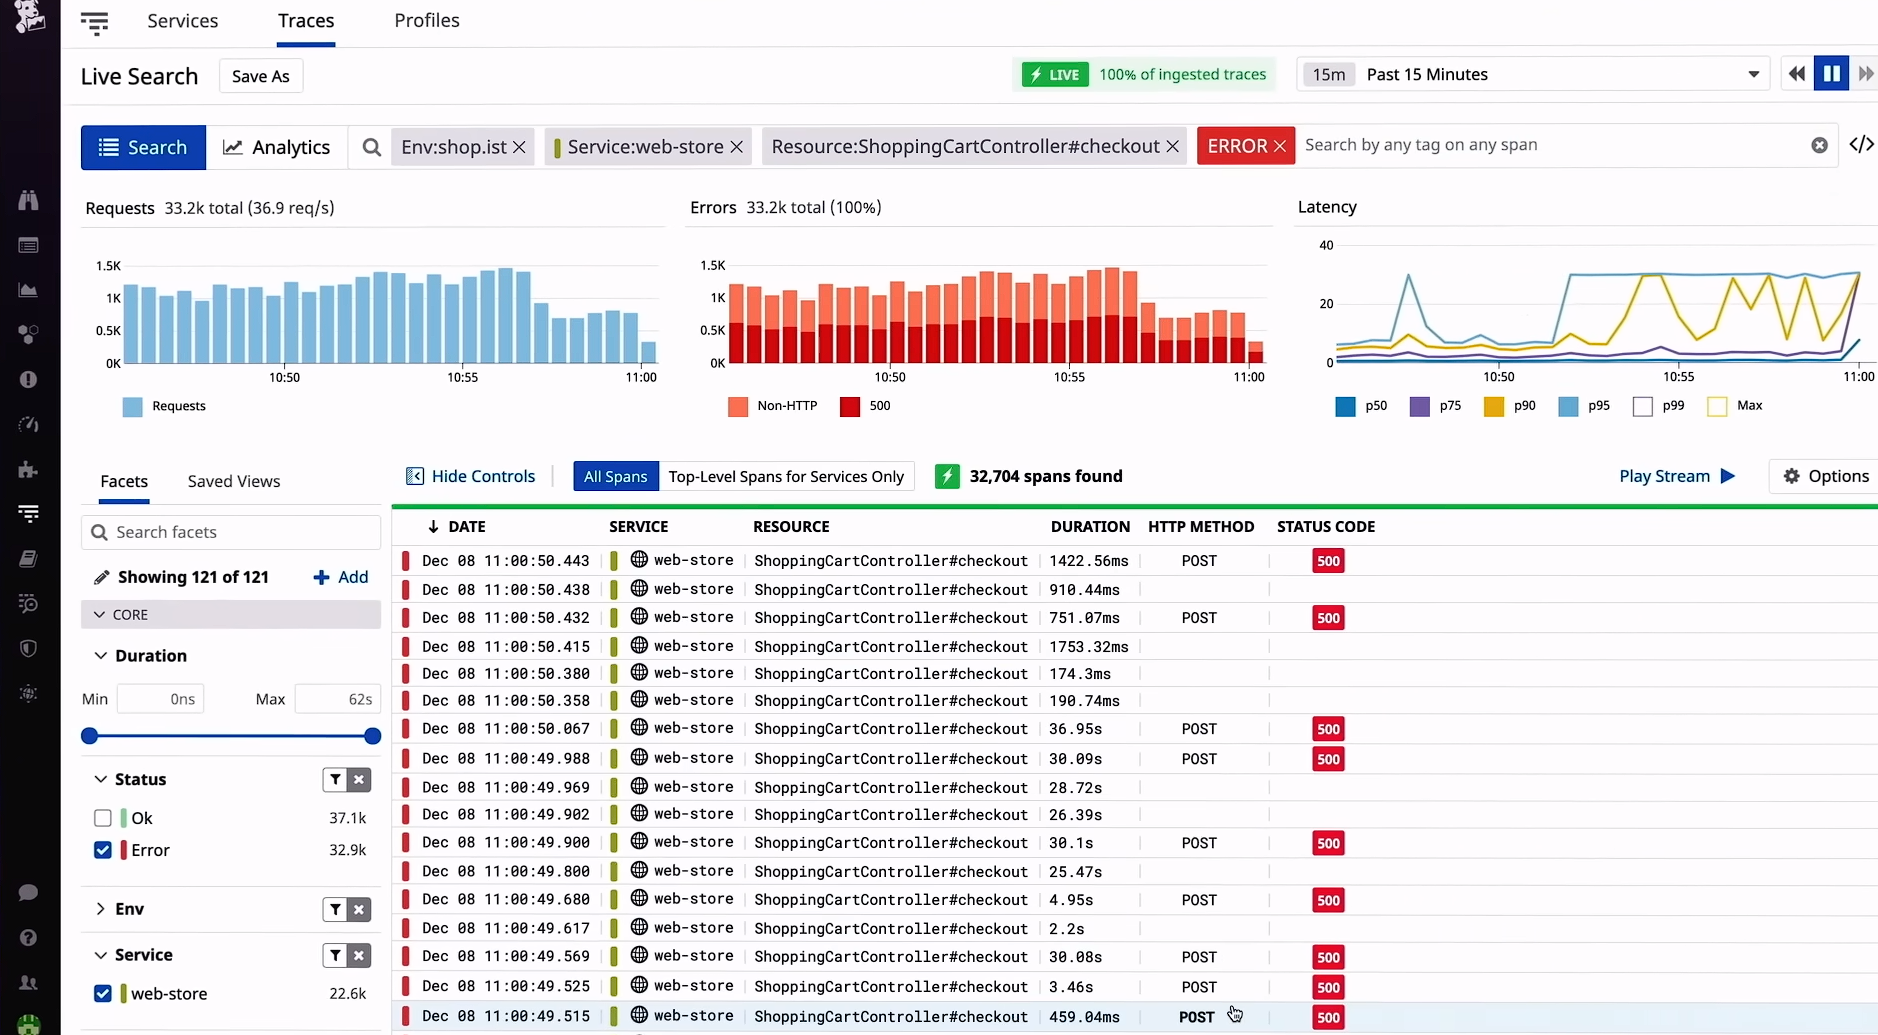
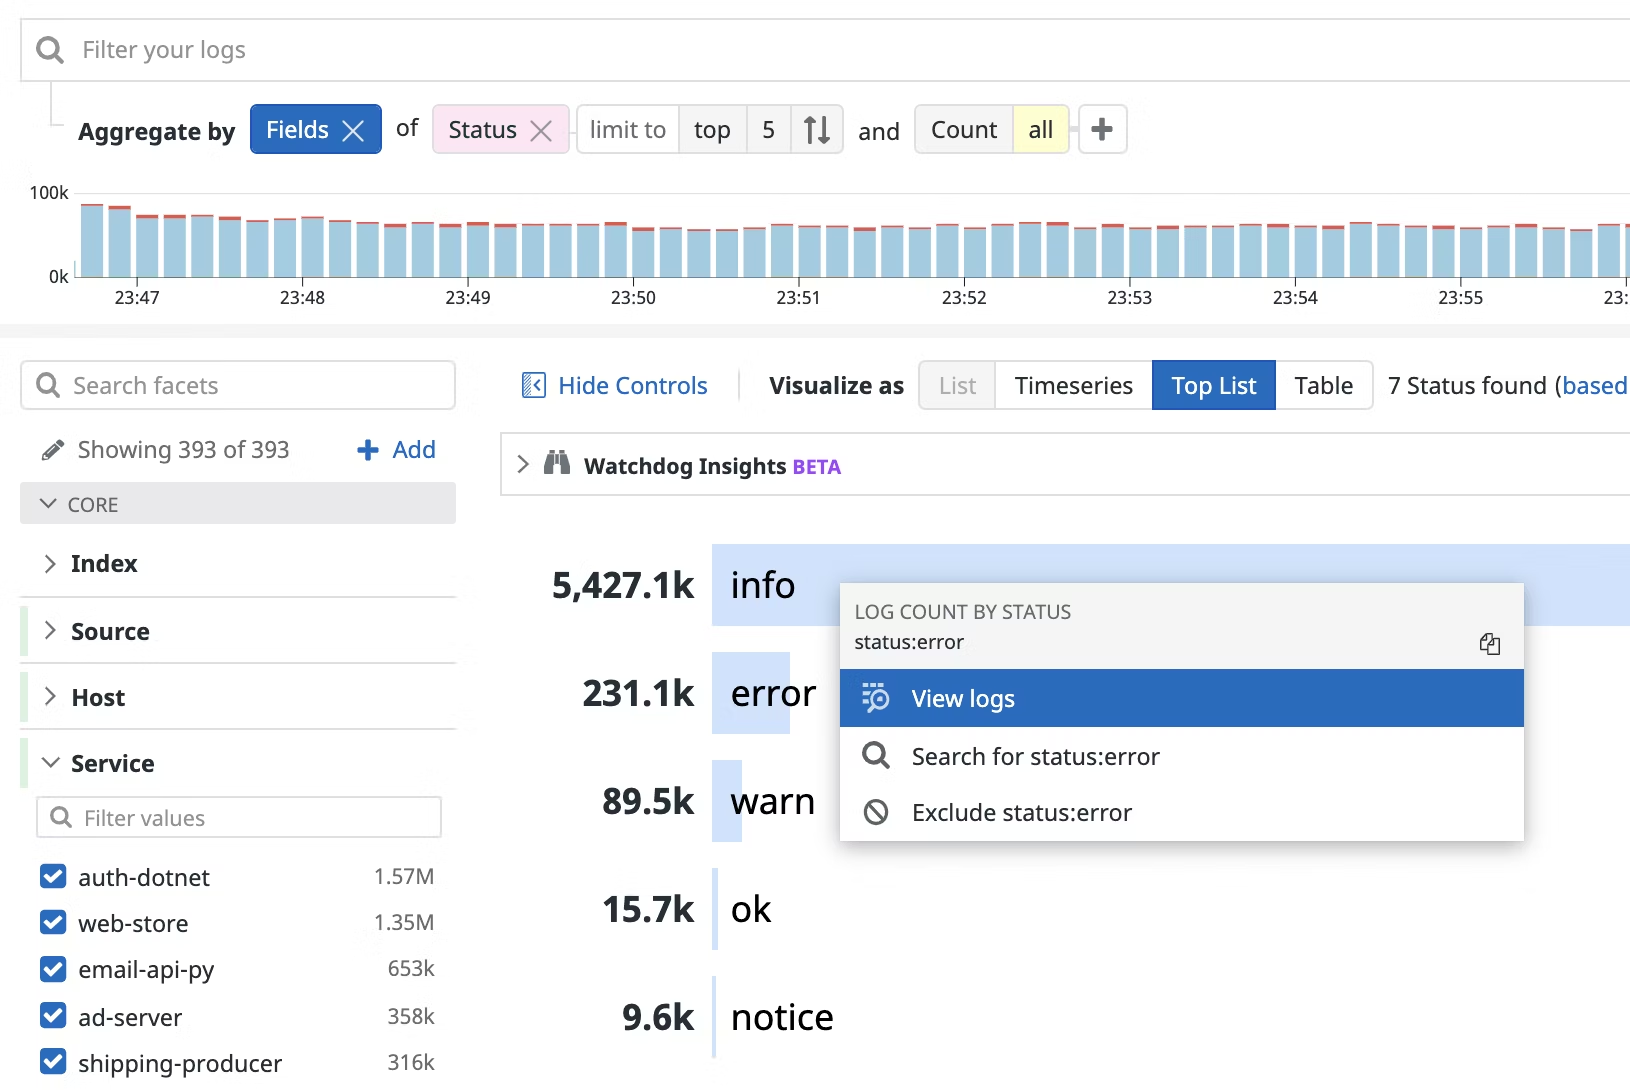
Datadog offers extensive log collection capabilities for various environments. Once a logging source is configured, logs are available in the Log Explorer for filtering, aggregating, and visualizing.
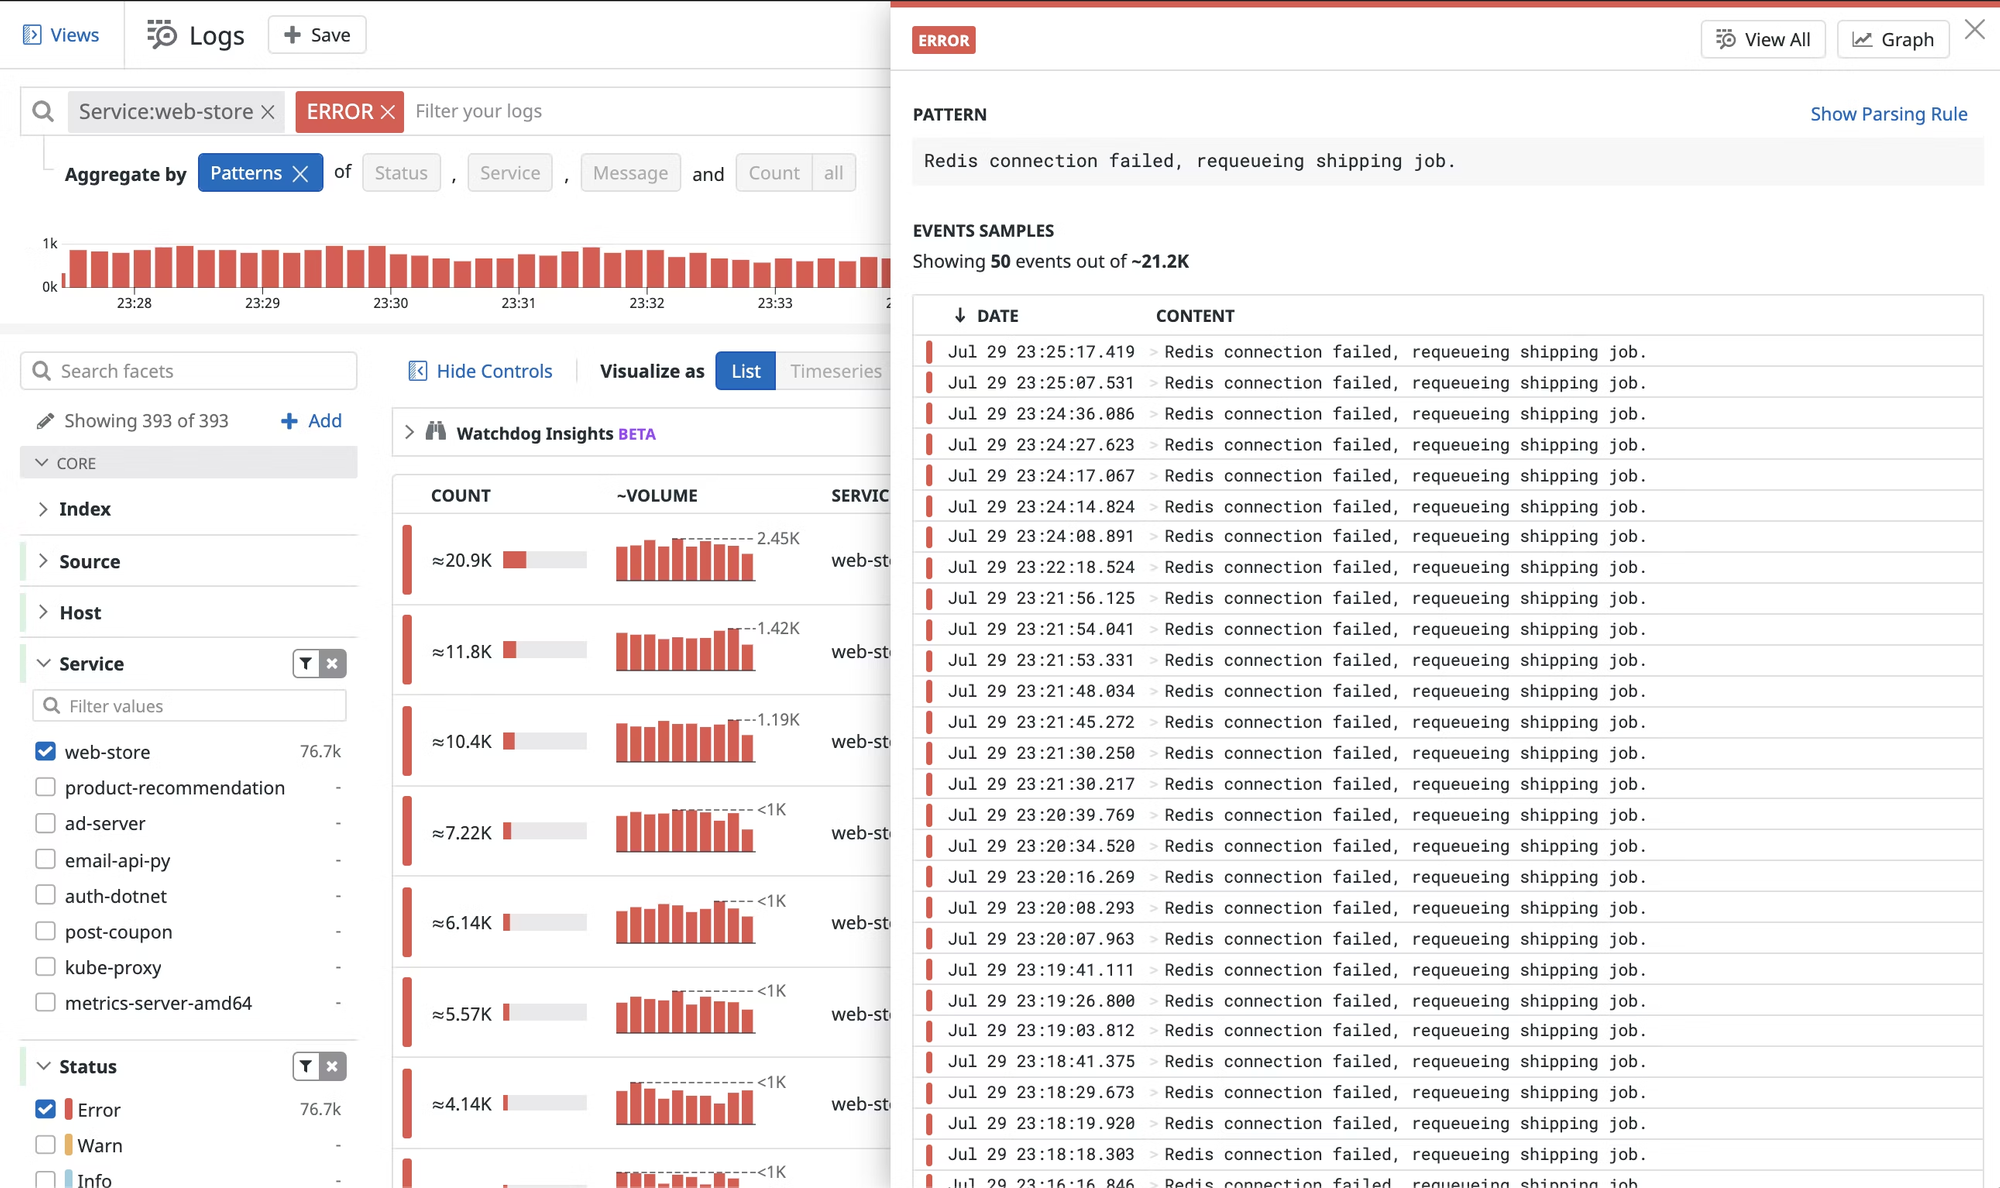
Logs can be grouped by Field of Source, and the Top List visualization can show the top logging services. By selecting source such as error you can quickly identify which hosts and services require attention.
Dynatrace
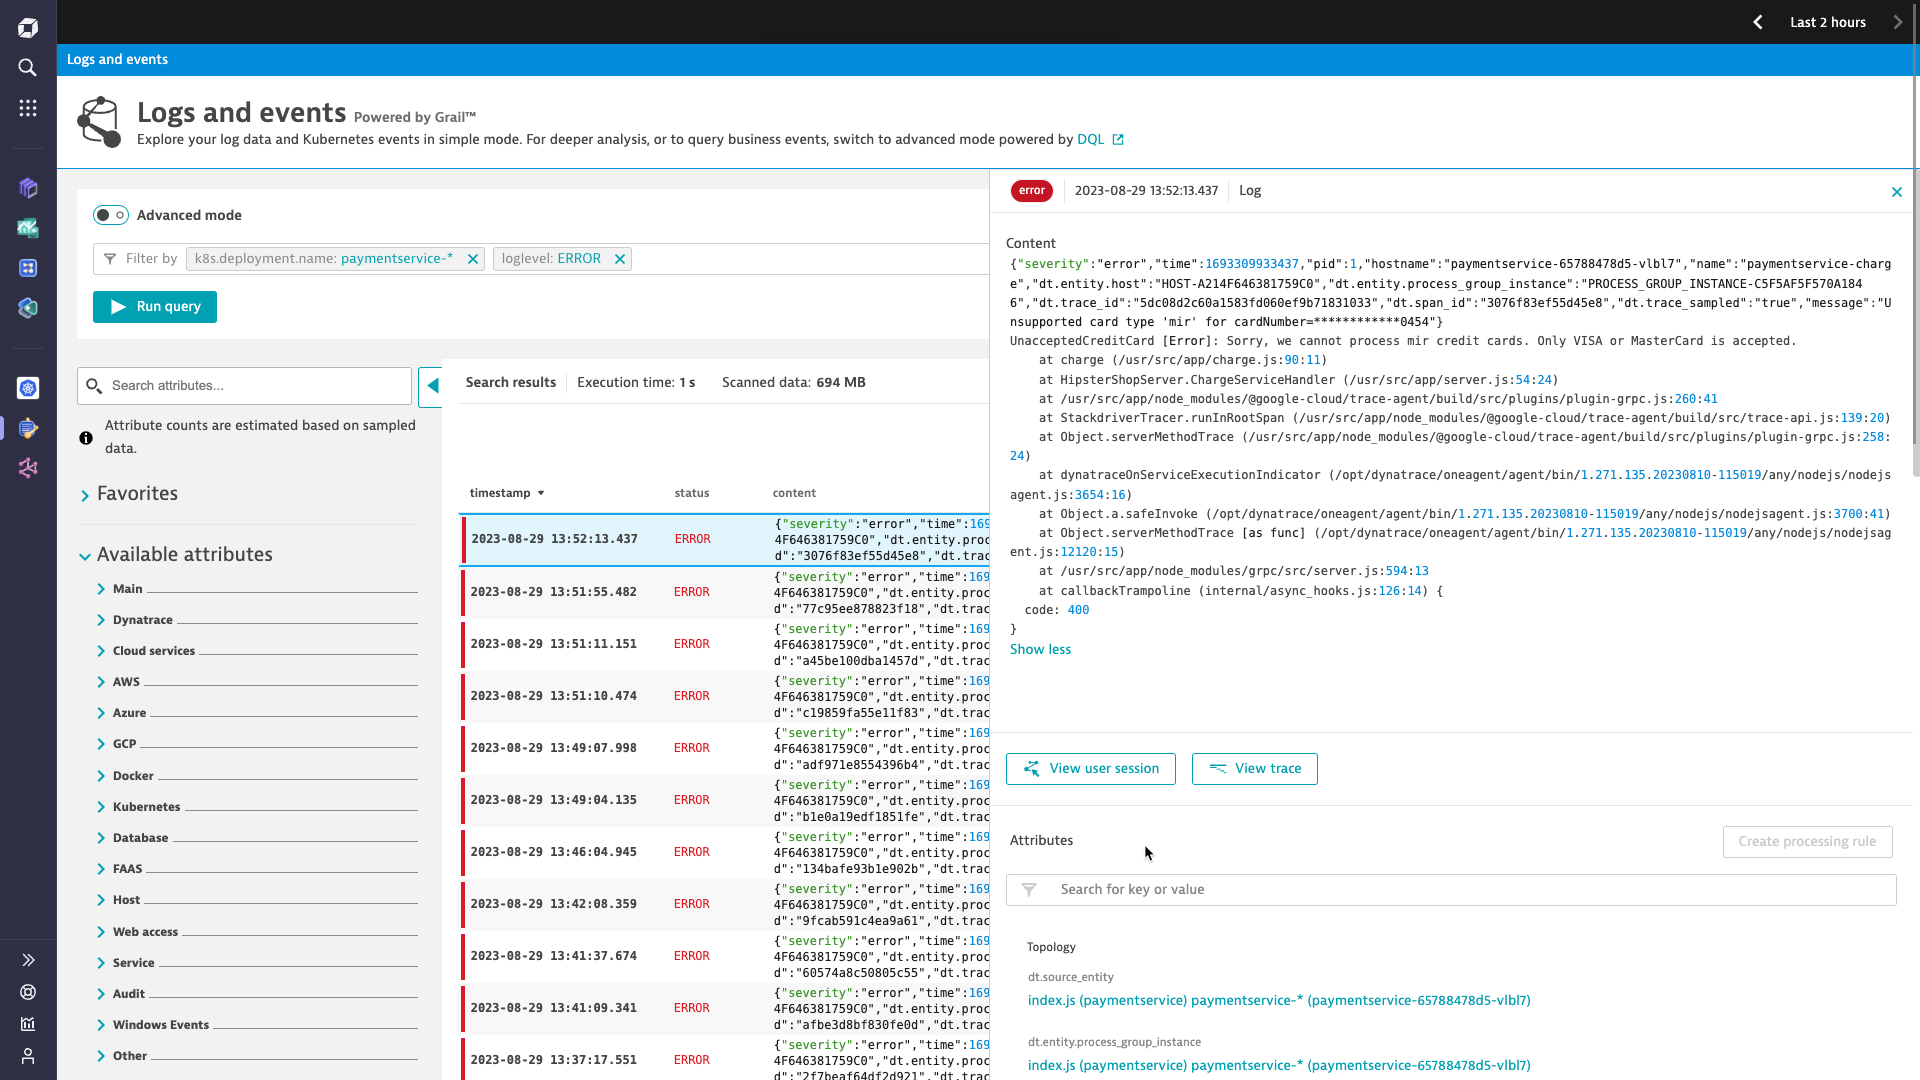
Once the OneAgent is deployed on your host machine, it automatically ingests log data into Dynatrace. Log Management and Analytics, powered by Grail, offers a unified approach to leveraging log data within Dynatrace.
I found it quite helpful that Dynatrace log monitoring enables tracking specific log attributes as metrics. For instance, you can effortlessly convert a log attribute’s numerical value, such as session duration time, into a metric.
Dynatrace offers users the ability to define custom log ingestion rules with OneAgent, giving you control over how log data is managed. By placing log data into designated retention buckets, you can manage how long the data is kept.
Storing logs in these buckets enhances query performance. This approach reduces the time it takes to execute queries and limits the amount of data that needs to be read, making data retrieval more efficient.
Dynatrace’s integrated and user-friendly setup makes log monitoring quicker and simpler compared to Datadog.
Ease of Use and User Interface
Having used both Datadog and Dynatrace, significant differences in their user experiences are noticeable. Datadog impresses with its exceptionally user-friendly interface. The variety of features and dashboards are designed to make navigation effortless and straightforward. This ease of use ensures that information can be quickly found and capabilities can be maximized without feeling overwhelmed.
In contrast, Dynatrace offers a comprehensive and extensive range of features that truly stand out. The platform's effortless deployment and automatic infrastructure detection, combined with its powerful AI engine, make it a robust tool for monitoring and analysis.
However, utilizing Dynatrace to its fullest requires a certain level of technical proficiency due to its complexity. Despite these strengths, improvements could be made to Dynatrace's user interface to enhance its accessibility and overall user experience.
Based on my personal experience, Datadog stands out as the clear winner due to its user-friendly interface and ease of navigation.
Documentation
Both Datadog and Dynatrace provide extensive official documentation. However, I found Datadog’s documentation to be more straightforward and easier to navigate. In contrast, Dynatrace's documentation often required jumping between multiple documents to find the necessary information.
Additionally, Datadog provides a lot of explainer videos on YouTube, which I found very helpful. These videos made it quicker and easier to set up Datadog and understand complex topics. Even though the documentation was good, the videos were a great supplement for better clarity.
Datadog’s straightforward documentation and videos make it easier to use compared to Dynatrace.
Pricing
Datadog
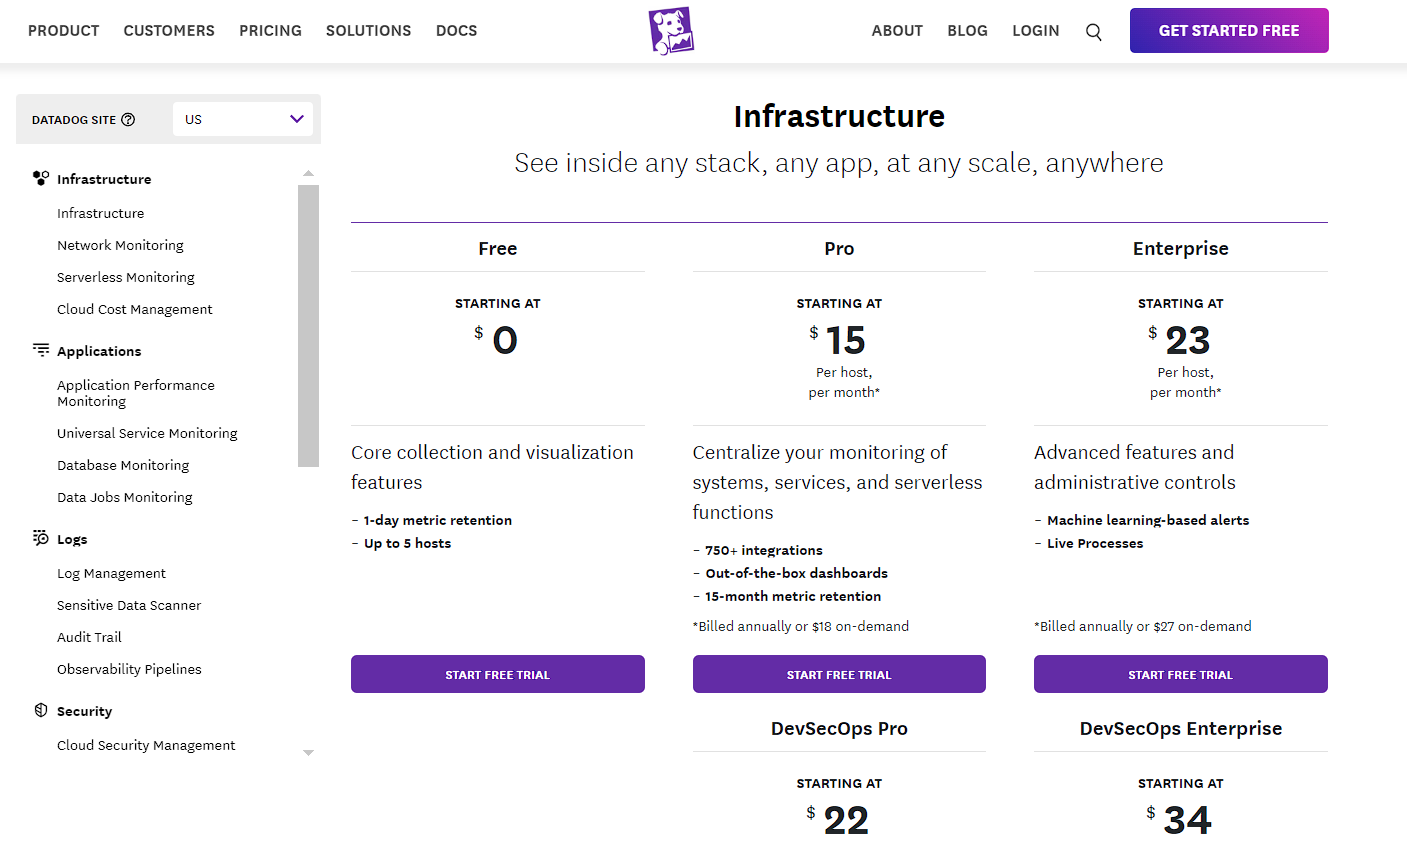
Datadog employs a decentralized pricing model where each of its products has its own pricing logic. This can lead to complexity and potential overages as customers are billed monthly based on an annual commit. For example, monitoring cloud infrastructure starts at $15 per host per month. Additionally, log management is priced at $1.70 per million log events per month, adding another layer of cost management for users.
Dynatrace
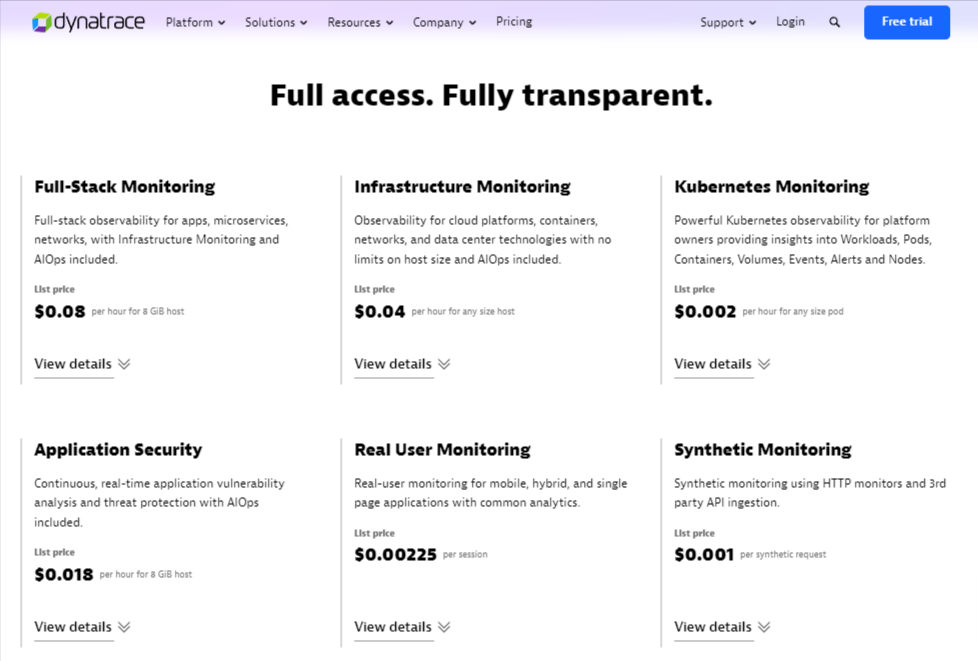
Dynatrace offers a more straightforward and flexible pricing model. It starts at $0.04 per hour for any size host for monitoring cloud infrastructure, making it easier for customers to scale and manage costs. There are no monthly overages, and with a simple annual commitment, customers can forecast and control their spending effectively. Dynatrace also provides transparency with both full-stack pricing and individual product pricing models.
Both Datadog and Dynatrace are relatively expensive and may not be budget-friendly. Be mindful of their pricing when choosing a tool, and select based on your specific needs and budget considerations.
Datadog vs Dynatrace: The Final Verdict
Datadog shines with its user-friendly interface, extensive integrations, and straightforward setup. It's a great pick if you are a a small team looking for a tool that balances ease of use with powerful features. And its clear documentation is an added advantage.
On the other hand, Dynatrace excels in large-scale environments with its advanced AI-driven insights and robust infrastructure monitoring. It's a great choice if you are dealing with complex systems. However, the learning curve can be steep, and the user interface might feel overwhelming initially.
Both tools have their strengths and weaknesses. Make sure you understand your monitoring needs and consider the pricing before making a choice.
Atatus: A Cost-Effective Alternative to Datadog and Dynatrace
Effective monitoring and observability are crucial for managing applications in production, so choosing the right tool is essential for staying ahead of issues.
Although both Datadog and Dynatrace offer a lot of features, they can be quite costly. As the need for monitoring tools increases, the price becomes a significant concern. A cost-effective tool that can serve as a good alternative to Datadog and Dynatrace is Atatus, which offers all the necessary features for effective monitoring.
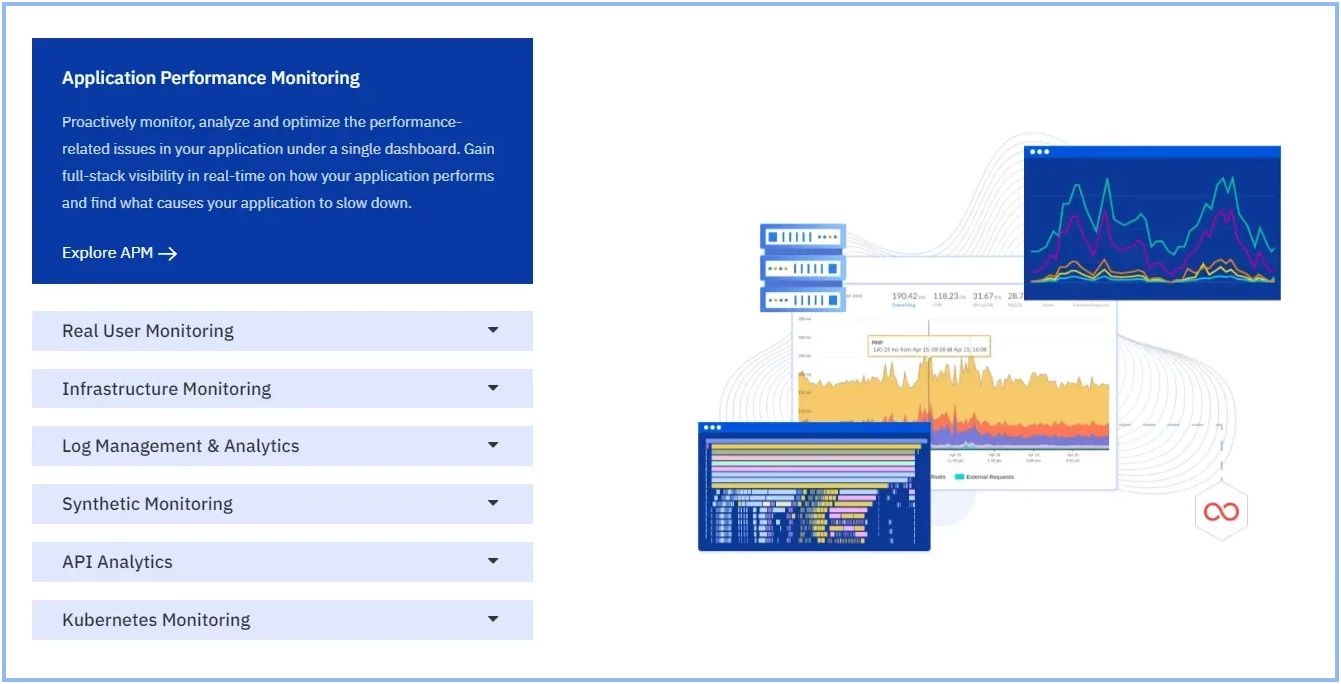
Atatus offers a range of products including Application Performance Monitoring, Infrastructure Monitoring, Database Monitoring, Logs Monitoring, Real User Monitoring, API Analytics, Kubernetes Monitoring and Uptime Monitoring (Synthetics).
Atatus is easy to use, with a user-friendly interface and intuitive setup process, allowing your team to focus on delivering exceptional user experiences without added complexity.
Atatus provides budget-friendly pricing plans that prioritize cost effectiveness without sacrificing features and functionalities. New to Atatus? Get started with a 14-day free trial.
#1 Solution for Logs, Traces & Metrics
![]() APM
APM
![]() Kubernetes
Kubernetes
![]() Logs
Logs
![]() Synthetics
Synthetics
![]() RUM
RUM
![]() Serverless
Serverless
![]() Security
Security
![]() More
More


![New Relic vs Splunk - In-depth Comparison [2025]](/blog/content/images/size/w960/2024/10/Datadog-vs-sentry--19-.png)
![New Relic vs Sentry - Which Monitoring Tool to Choose? [2025]](/blog/content/images/size/w960/2024/10/VS--1-.png)