12 Best Sentry Alternatives in 2025
Are you searching for a tool to fix errors in your apps? Error tracking tools are here to help! Imagine your app is running smoothly, but suddenly, errors appear. That's when tools like Sentry step up to assist.
Sentry offers real-time error analysis and supports multiple programming languages, making it a versatile tool for developers. With its features, it helps developers to find and fix software issues.
Sentry has grown from a basic error-tracking tool to a comprehensive platform for monitoring and improving application health. This evolution includes the integration of Application performance monitoring(APM).
Sentry's application performance monitoring helps developers to pinpoint slow code and trace slow transactions to poor-performing API calls or database queries, making it a top choice among developers.
While Sentry is a preferred choice for error tracking and application performance monitoring(APM), some developers seek alternatives due to pricing concerns or finding its interface overly complex. It is essential for developers and organizations to explore other options that better suit their specific needs regarding features, usability, and cost-effectiveness.
In response to these concerns, we have compiled a list of alternatives to Sentry that can be considered.
1. Atatus
Atatus, a full stack observability platform, stands out as an excellent alternative to Sentry, offering error monitoring and comprehensive visibility into application performance across the entire stack.
Atatus allows you to monitor and resolve errors in real-time, providing complete visibility into errors and allowing you to maintain high-speed development without compromising user experience.
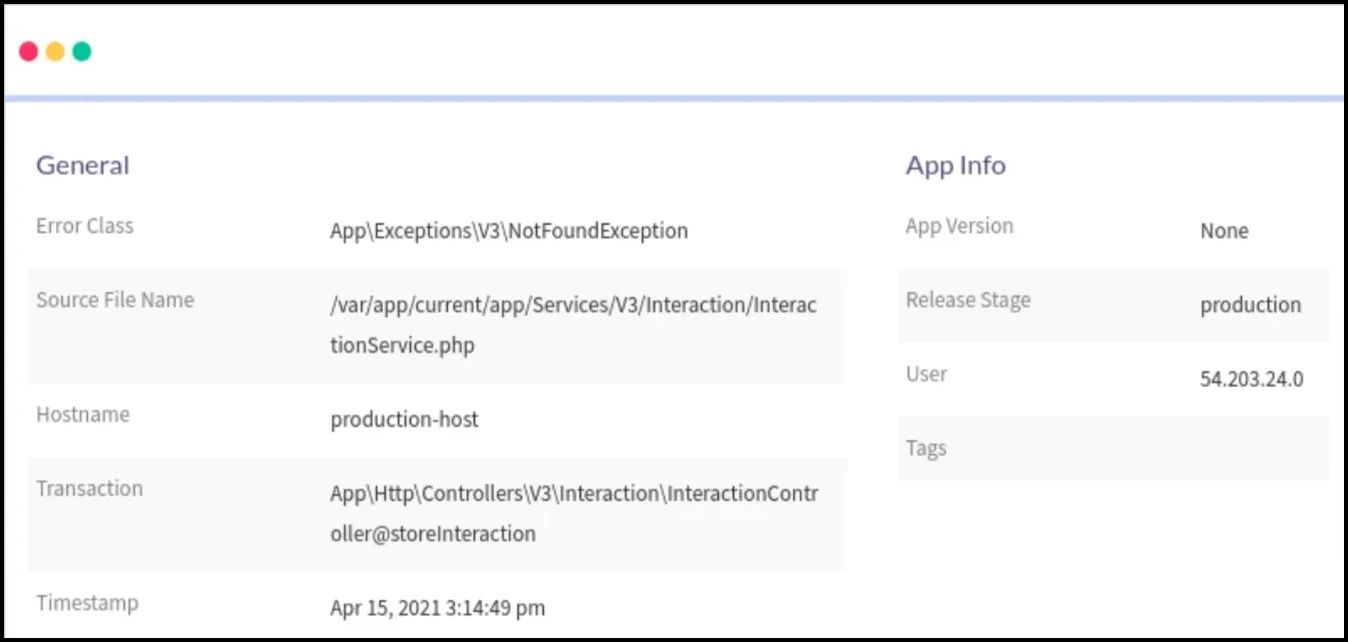
With Atatus, you can access full stack traces, telemetry, and error context seamlessly mapped to your source code.
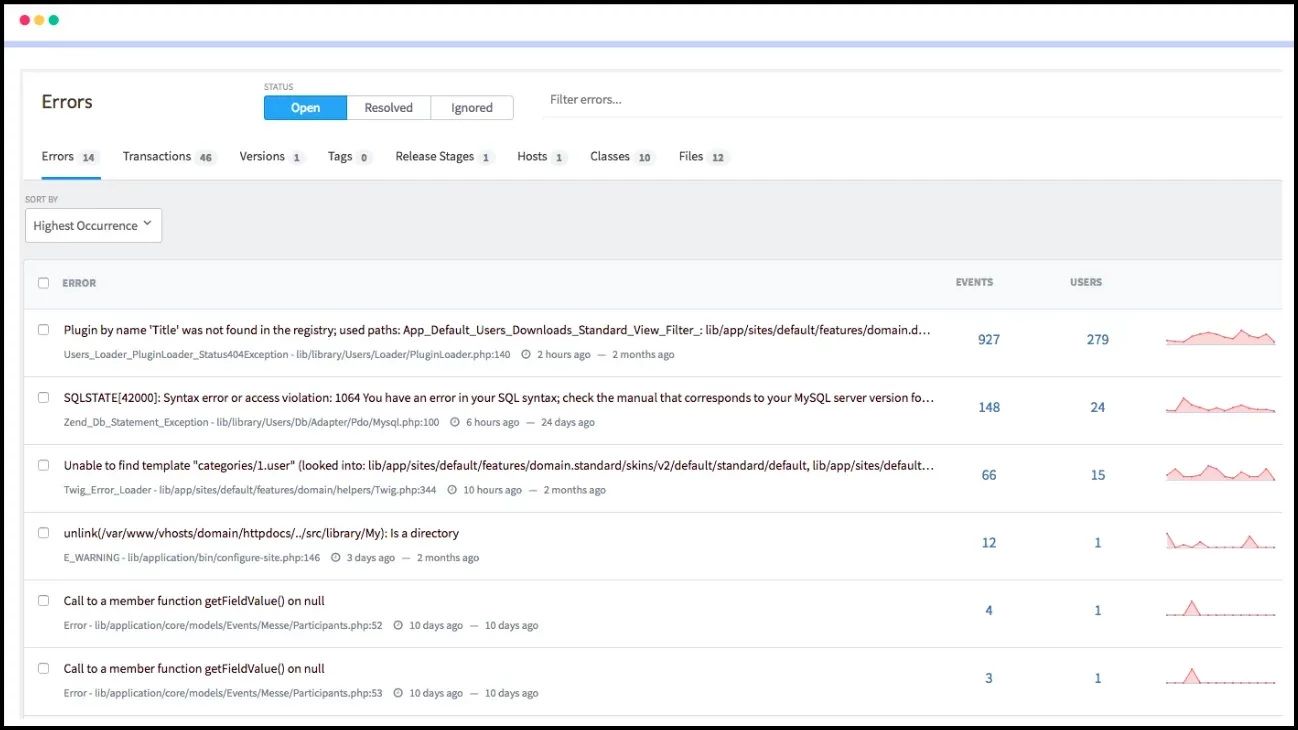
Atatus gathers a range of additional information when an error arises, including URL, port, user, app, version, user agent, viewport, and more. This data enriches your understanding of the issue and aids in efficient debugging.
With Browser Monitoring, Application Performance Monitoring (APM), and Infrastructure Monitoring, it delivers real-time insights into frontend, backend, and server performance, enhancing observability.
Atatus Application Performance Monitoring (APM) offers in-depth insights into your applications, allowing you to pinpoint performance bottlenecks, resolve issues, and enhance your services. Atatus APM ensures optimal performance and user experience for your applications.
Atatus supports a variety of programming languages, including Java, PHP, Node.js, Ruby, Python, and Go, ensuring it is compatible with a diverse range of applications.
Pricing
| APM | RUM | Infra |
|---|---|---|
| $0.07 per Host Hour/ month | $1.96 10K Views/ month | $0.021 per Host Hour/ month |
Try Atatus for free with a 14-day trial – no credit card needed. Cancel anytime.
2. Raygun
Raygun provides Error Monitoring, Application Performance Monitoring (APM), and Real User Monitoring (RUM) to track errors, performance issues, and user sessions. With its comprehensive suite of error monitoring and performance tracking capabilities, Raygun help teams to proactively identify, diagnose, and resolve issues before they impact end users.
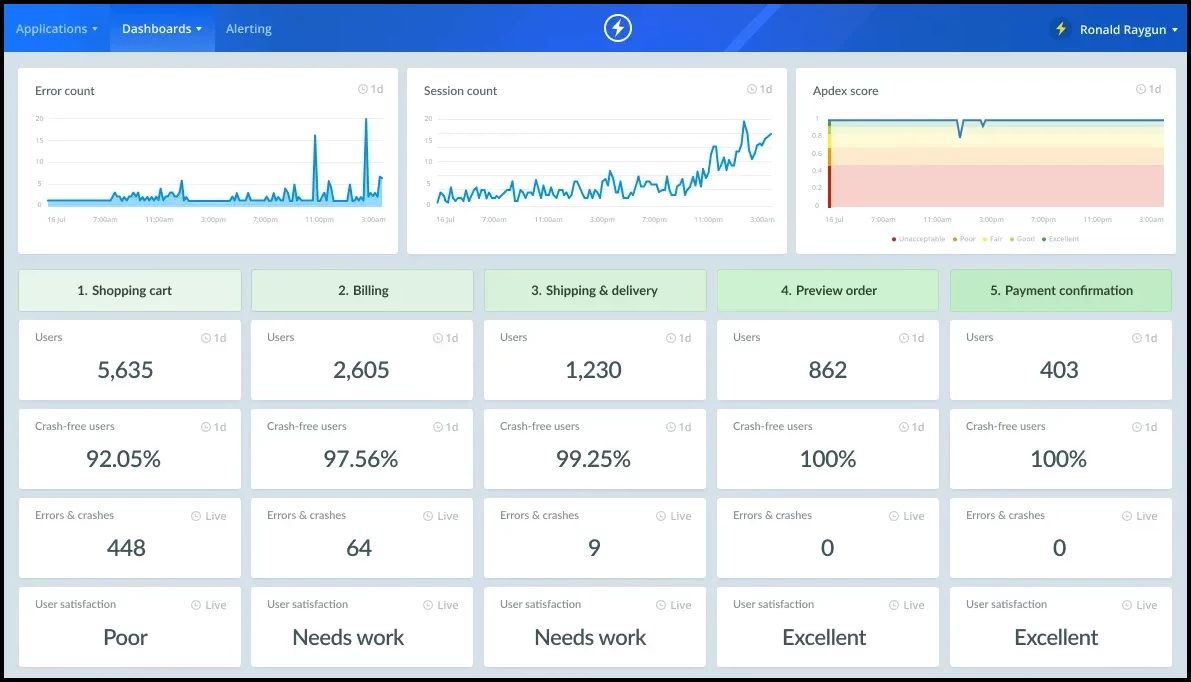
Raygun offers three key features: Error Monitoring & Crash Reporting for quick issue resolution, Real User Monitoring for enhanced front-end performance insights, and Application Performance Monitoring for streamlined code execution observation.
With Raygun, gain comprehensive visibility across your entire tech stack with real-time error monitoring for desktop and mobile platforms. Never overlook errors again as you receive detailed insights including full stack traces, environment variables, browser details, version information, class names, hosts, and more.
Pricing
| Product | Basic | Team | Buisness |
|---|---|---|---|
| Crash Reporting | $40 Per 100,000 errors/month | $80 Per 200,000 errors/month | $400 Per 1,000,000 errors/month |
3. Rollbar
Rollbar provides crash reporting, error tracking, logging, and error monitoring. It assists developers in identifying and resolving errors before they affect users, while also providing timely notifications about new issues to users before customers begin reporting them.
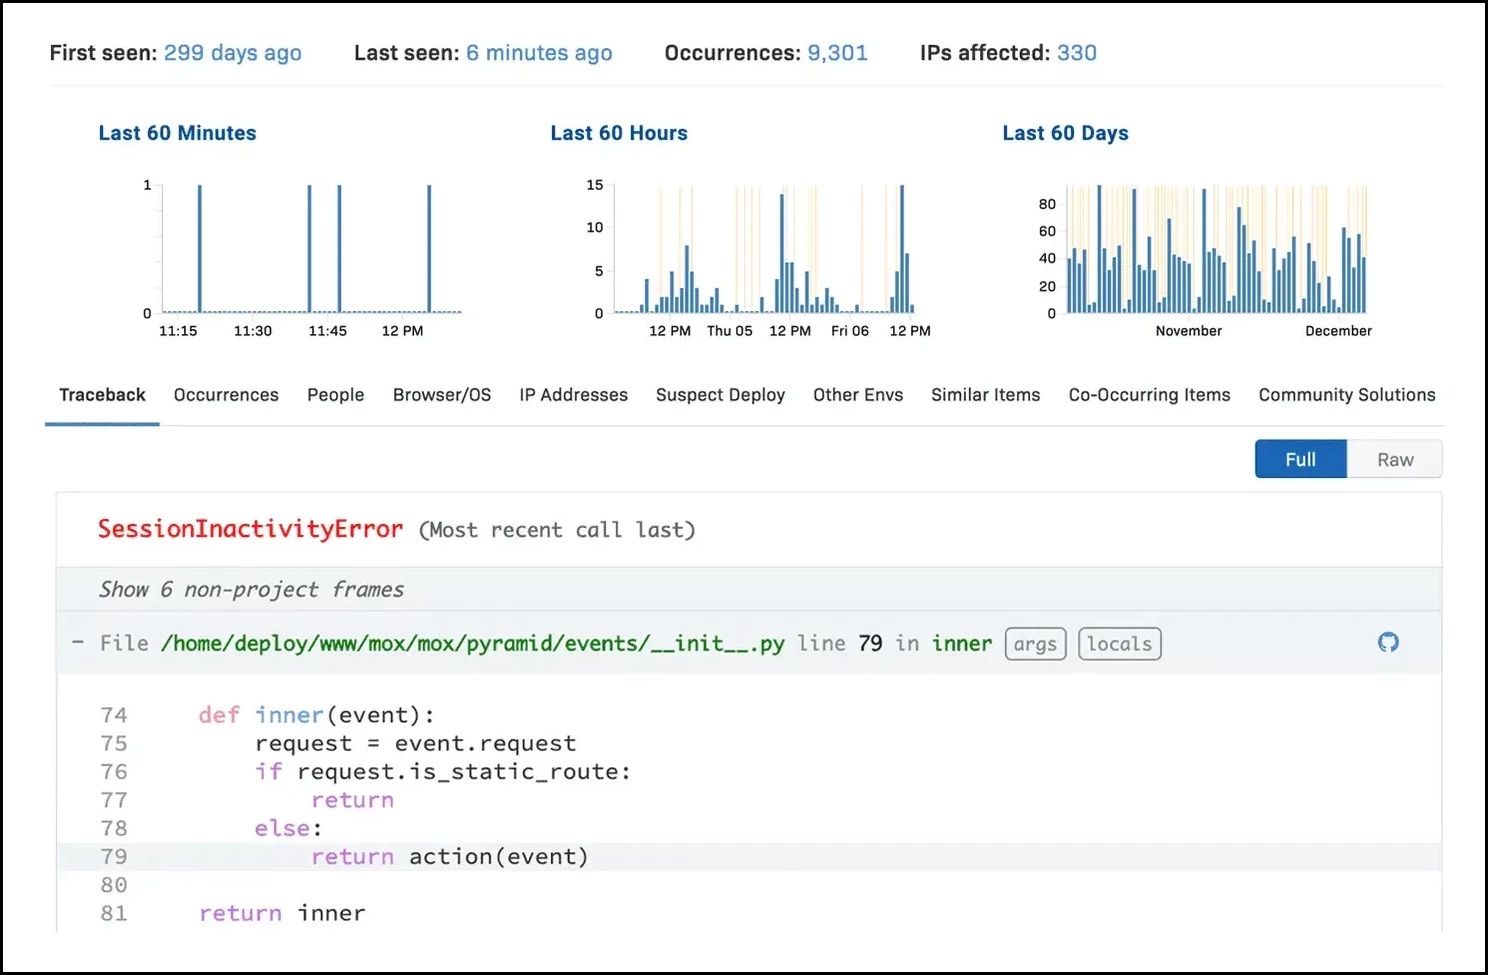
Rollbar streamlines error monitoring by grouping similar issues together, minimizing noise. You can customize the system to your needs by creating custom rules or accepting Rollbar's suggestions. Rollbar empowers faster deployments with fewer errors, boosting deployment frequency by up to 9 times for companies.
The platform collects errors from nearly any major platform, language, or framework, providing real-time visibility into detailed exception messages and stack traces. Developers can trace errors directly to the specific line of code, source code commit, or release, facilitating precise debugging and issue resolution.
Pricing
| Basic | Essentials | Advanced |
|---|---|---|
| $0/month | $15.83/month for 25K event volume | $32.15 /month for 25K event volume |
4. Instabug
Instabug offers a suite of products including Bug Reporting and Feedback, Crash Reporting, and App Performance Monitoring (APM). It helps mobile app developers by providing insights to fix problems and prevent crashes, allowing teams to concentrate on their tasks. It monitors app stability and user performance in real-time, processes bug reports and surveys to understand user satisfaction.
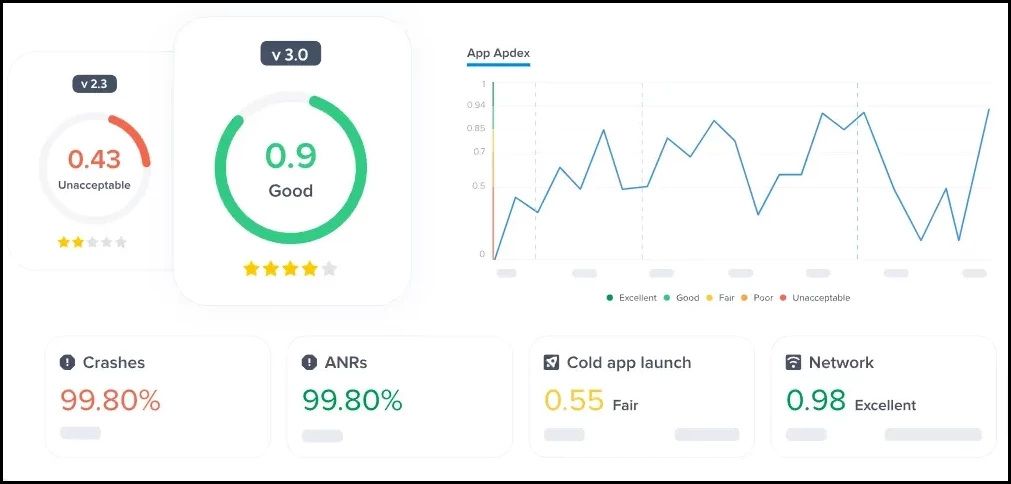
It gives a clear view of mobile app behaviour and issues, allowing developers to solve problems directly during user sessions. Instabug uses a single metric called the "App Apdex number" to measure overall app experience, helping teams prioritize tasks and focus on new features.
It also helps in quickly identifying errors and assigning them to the right teams. With real-time release management, Instabug assists mobile teams in balancing stability, performance, and feature development throughout the development process.
Pricing
| Basic | Pro | Ultimate |
|---|---|---|
| $249/month | $499/month | $749/month |
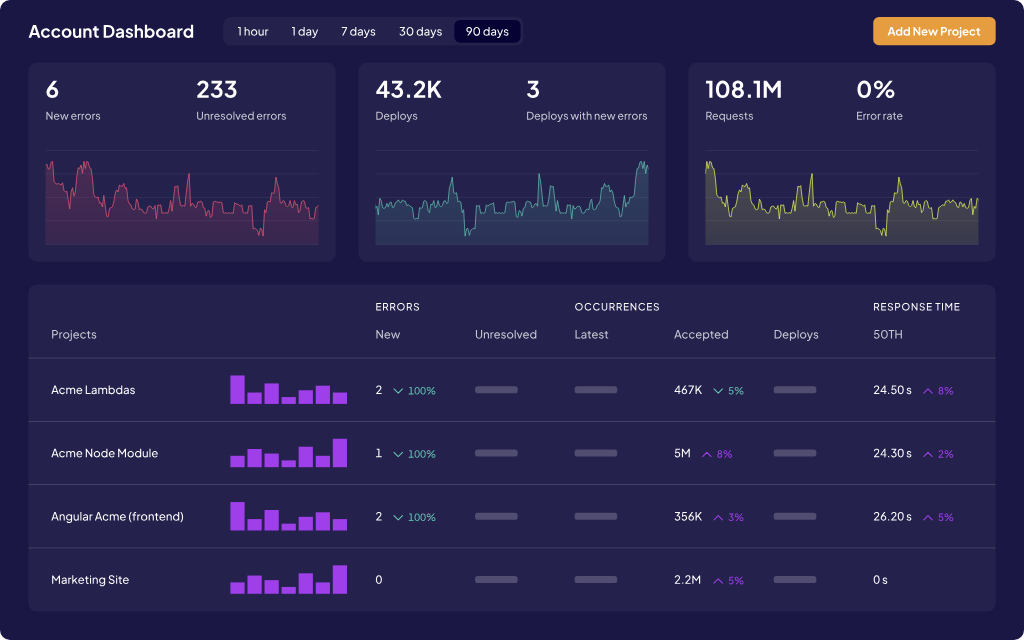
5. New Relic
New Relic is a comprehensive observability platform covering application performance monitoring(APM), infrastructure monitoring, Log Management, Synthetics, and more. In terms of error monitoring, New Relic provides robust features to detect, diagnose, and resolve errors within applications efficiently.
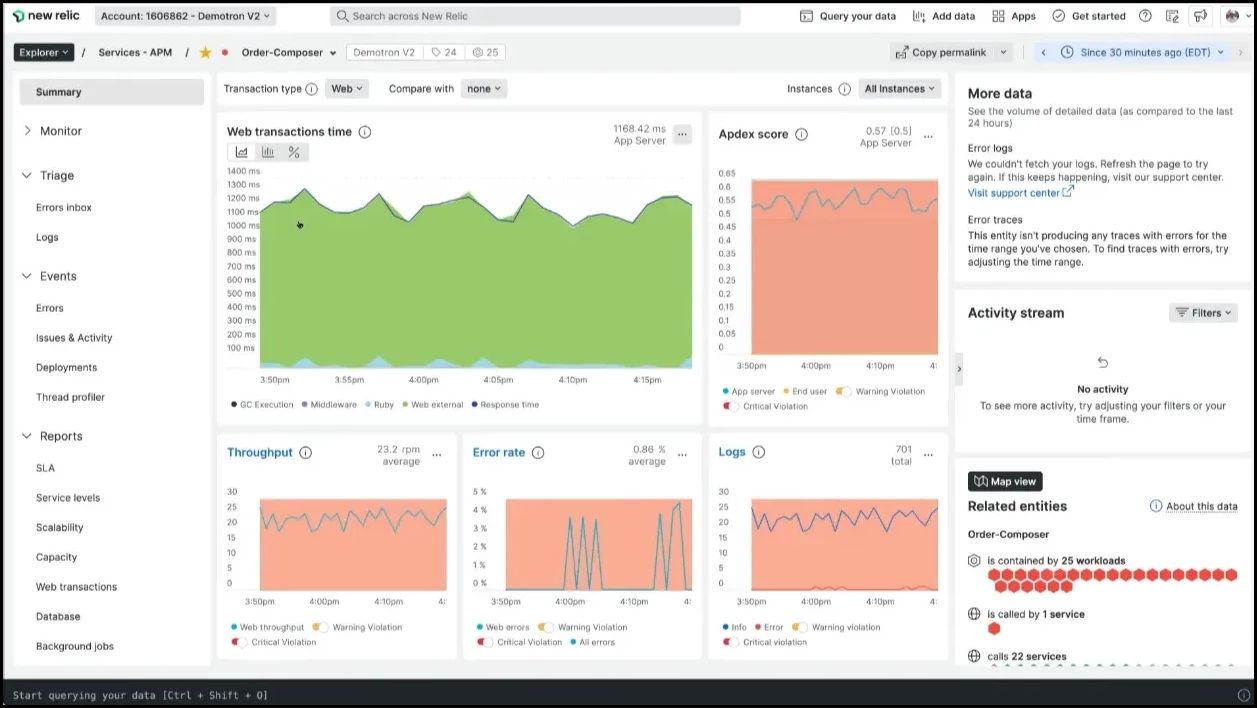
New Relic's Application Performance Monitoring (APM) provides users with intuitive navigation and visualization tools. It offers seamless access to view errors from applications directly within the Errors Inbox UI, requiring no additional setup apart from configuring APM and infrastructure monitoring.
The Errors Inbox in New Relic tightly integrates with APM, using its data to pinpoint application-specific errors. It offers filtering options and error grouping capabilities to facilitate precise error identification, providing detailed insights into timestamps, affected hosts, users, URLs, logs, and error messages.
Pricing
New Relic offers comprehensive pricing, For further details, please visit the official website.
6. Bugsnag
Bugsnag provides real user monitoring and error monitoring with detailed diagnostics and workflow integrations. It is used for monitoring errors and glitches in mobile applications and JavaScript-based applications. It also supports popular JavaScript frameworks such as React, Vue, and Angular, making it easier to pinpoint and address issues in complex web applications.
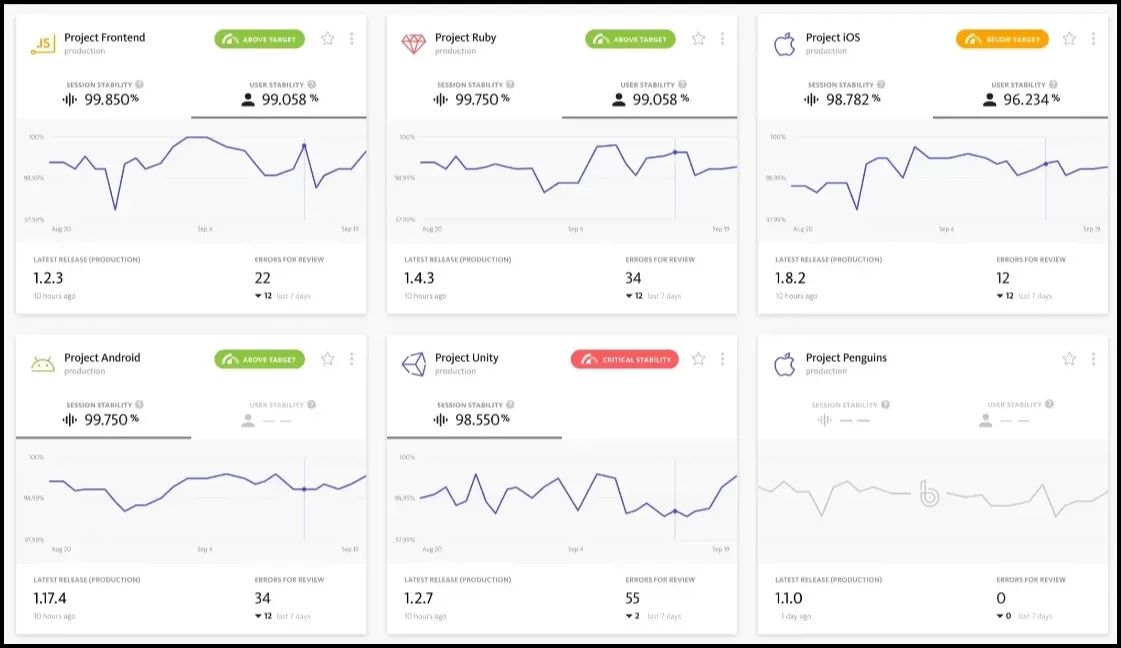
Bugsnag provides stability scores and trends to track application stability and progress toward stability targets. With custom error views, users can prioritize and address critical issues effectively, while the timeline investigation feature enables the identification of error trends over time.
Additionally, Bugsnag's end-to-end diagnostics provide real-time analysis, allowing for a deep understanding of problems as they occur. These integrated capabilities ensure that teams can maintain the stability and performance of their applications with precision and ease.
Pricing
| Basic | Essentials | Advanced |
|---|---|---|
| $0/month | $18/month | $54/month |
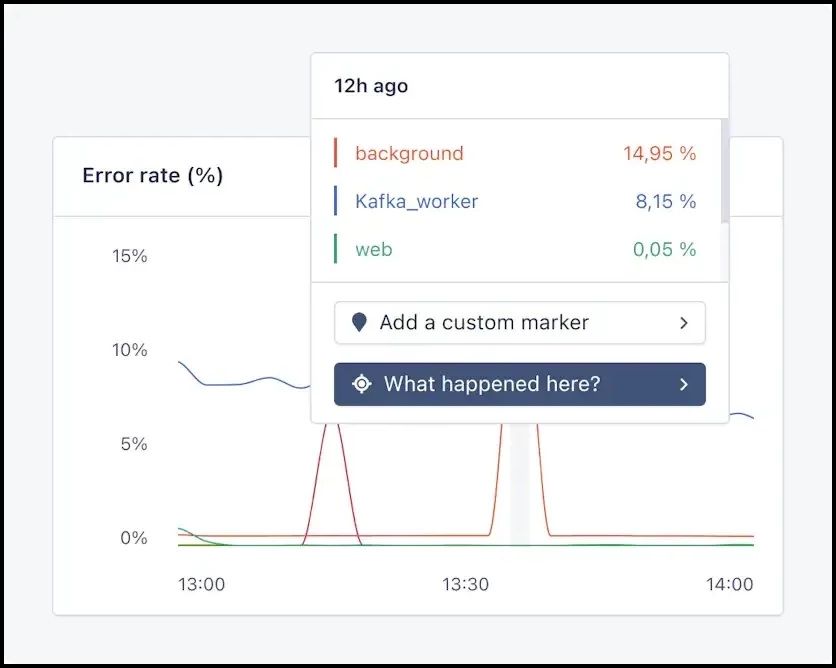
7. Datadog
Datadog offers cloud-based monitoring and analytics platform for modern IT environments. Datadog's error tracking solution is a robust tool designed to group errors across both frontend and backend applications. With its ability to streamline issue management, teams can swiftly identify and prioritize problems based on their impact.
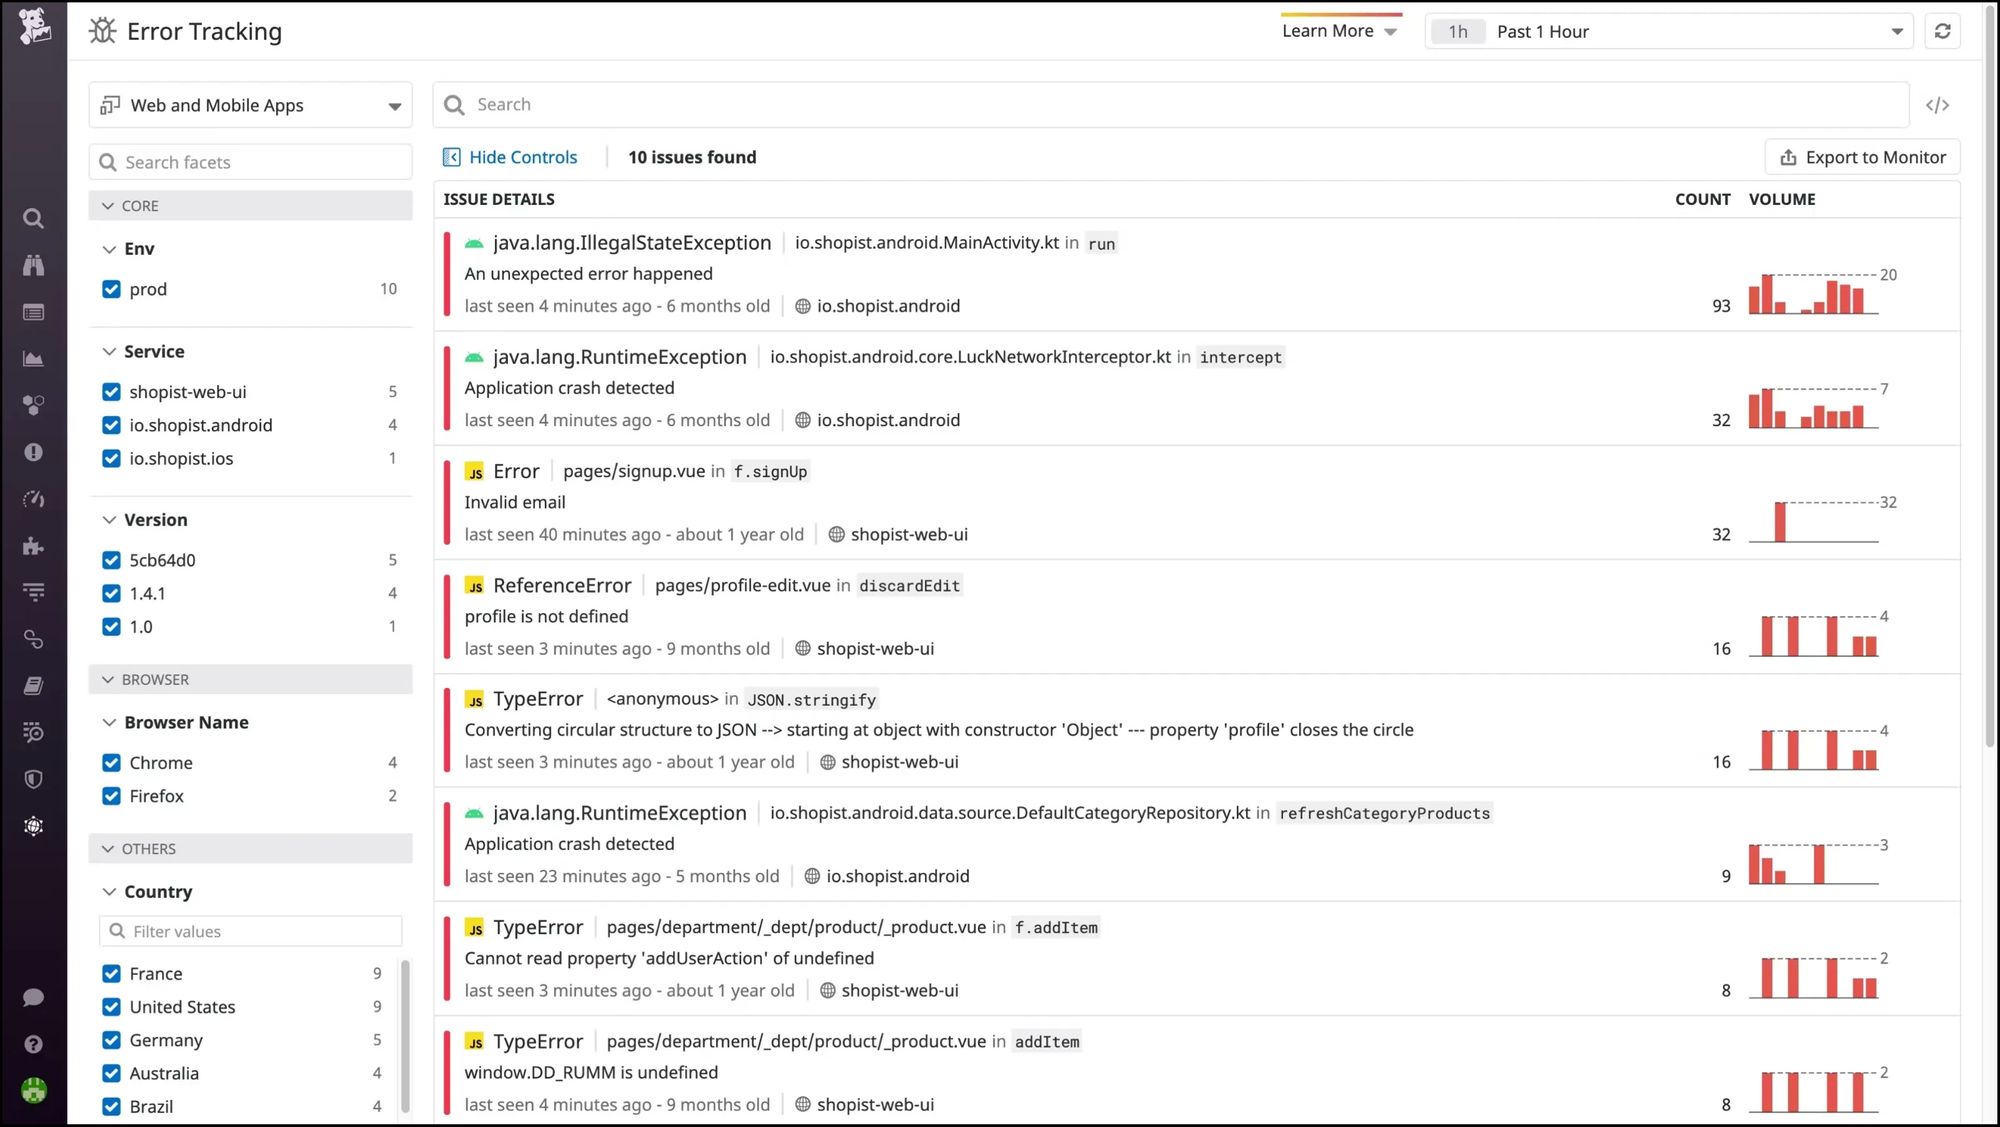
Datadog offers proactive alerts for new issues, helping teams proactively manage potential problems, with their Watchdog AI/ML engine enhancing error detection. Additionally, Datadog provides detailed insights into mobile crashes, including error rates, user behaviour, device specifics, and network conditions. These insights empower teams to address issues that affect user experience effectively.
Datadog's APM enables tracking of application performance across browsers, platforms, databases, and specific commands and code, providing comprehensive visibility for optimizing performance and troubleshooting issues.
Pricing
Datadog offers a comprehensive suite of features with varying pricing options. Visit the official website to know more.
8. AppDynamics
AppDynamics provides comprehensive monitoring, covering business metrics, user experience, applications, infrastructure, and security. It excels at instant root cause analysis, swiftly pinpointing issues in real-time.
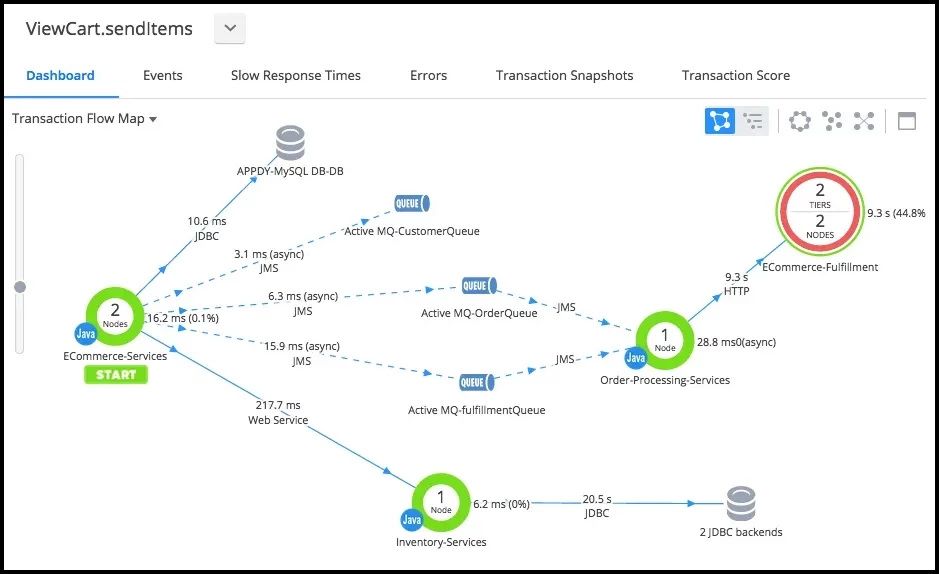
AppDynamics offers deep insights into application performance and behavior, enabling proactive optimization. With its scalability and enterprise readiness, it serves businesses of all sizes. Its robust monitoring capabilities ensure reliability, security, and seamless user experience. The pricing for AppDynamics is available upon request.
9. Splunk
Splunk's APM provides solution for monitoring and troubleshooting the performance of cloud-native applications built on microservices architecture. It helps in error monitoring by offering real-time visibility into application and system errors. It aggregates logs and metrics from various sources, allowing teams to quickly identify and troubleshoot issues.
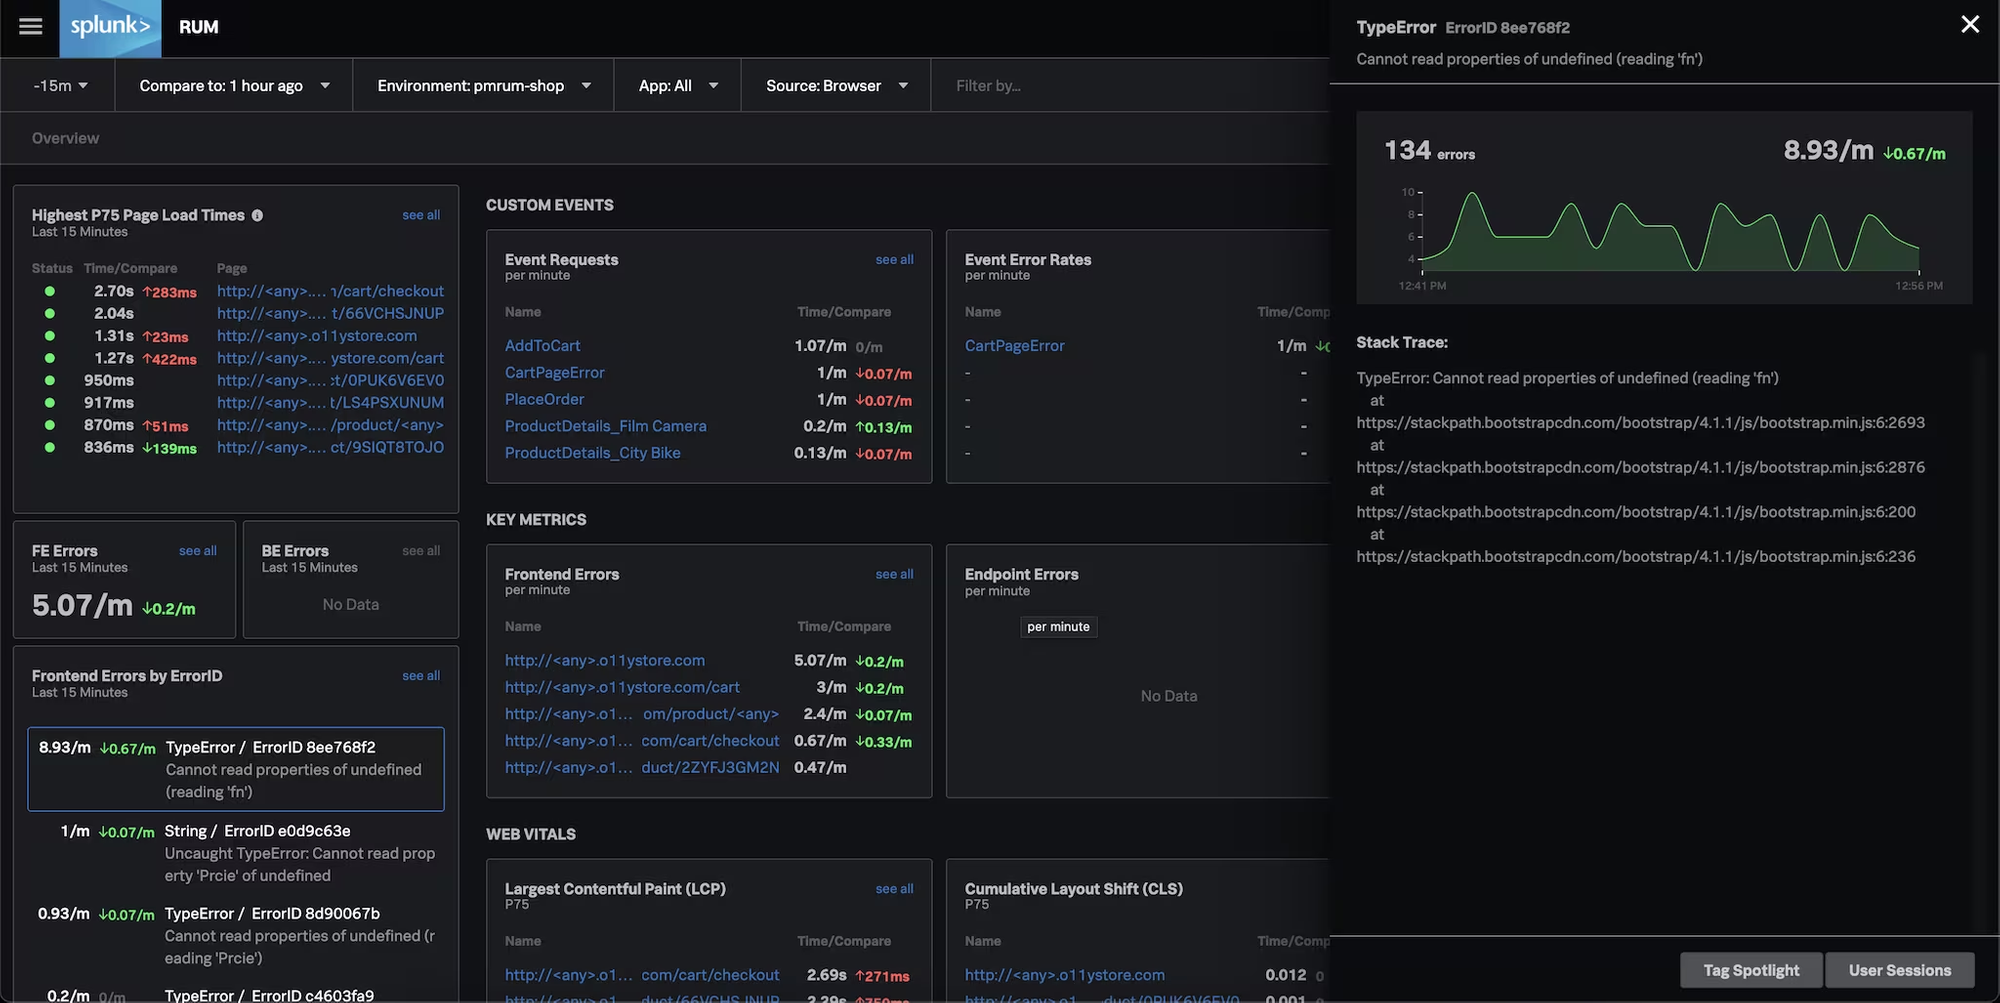
With its robust search and analytics capabilities, Splunk enables users to detect patterns, and trends in error data. Moreover, it provides customizable alerts and dashboards, facilitating proactive monitoring and response to errors before they impact operations.
Splunk APM provides distributed tracing capabilities that allow developers to trace requests across microservices. It captures detailed transaction traces, showing the path of requests through various services, and identifies latency issues or errors at each step.
10. AppSignal
AppSignal's comprehensive suite includes Error Tracking, Performance Monitoring, Uptime Monitoring and Log Management. It is a tool that helps you track and improve the performance of your website or application. It keeps an eye on both frontend and backend operations, monitors your server, and tracks errors.
AppSignal is an error tracker for Ruby, Elixir, Node.js, and Python applications. It provides comprehensive error tracking capabilities that display error messages at the start of the page, showing crucial details like hostname, path, and request ID saved for each request. Users can pinpoint the host where errors occurred and assess hardware and network performance at the time.
With AppSignal, you can collect important metrics from your app and receive alerts via email, Slack, or other messaging platforms to stay on top of issues. Additionally, AppSignal allows users to manage issue statuses and customize notification preferences seamlessly.
Pricing
Visit the official website to view detailed pricing information.
11. Airbrake
Airbrake error monitoring and application performance monitoring tool stands out with its advanced alerting and notification system. It allow users to customize alerts based on various parameters such as error severity, frequency, or specific error types. This customizable approach ensures that developers receive timely notifications for critical issues, empowering them to take timely action.
Airbrake's lightweight APM solution helps developers to monitor their application's performance and availability by tracking metrics such as HTTP requests, response times, error rates, and user satisfaction. It supports monitoring and reporting for over 50 programming languages, frameworks, and libraries.
Alongside this, Airbrake distinguishes itself with its robust contextual information, providing developers with enriched data including parameters, users, and environment variables. This comprehensive view enables developers to thoroughly analyse errors and make informed decisions to enhance application performance.
Pricing
| Dev | Basic | Professional |
|---|---|---|
| $17/month | $34/month | $68/month |
12. Dynatrace
Dynatrace provides a comprehensive monitoring solution that includes an APM tool designed for automated observability across cloud-native services. It looks at things like logs, metrics, and what is happening during user sessions to figure out what's going wrong, enhancing observability.
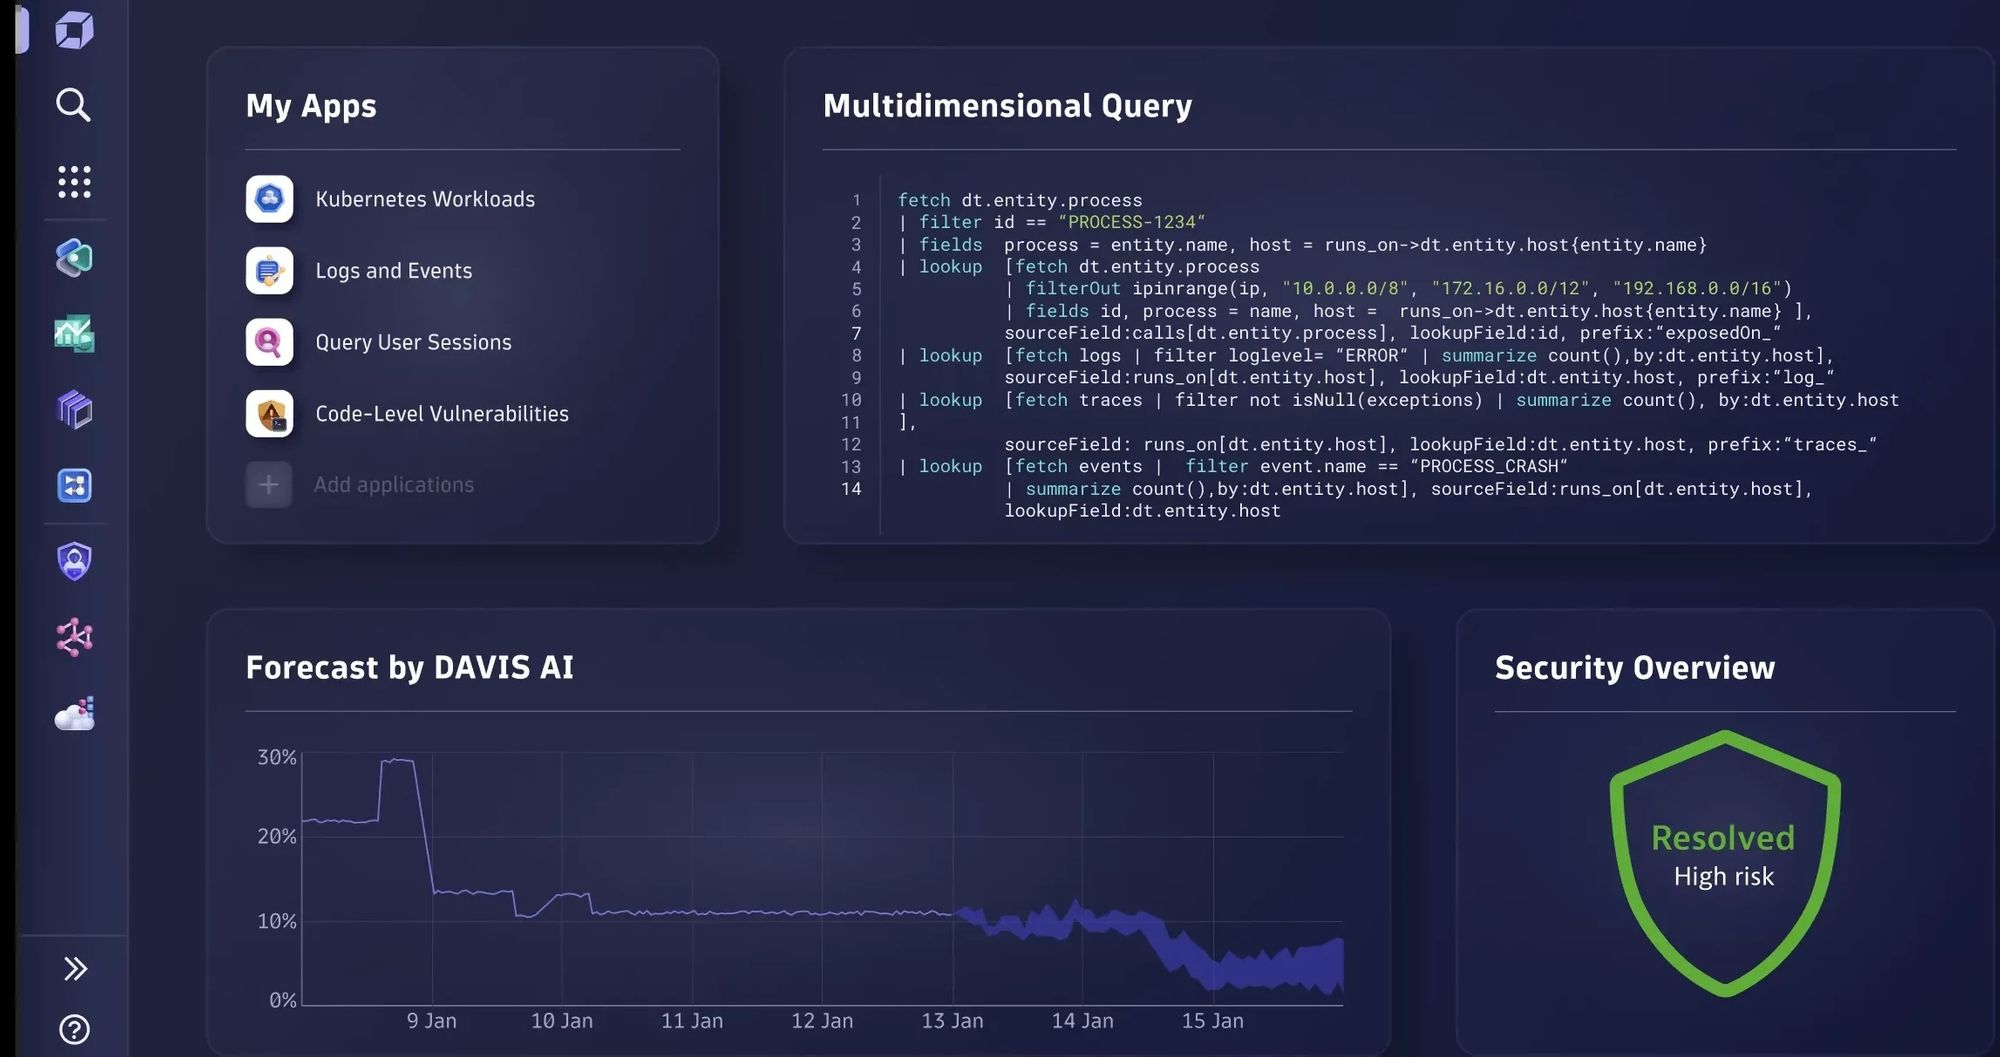
Dynatrace API leverages AI-driven root cause analysis, quickly pinpointing underlying issues and automatically correlating errors with relevant application performance metrics. End-to-end distributed tracing capabilities monitor requests across microservices, offering insights into how errors propagate through different parts of the application.
It offers comprehensive cloud monitoring, detecting issues with third-party services, disconnected hosts, and overall platform health. Additionally, Dynatrace supports site reliability engineering by optimizing user experience, enhancing application availability and performance, and proactively fixing issues with full-stack visibility.
Pricing
Visit the official website to view detailed pricing information.
How to Choose the Right Sentry Alternative?
To choose the right tool from various Sentry alternatives, it is important to consider several factors. Each tool offer unique strengths and weaknesses, so it's essential to prioritize features based on your specific needs.
- More Than Just Error Tracking: If you prioritize error tracking and basic application monitoring, tool like Raygun may be adequate. But if you want full visibility into your application performance, choose comprehensive performance monitoring tools tools like Datadog, Atatus and New Relic.
- User Interface and Ease of Use: Choose a tool that is easy to use and quick to set up. At Atatus, we keep things simple. Our tool is easy to use with a friendly interface and quick setup.
- Features: Evaluate the features offered by the alternative tool and compare them with Sentry. Consider aspects such as error tracking, real-time monitoring, alerting mechanisms, integrations with other tools and platforms.
- Pricing: Be mindful of the pricing details for each tool before making a choice. Some, like Datadog are based on complex billing structure, while others like Atatus may offer more straightforward pricing schemes.
- Alerting: Ensure that the tool offers effective alerting solutions that notify developers of critical issues. Effective alerting ensures timely responses to problems, minimizing downtime.
Final Thoughts
In this blog, we have discussed a range of top Sentry alternatives, providing developers with a diverse selection to choose from based on their specific needs, including observability. Each alternative offers unique features customised to different aspects of error tracking and application performance monitoring.
With these Sentry alternatives, developers can ensure their applications remain reliable and user-friendly, effectively addressing any challenges that may arise during development and deployment.
Monitor Your Entire Application with Atatus
Atatus is a Full Stack Observability Platform that lets you review problems as if they happened in your application. Instead of guessing why errors happen or asking users for screenshots and log dumps, Atatus lets you replay the session to quickly understand what went wrong.
We offer Application Performance Monitoring, Real User Monitoring, Server Monitoring, Logs Monitoring, Synthetic Monitoring, Uptime Monitoring and API Analytics. It works perfectly with any application, regardless of framework, and has plugins.

Atatus can be beneficial to your business, which provides a comprehensive view of your application, including how it works, where performance bottlenecks exist, which users are most impacted, and which errors break your code for your frontend, backend, and infrastructure.
If you are not yet a Atatus customer, you can sign up for a 14-day free trial .
#1 Solution for Logs, Traces & Metrics
![]() APM
APM
![]() Kubernetes
Kubernetes
![]() Logs
Logs
![]() Synthetics
Synthetics
![]() RUM
RUM
![]() Serverless
Serverless
![]() Security
Security
![]() More
More

![New Relic vs Sentry - Which Monitoring Tool to Choose? [2025]](/blog/content/images/size/w960/2024/10/VS--1-.png)