AWS X-Ray vs Jaeger - Choosing the Right Distributed Tracing Tool
Distributed tracing has become an essential part of any application's performance monitoring strategy. As businesses adopt distributed architectures, choosing the right tracing tool is crucial for efficient troubleshooting and performance monitoring.
The two most prominent choices are AWS X-Ray and Jaeger, each offering unique features and advantages. AWS X-Ray, a managed service by Amazon, simplifies tracing for applications running on AWS. Jaeger, developed by Uber and open-sourced in 2015, is a popular tool in cloud-native environments.
But which one is the best fit for your needs? In this blog, let us compare AWS X-Ray with Jaeger, concentrating on their architecture, use cases, community support and much more to help you make the best decision.
In this blog post,
- What is Distributed tracing?
- What is AWS X - Ray?
- What is Jaeger?
- AWS X-Ray vs Jaeger: Comparison
- When to Choose AWS X-Ray
- When to Choose Jaeger
- Final Verdict: AWS X-Ray vs Jaeger
- Important Factors to Consider When Choosing a Distributed Tracing Tool
- Advanced Tracing with Atatus: A Better Alternative
Before getting into the actual comparison of tools, let’s briefly discuss what distributed tracing is.
What is Distributed tracing?
Distributed tracing is a method used to track and monitor requests as they flow through various services in a distributed system.
In distributed systems like microservices architecture, a single user request initiates a series of interactions across multiple interconnected services.
This approach offers a comprehensive view of how requests travel through different services, aiding in better understanding and monitoring of complex interactions.
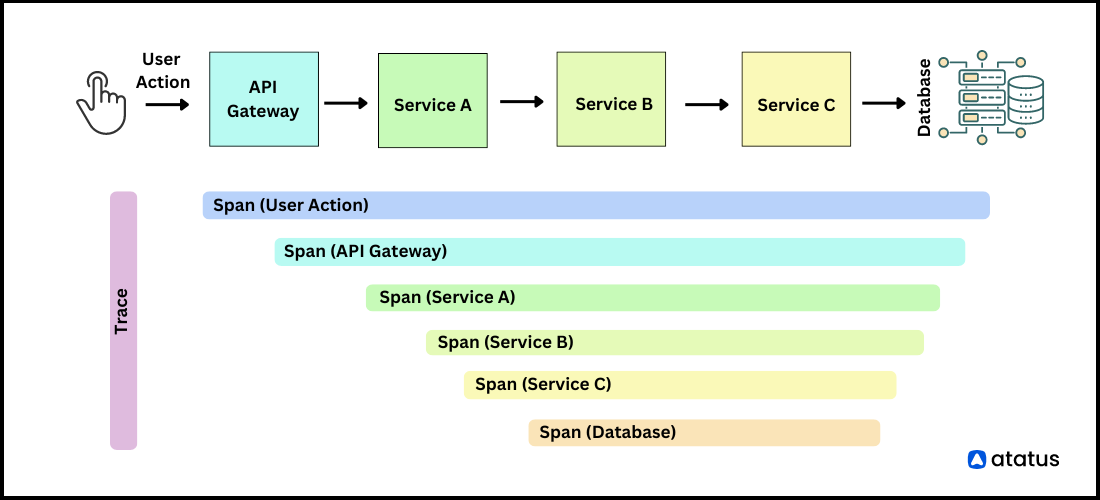
Trace and Span play crucial roles in capturing and representing the journey of a user request through multiple services in a microservices architecture.
- A trace represents the complete journey of a request as it moves through various components of a distributed system. It is composed of multiple spans.
- A span represents a single unit of work or operation within a trace. It includes information like the start time, end time, and duration of the operation.
What is AWS X - Ray?
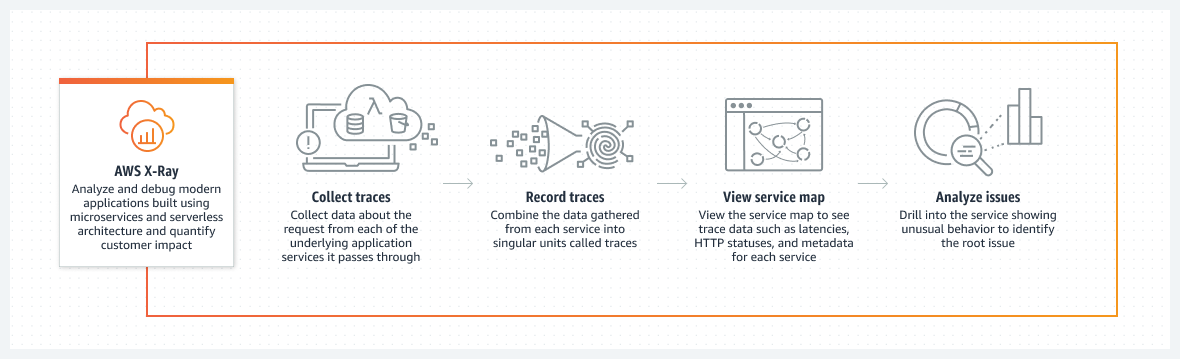
AWS X-Ray is Amazon's distributed tracing solution that provides a complete view of how requests move through your application.
It is designed to help developers analyse and debug distributed applications, especially those using a microservices architecture.
With AWS X-Ray, you can filter and visualize data across various components like payloads, functions, traces, services, and APIs, all while requiring minimal or no coding.
Key Features
- Deep AWS Integration: Seamlessly integrates with AWS services like Lambda, EC2, ECS, and CloudWatch, offering comprehensive monitoring across AWS resources.
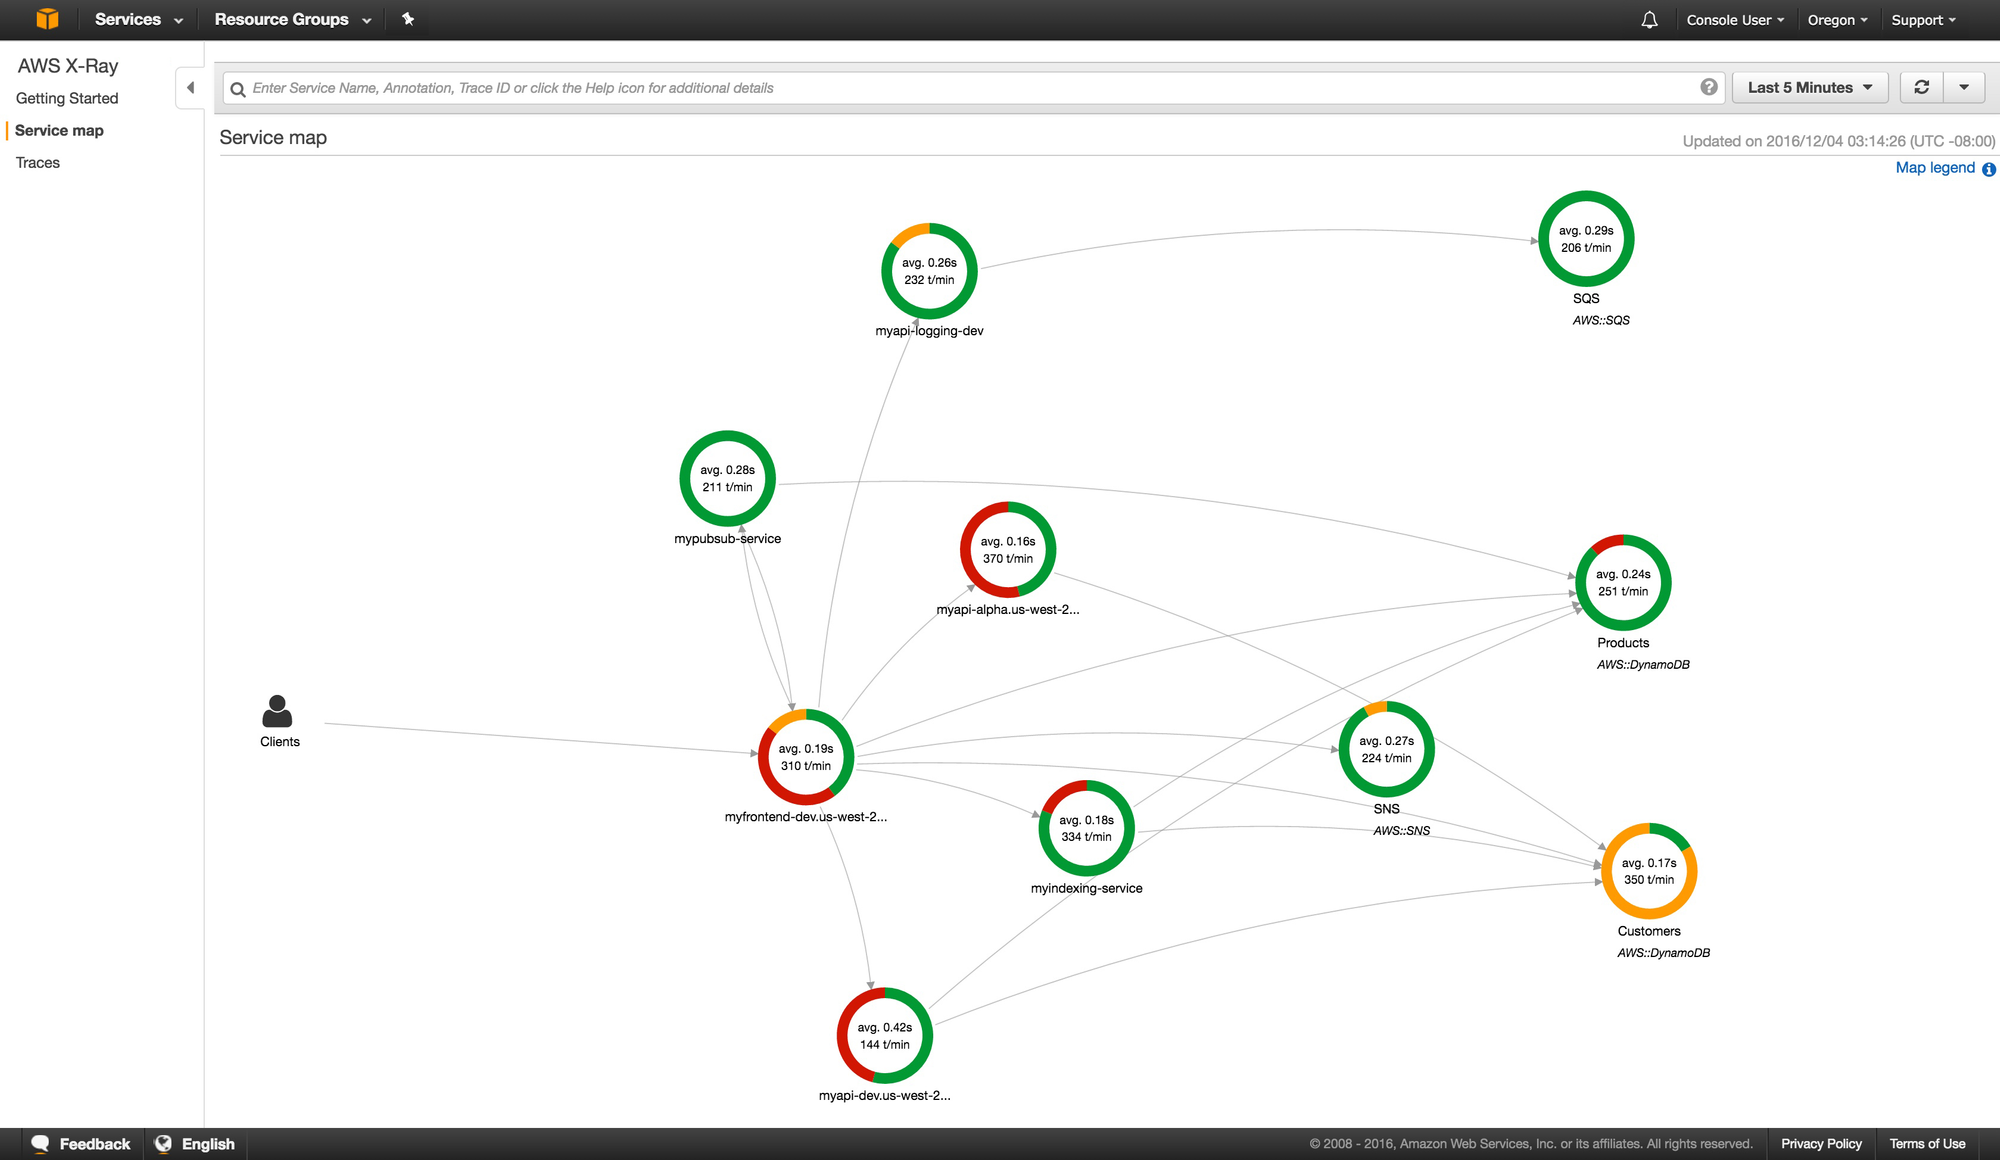
- Service Map Visualization: Automatically generates visual representations of application architecture, mapping service interactions.
- Built-in Sampling and Analysis Tools: Provides out-of-the-box trace sampling, making it easier to manage trace volumes and analyse performance issues.
- Simplified Setup: Optimized for AWS applications, reducing the configuration burden.
- Cost-Effective: Free-tier availability for small to medium AWS-based projects.
What is Jaeger?
Jaeger is an open-source, end-to-end distributed tracing system designed to monitor and troubleshoot microservices-based applications.
Jaeger trace requests as they propagate across multiple services, allowing visibility into how requests travel through a distributed system.
Jaeger helps developers and DevOps teams trace the flow of requests through complex systems, allowing them to pinpoint bottlenecks, optimize performance, and debug issues that arise in microservices architectures.
Key Features
- Multi-language Support: Supports multiple languages like Java, Go, Python, Node.js, C++, and C#.
- Adaptive Sampling: Adjusts sampling rates dynamically based on traffic patterns, improving performance monitoring in high-traffic environments.
- Data Pipeline Flexibility: Supports various backends like Elasticsearch, Cassandra, and Kafka, allowing flexible storage options.
- Service Performance Monitoring: Provides service-level metrics by aggregating trace data, offering insights into system bottlenecks.
- Extensibility: Easily integrates with frameworks like Spring Boot, gRPC, and Express.js.
AWS X-Ray vs Jaeger: Comparison
Architecture
AWS X-Ray:
AWS X-Ray provides tight coupling with AWS services, making it an ideal choice for applications built on the AWS platform.
It is pre-configured for AWS environments, requiring minimal manual setup for collecting and managing traces effectively.
Additionally, AWS X-Ray visualizes traces through service maps that offer a comprehensive overview of service interactions, execution times, and potential bottlenecks, enhancing the overall monitoring experience.
Jaeger:
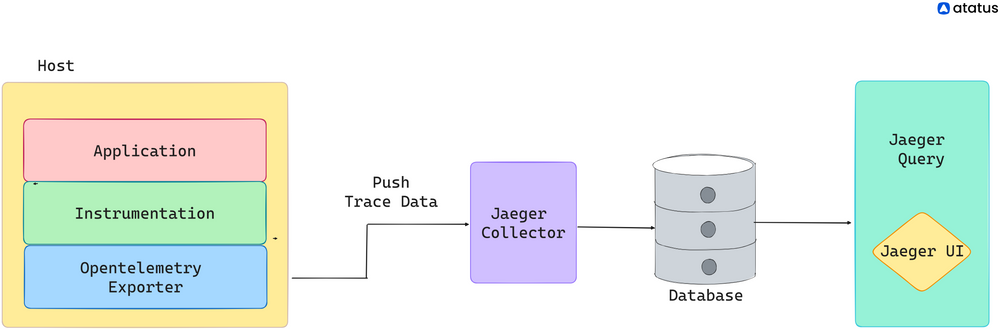
Jaeger utilizes a distributed architecture, where agents collect traces and forward them to collectors for storage and analysis.
It is specifically designed for highly scalable environments, making it suitable for large-scale microservices architectures.
By buffering traces locally, Jaeger minimizes data loss during network interruptions, ensuring reliable trace collection and analysis even in challenging conditions.
User Interface and Visualization
AWS X-Ray:
- Offers built-in visualization tools, automatically creating service maps that help developers visualize their AWS application's architecture, dependencies, and performance.
- Integration with CloudWatch enhances the observability by correlating trace data with logs and metrics.
Jaeger:
- Provides a feature-rich UI with advanced querying capabilities to investigate traces deeply.
- Supports modern visualization tools and dashboards to analyse service-level metrics and trace data, aiding in root cause analysis.
Use Cases
AWS X-Ray:
- Ideal for AWS-Centric Applications: X-Ray excels in environments where most services are AWS-based. Its deep integration with AWS services like Lambda, ECS, and CloudWatch makes it a natural choice for developers within the AWS ecosystem.
- Small to Medium Projects: For projects with limited scale, X-Ray offers a cost-effective option thanks to its integration with AWS Free Tier.
Jaeger:
- Large-Scale Microservices Systems: Jaeger is designed for high trace volumes and works well in large, complex distributed systems.
- Kubernetes Ecosystem: For organizations heavily invested in Kubernetes, Jaeger's support for sidecar and daemonset deployment patterns makes it a better fit.
- Advanced Querying and Analysis: Ideal for teams requiring detailed trace analysis, Jaeger's UI and storage flexibility support in-depth investigations.
Performance and Scalability
AWS X-Ray:
As AWS X-Ray is limited to AWS environments, scalability is based on AWS infrastructure. It works efficiently for tracing within AWS but may face limitations outside this ecosystem.
Jaeger:
Jaeger is designed for high scalability, supporting large-scale microservices with significant trace volumes. It offers more flexibility for both on-premises and cloud environments, including multi-cloud and Kubernetes deployments.
Community and Support
AWS X-Ray:
- Backed by AWS and its vast ecosystem, X-Ray benefits from continuous updates, support, and community engagement within the AWS developer community.
- AWS also provides extensive documentation and resources for AWS customers.
Jaeger:
- Backed by the CNCF, Jaeger has a large, active open-source community with continuous contributions.
- It also benefits from integration with OpenTelemetry, making it highly flexible and vendor-agnostic.
Cost Considerations
AWS X-Ray:
Integrated with the AWS Free Tier, AWS X-Ray is cost-effective for smaller projects and startups running AWS-centric applications. Costs may scale with higher traffic and more complex environments but remain competitive for AWS services.
Jaeger:
As an open-source solution, Jaeger can be more cost-effective for large-scale operations, especially when deployed in self-managed environments (e.g., Kubernetes). However, organizations may need to invest in infrastructure and storage to support its deployment.
When to Choose AWS X-Ray
- Best for projects heavily relying on AWS services like Lambda, EC2, ECS, or RDS.
- X-Ray’s simplified setup and free-tier integration make it a good choice for small to medium AWS-based projects.
- Automated service map visualization provides quick insights into service interactions without manual configuration.
When to Choose Jaeger
- If your system involves many microservices or has a large trace volume, Jaeger’s scalability will be more suitable.
- Jaeger’s native support for Kubernetes (through sidecar and daemonset models) makes it ideal for teams using Kubernetes.
- Jaeger offers deeper querying capabilities and greater flexibility in managing traces across multi-cloud or hybrid infrastructures.
Final Verdict: AWS X-Ray vs Jaeger
AWS X-Ray is the best option for applications deeply integrated with AWS services, offering simple setup, cost-effectiveness, and deep integration with AWS monitoring tools.
Jaeger excels in large-scale, complex environments where flexibility, scalability, and advanced querying capabilities are essential, especially for organizations invested in Kubernetes or open-source solutions.
Important Factors to Consider When Choosing a Distributed Tracing Tool
- Is your app built with microservices, containers, or serverless? Different setups need different tracing strategies.
- Are you using only AWS, multiple cloud platforms, or on-premises servers? Your cloud setup affects which tool is best.
- Think about your team’s experience with the tools and how easy they are to learn.
- Look at the long-term costs, including the risk of being tied to one cloud provider.
- Make sure the tool can handle your current and future needs.
- Check how well the tool works with your existing technology and other monitoring tools.
Both AWS X-Ray and Jaeger are excellent options for distributed tracing. However, are traces sufficient to address all performance issues in a modern distributed application? The answer is no.
You also need metrics and a method to correlate those metrics with traces within a single dashboard. This is where Atatus comes into play.
Advanced Tracing with Atatus: A Better Alternative
While AWS X-Ray and Jaeger are powerful tracing tools, Atatus stands out by delivering a complete observability platform that integrates distributed tracing, metrics, and logs into a unified experience.
Atatus offers a comprehensive Full-Stack Observability platform that unifies traces, metrics, and logs into a single view, simplifying monitoring and troubleshooting across the entire stack. With native support for OpenTelemetry standards, Atatus ensures seamless compatibility with modern observability setups, making it easier for teams to integrate and maintain.
Atatus helps you identify the slowest endpoints in your application by showing the exact request trace, making it easier to pinpoint issues. You can filter traces by service name, operation, latency, and errors. It also lets you run aggregates on trace data, all within a unified UI that combines both metrics and traces for seamless monitoring.
The platform stands out with its advanced visualization features, offering rich, interactive dashboards that enable deep analysis and quick access to actionable insights. Additionally, customizable alerts can be set up based on trace data and service performance, ensuring prompt notifications of any critical issues.
Atatus offers a more cost-effective solution, making it an excellent choice for organizations seeking an affordable observability platform.
New to Atatus? Sign up for a 14 day free trial.
#1 Solution for Logs, Traces & Metrics
![]() APM
APM
![]() Kubernetes
Kubernetes
![]() Logs
Logs
![]() Synthetics
Synthetics
![]() RUM
RUM
![]() Serverless
Serverless
![]() Security
Security
![]() More
More