Application Performance Monitoring
In business, the idea of measuring what you are doing, picking the measurements that count like customer satisfaction and performance you thrive on that - Bill Gates
What is Application Performance Monitoring (APM)?
Application Performance Monitoring enables the site owners to monitor and measure the performance and efficiency of their business applications to ensure whether their application performs up to the level defined. Using application performance monitoring you can discern and pinpoint the performance-related issues or any other abnormalities that arise in your application before your end-user experiences it. Get to know your bugs or errors at the earliest possible moment. A good APM tool gives wide and deep visibility on inner workings of your system running in production.
Always move fast...you never know who’s catching up! - Terry Pratchett
Additionally, application performance monitoring also provides detailed information about issues such as when, where and why does the problem occur. This makes it much easier for the developers to reproduce and resolve the issues without any delay and optimize your application performance.

Why do we need Application Performance Monitoring (APM)?
In this present era, the application has become the most important part of every organization. There are so many changes done in each of the applications in an organization and every organization should consider the performance and errors that happen on their applications. The ultimate goal of every organization is to provide their end-users with the premium quality user-experience. When your application decelerates, you need to determine the root cause of the hitch to resolve the issue as soon as possible.
There are many complexities in the application development process and therefore the developers have to test their applications for robustness. Mistakes are common but it may also cause serious trouble so everything needs to be monitored consistently for their issues. In most instances, a bug might have been left unnoticed while we were busy working with other tasks which might cause severe issues or downtime. Application Performance Monitoring reduces this risk. APM detects and identifies errors and notifies using which we can segregate and reproduce the bugs to resolve them.
By monitoring application performance you can gather the following,
- your application works as expected
- your application slows down while any transaction is being processed
- if there are any issues in the server, network, db queries or in any external requests
- were there HTTP failures and what is the cause of them
- when exceptions happen, which users were impacted and what was the root cause of it
How Application Performance Monitoring (APM) works?
Most of the languages don't support by default to measuring time of individual functions, database call and external requests. Even if they do, we would still need a portal to store and view these metrics in production environment. So if a programmer has to measurement, they have to add code before and after to measure time of every component in the app.
The APM agents eliminate this nightmare by monkey wrapping all functions and database calls. So you need to include the agent in your code or the agent hooks into the language's monitoring hook automatically to start measuring each route, db query, HTTP status codes etc. Doing this, of course adds a small overhead as the APM agent still executes code over your application code.
To be honest, APM agent overhead is something that should be considered, and in Atatus we have taken utmost care to keep it at the minimum - between 10 - 30 ms, not more than that. Also APM agents should be updated whenever new library and runtime are released, as the wrapping of function calls would change.
The error crashes and exceptions are collected by hook into the main exception handler, by which we can collect the stack trace, there by the exact line of code where an error arises. The APM agent logs all these exceptions and sends the detailed report with each metrics for further analysis by the developer.
The agent wraps across each Database Query and External Request calls, to detect slow running queries and groups them according to the operation and type of the database. This gives a detailed insight into which calls to your DB are the bottlenecks and which queries were being used in the routes.
Thus with Application Performance Measurement you can gain insights on real-time performance monitoring for your business to increase the performance and boost your revenue.
What you get from Application Performance Monitoring (APM)?

- Monitoring application performance ensures whether your application works in an appropriate manner all the time.
- Identify, detect issues and collect data regarding the issue.
- Analyze database queries and slow query causes
- Look into HTTP Failures and how it impacts your users
- Find out which external calls are slower and which parameters causes these issues
- Measure deployments and look for regression of issues & performance
- Alert abnormal issue in your application
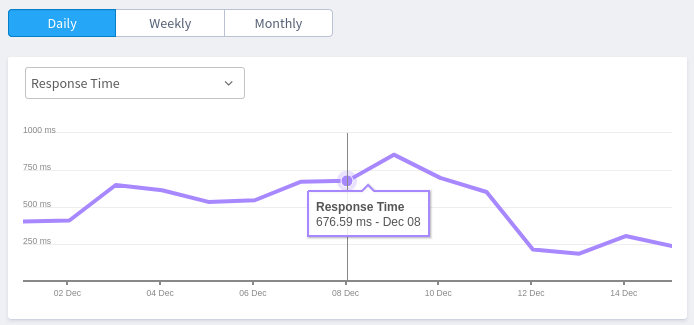
- SLA Report, to look into historical performance of your application over the days, weeks, months.
With this, you can troubleshoot all the performance-related issues and optimize the performance of your application in every aspect and deliver the perfect application.
Metrics in APM
General set of metrics that you shall look for in Application Performance Monitoring
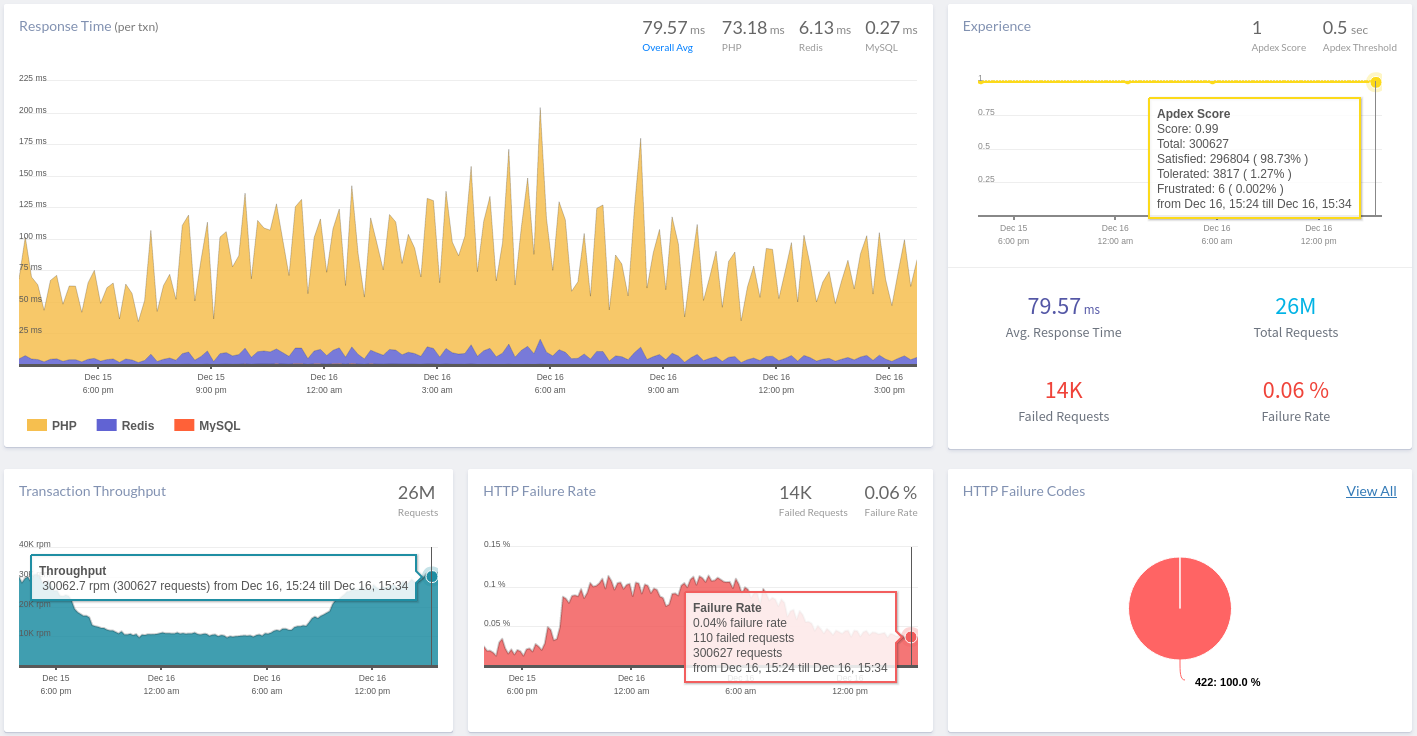
- User satisfaction/Apdex score - User satisfaction is measured to give a value between 0-1 to identify most of your users get response within a defined threshold
- Response time - Measures how long it takes for a response to return back from the application for its respective requests.
- Exceptions rates - It is a metric which measures the performance breakdown and let you know the number of crashes that took place in web application.
- HTTP failure rates - It is the total number of HTTP errors occurred in your application.
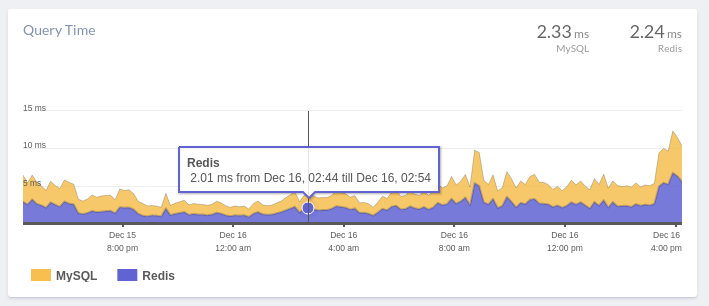
- Database query time - You can find the query that occupies most of your application's time and which slows down your app's performance using this metric.
- External service response time - Measures all the external requests that slows down your app performance.
- Slowest traces - Identifies and let you know the slowest calls and the functions that caused this slow performance.
- Deployment tracking metrics - This metric keeps track of every deployments and notifies the issues before it could affect your old deployments.
- SLA report - You get the metrics across the time you have monitored, so that you can see how your application had been performing over the course of time.

Conclusion
With Application Performance Monitoring (APM) you can quickly identify and resolve performance degradation / errors before your user could experience it which will increase your traffic, have a better SEO ranking and there by boost the revenue of your organization. Monitoring application performance will get a deeper visibility on each complex issue that your application has and with Atatus you can identify the bottlenecks in your application and optimize your user-experience. Get to know the errors from edge to the core and analyze them properly before resolving it.
Try Atatus Application Performance Monitoring with free 14 day trial – no credit card required. If you have any questions, we’d love to hear from you.
#1 Solution for Logs, Traces & Metrics
APM
Kubernetes
Logs
Synthetics
RUM
Serverless
Security
More


![New Relic vs Splunk - In-depth Comparison [2025]](/blog/content/images/size/w960/2024/10/Datadog-vs-sentry--19-.png)
![New Relic vs Sentry - Which Monitoring Tool to Choose? [2025]](/blog/content/images/size/w960/2024/10/VS--1-.png)
