Top API Monitoring Tools - [2025 Guide]
![Top API Monitoring Tools - [2025 Guide]](/blog/content/images/size/w960/2024/05/API-monitoring-tools--1--1.png)
API monitoring is a process that involves regularly checking the status and performance of APIs to ensure they are functioning correctly. APIs are crucial for the internet, and businesses depend on them extensively. The well-being of APIs directly impacts business success.
Considering the importance of API monitoring, it is essential to select the right monitoring tool. But how can you determine which API monitoring tool is the best fit for your needs? This blog will walk you through the process step by step, making it easy to find the perfect fit for you.
Before we explore the API monitoring tools, let's quickly go over different approaches to monitor APIs. As we wrap up, we will discuss how to choose the ideal monitoring tool for API monitoring based on your specific needs.
Approaches to Monitor APIs
As we manage our APIs, we often wonder how to keep track of their performance. By setting up good monitoring, we can find answers to these questions. So, what are the ways we can do this? Let's learn about the approaches for monitoring APIs and understand how they differ.
| Monitoring Type | What it does | How it works | Benefits |
|---|---|---|---|
| Synthetic Monitoring | Synthetic monitoring creates artificial user interactions with the application | Uses scripted scenarios to act like a real user, generating synthetic traffic and measures response times and errors | Helps catch bugs before they affect real users, saving time, maintaining trust, and ensuring a reliable experience for users everywhere |
| Real User Monitoring (RUM) | Tracks real user interactions with the application | Captures data from actual user sessions, including page load times, clicks, and errors encountered | Reveals exactly how users experience the application, helping teams prioritize fixes that directly impact users |
| API Analytics | API analytics tools monitor, analyze, and interpret data related to the usage, performance, and behavior of APIs | collect and analyze data from API requests, responses, and logs, employing various metrics and analytic techniques | Identifies areas for improvement, guides important decisions, and enhances security |
So based on this approach here's the list of top API monitoring tools:
1. Atatus
Atatus is a comprehensive full-stack monitoring tool, that can be used for effective API monitoring. Atatus integrates all three key approaches to API monitoring: Synthetic Monitoring, Real User Monitoring, and API Analytics.
- Atatus enables you to simulate API calls with Synthetic Monitoring, ensuring optimal performance under various conditions.
- It captures actual user interactions with Real User Monitoring, providing insights into real-world API usage.
- It offers deep visibility into API usage and customer behaviour with API Analytics.
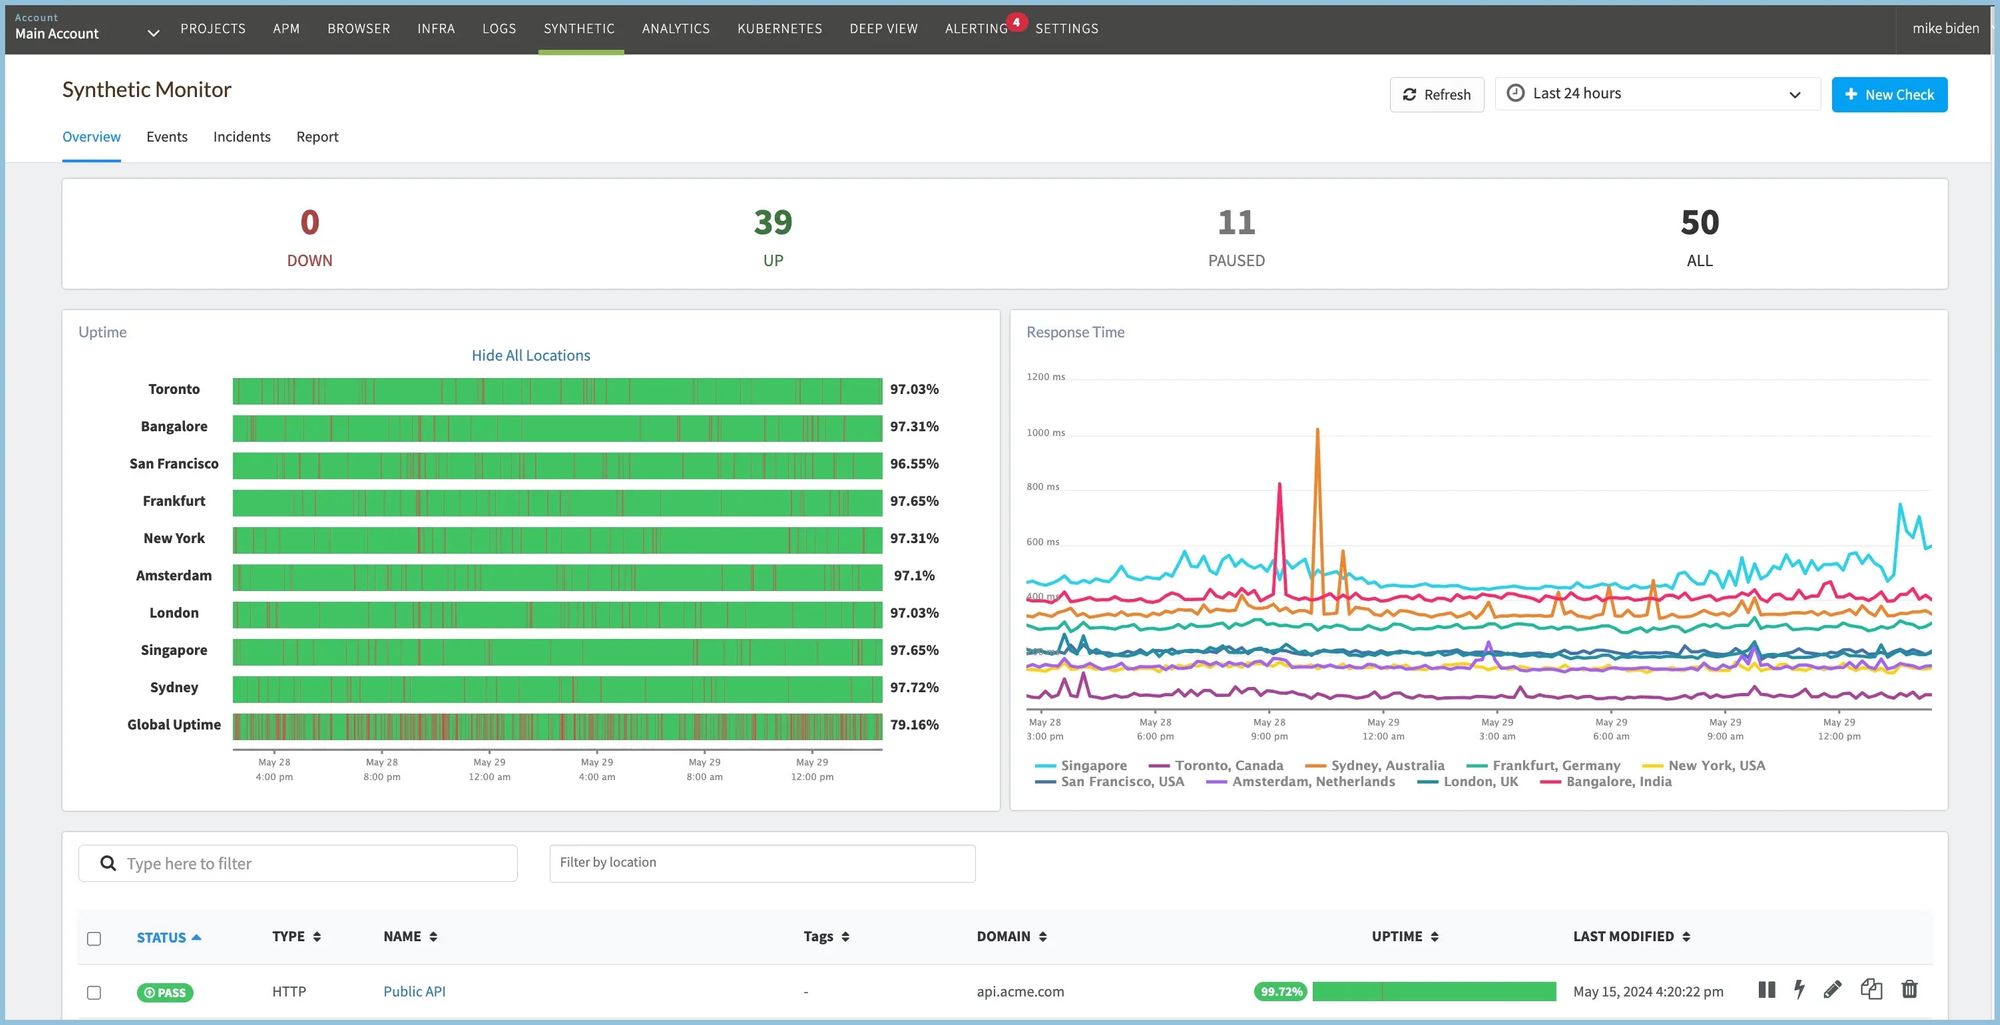
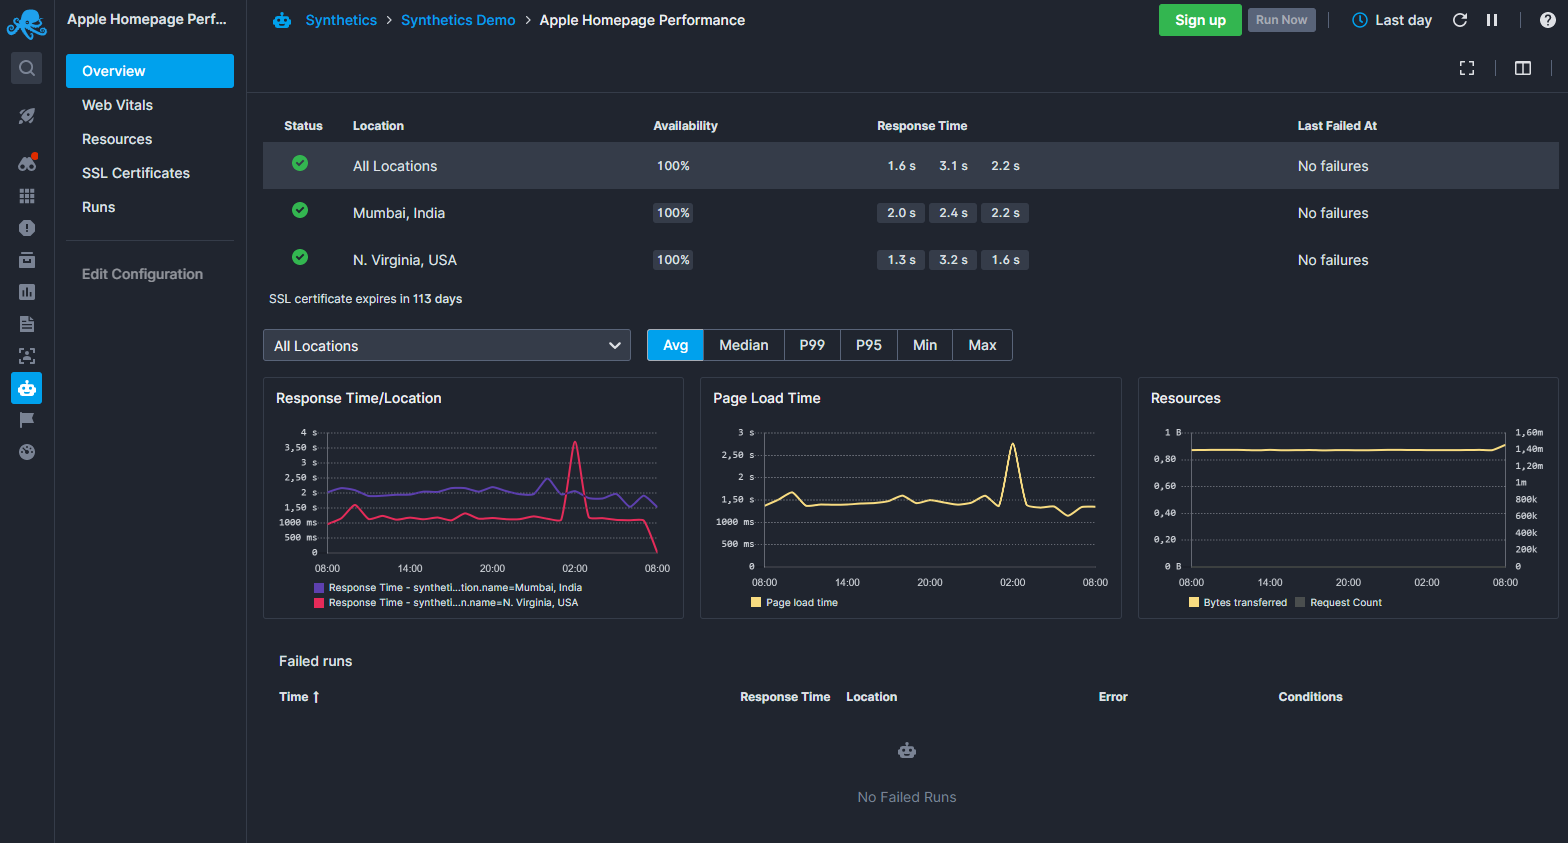
(i). Synthetic Monitoring
Atatus Synthetic Monitoring ensures availability and uptime across endpoints by simulating user API calls on your applications. It achieves this by periodically sending requests to the APIs just like an actual user would.
It measures the response time of API calls, detecting any performance slowdown or latency issues. Atatus tracks database calls to prevent them from slowing down your application. This feature ensures smooth API performance, making atatus an effective tool for API monitoring.
Key Features:
- Customized Alert Conditions: Customers can customize alert conditions based on the number of retry attempts and the locations where failures occur. This ensures that your team is promptly notified about critical API errors.
- Flexible API Monitoring: It allows you to monitor either a single API request or a sequence of API endpoints with ease.
- Multistep API Testing: Multistep API tests check all API endpoints in your application and identify potential performance issues.
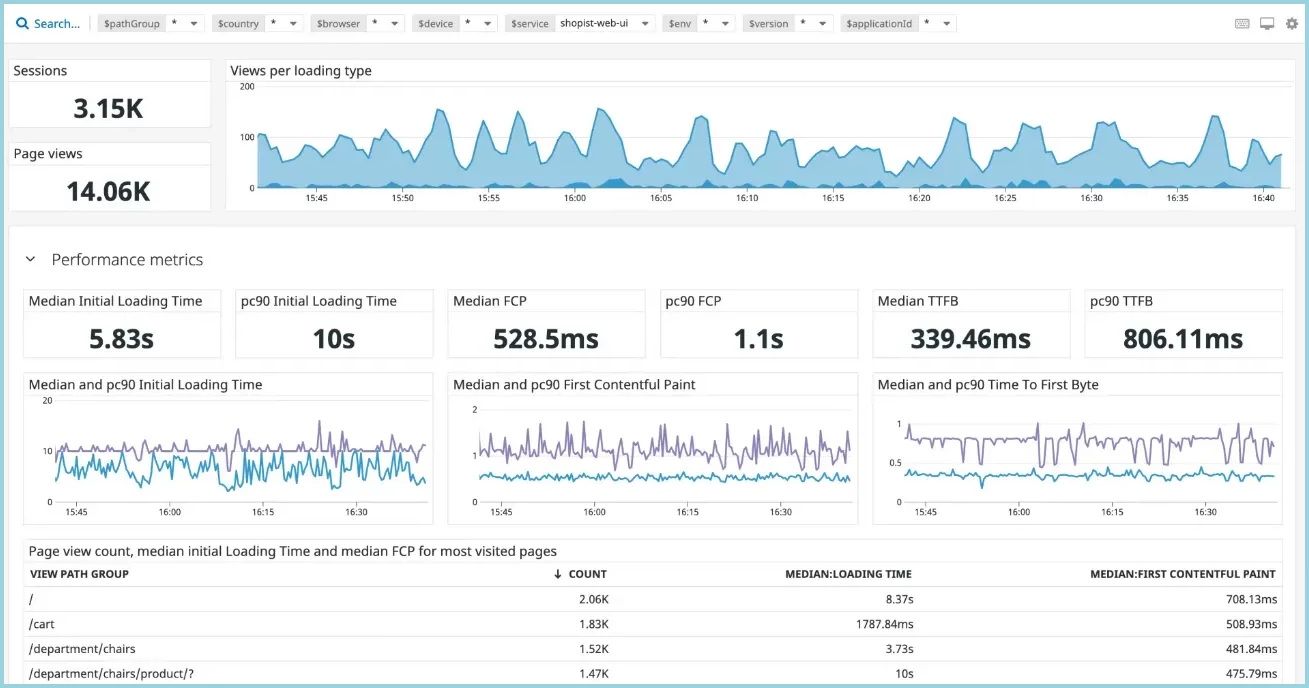
(ii). Real User Monitoring
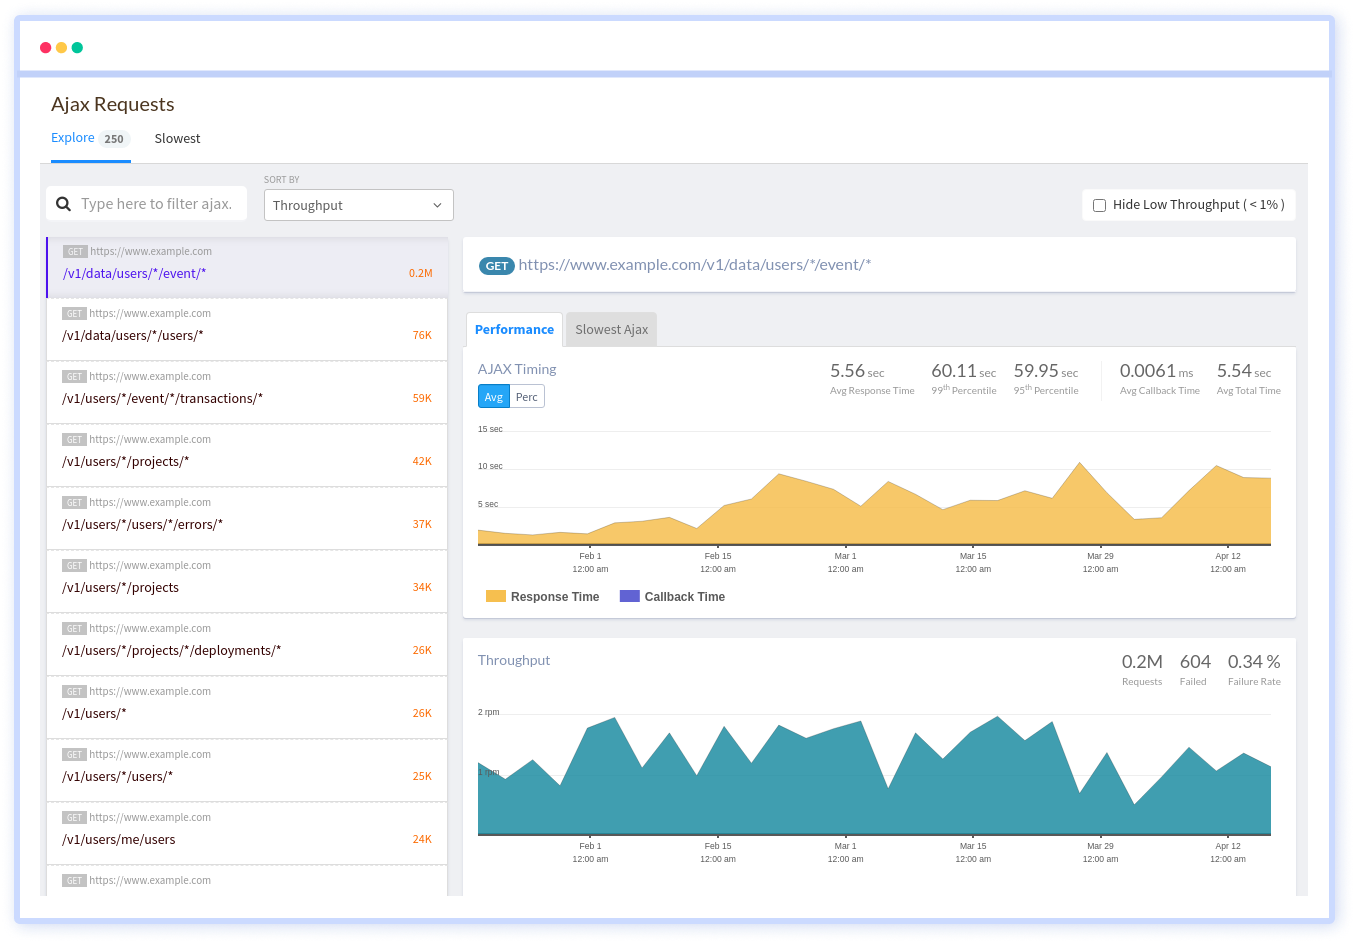
Atatus Real User Monitoring offers clear visibility into your API performance in real-world situations, helping you spot and fix issues before they affect your users. It monitor key performance metrics such as Page load time, error rates, and throughput.
Atatus monitors crucial metrics like LCP, FCP, and other core web vitals to optimize API performance. This ensures faster loading times, smoother interactions, and better user experience.
Key Features:
- It provides full visibility into AJAX requests, showing individual metrics for each network call, including response times, transfer sizes, and errors.
- It tracks API throughput, measuring the rate at which requests are processed by the API.
(iii). API Analytics
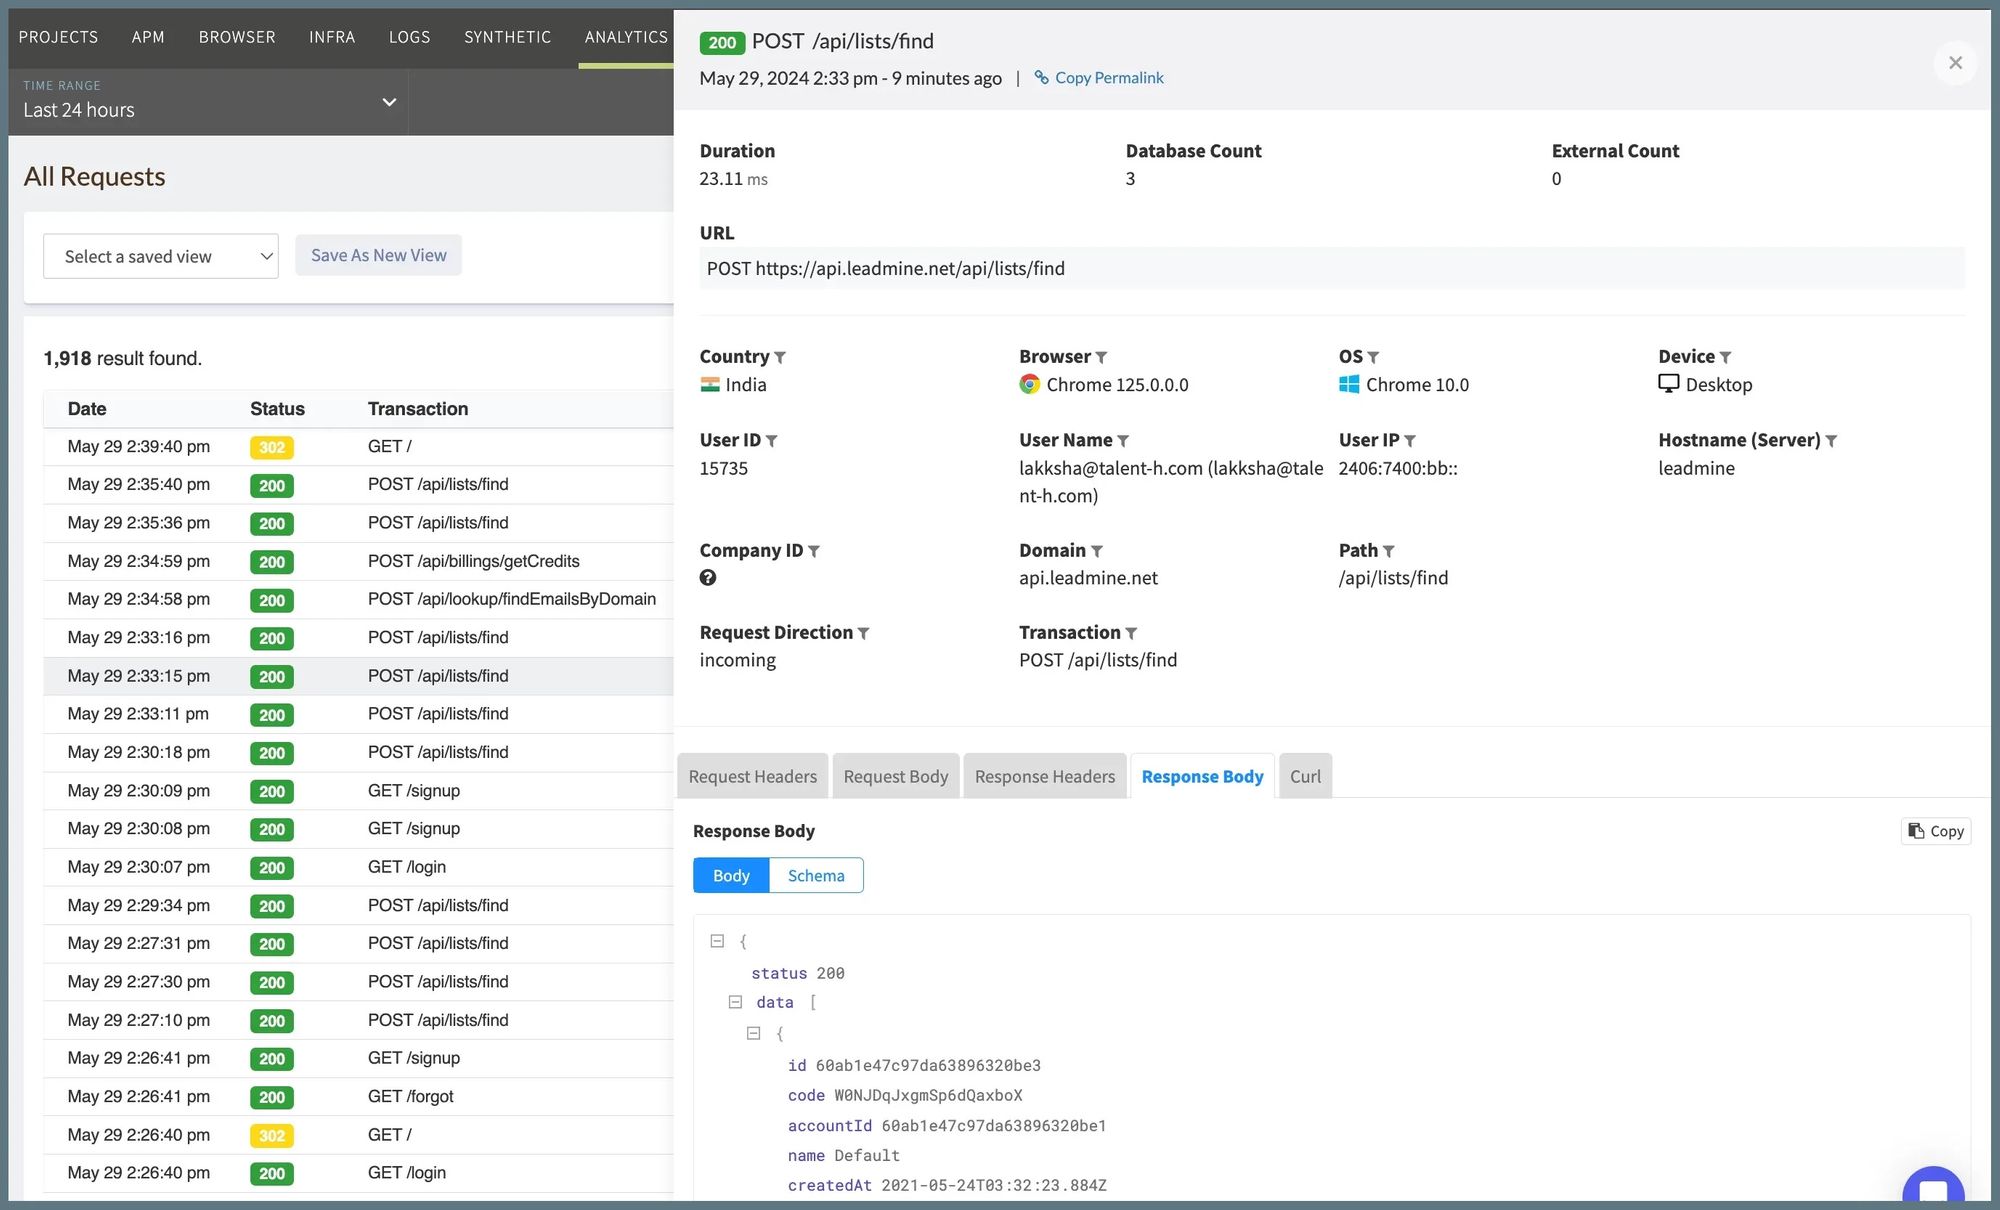
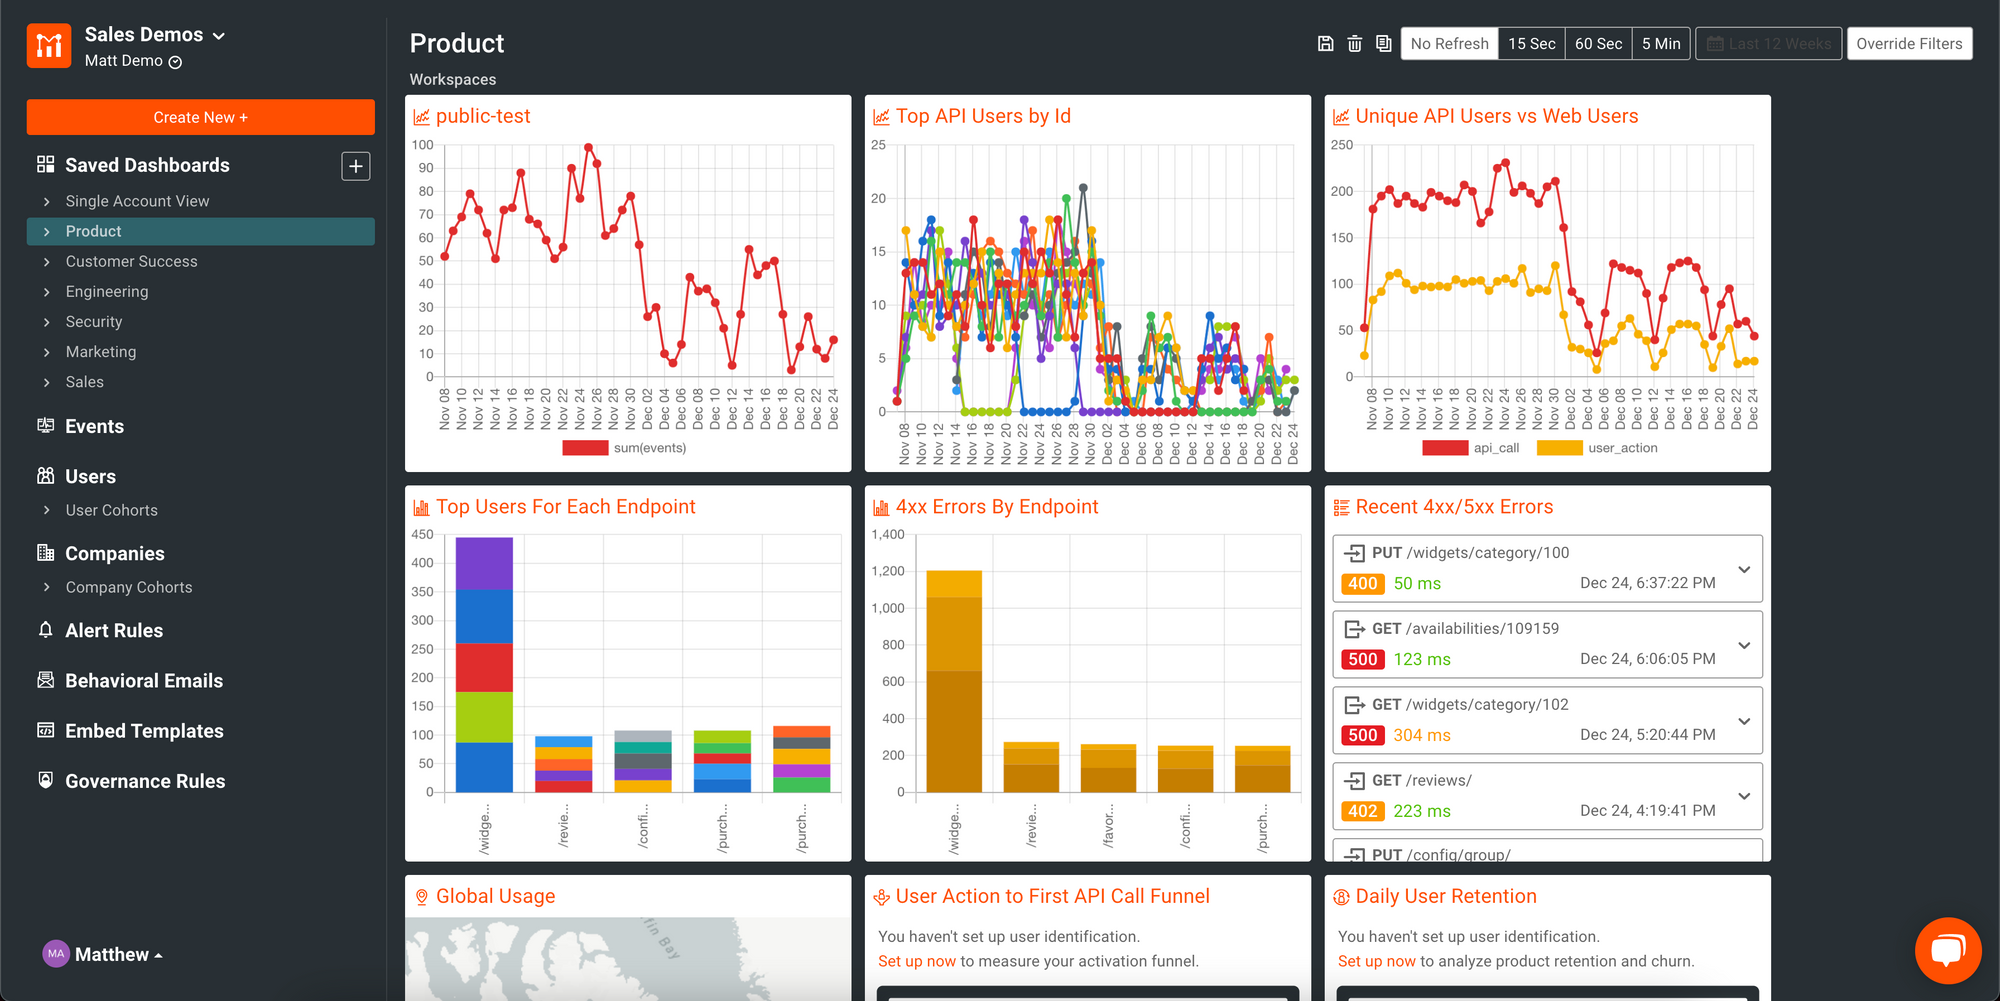
Atatus API Analytics is designed to monitor and optimize the performance of APIs. Gain valuable insights into how your customers utilize your APIs and monitor all API requests, including their respective request and response payloads.
Analysing API usage data, including user identification and utilization patterns, reveals how products or services are utilized. It includes metrics like response time, external and database counts.
Key Features:
- Track personalized consumption and success metrics for your entire customer base effortlessly with customizable dashboards designed to your needs.
- Effortlessly access and analyse API performance metrics with predefined segmentations, optimizing performance as API usage grows.
- Easily track changes in customer usage and identify which customers exceed their API call limits for accurate billing.
2. Datadog
Datadog integrates two approaches to API monitoring: Synthetic Monitoring and Real User Monitoring.
(i). Datadog Synthetic Monitoring tests the availability and responsiveness of every endpoint in your API, including HTTP, gRPC, SSL, DNS, WebSocket, TCP, UDP, and ICMP, from global and private locations.
It measures response time, status codes, and more, allowing for multistep testing to ensure your API endpoints handle traffic efficiently at each step.
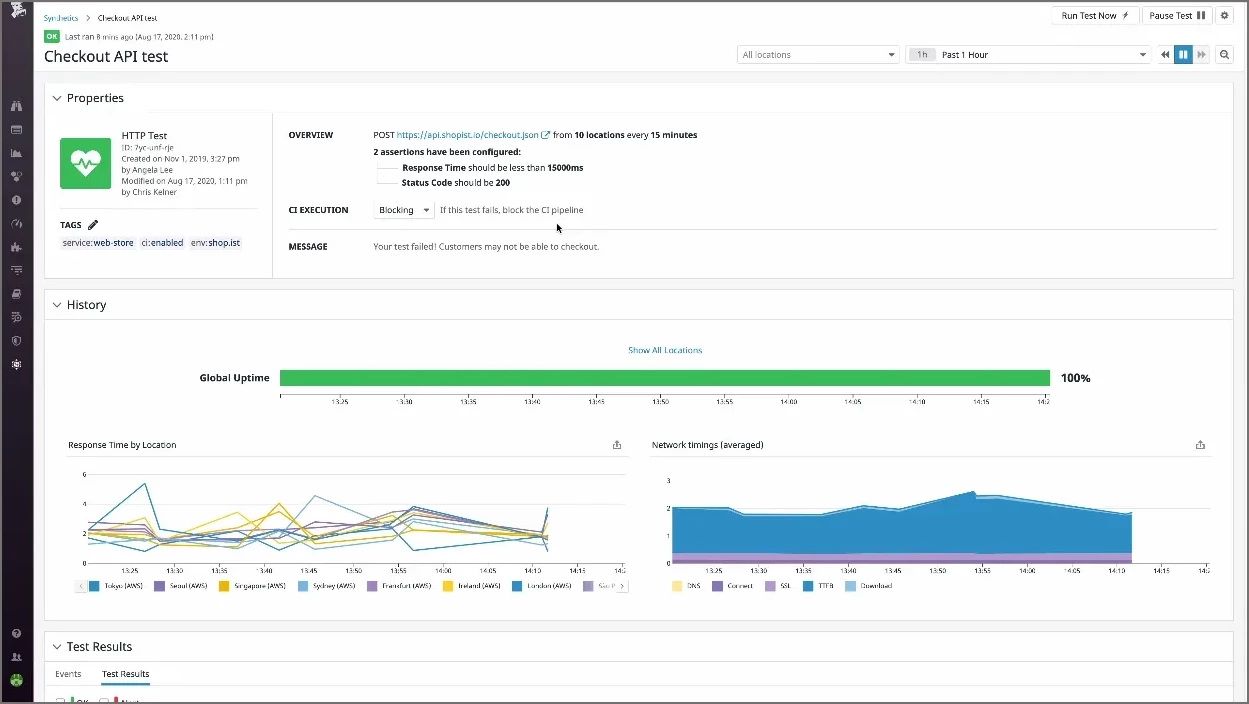
Features:
- Monitor response time, error rates, and request throughput to ensure API reliability and performance.
- Track SSL/TLS certificate validity and ensure secure communication to protect user data.
- Set up customizable alerts to detect and respond to issues quickly, preventing potential downtime.
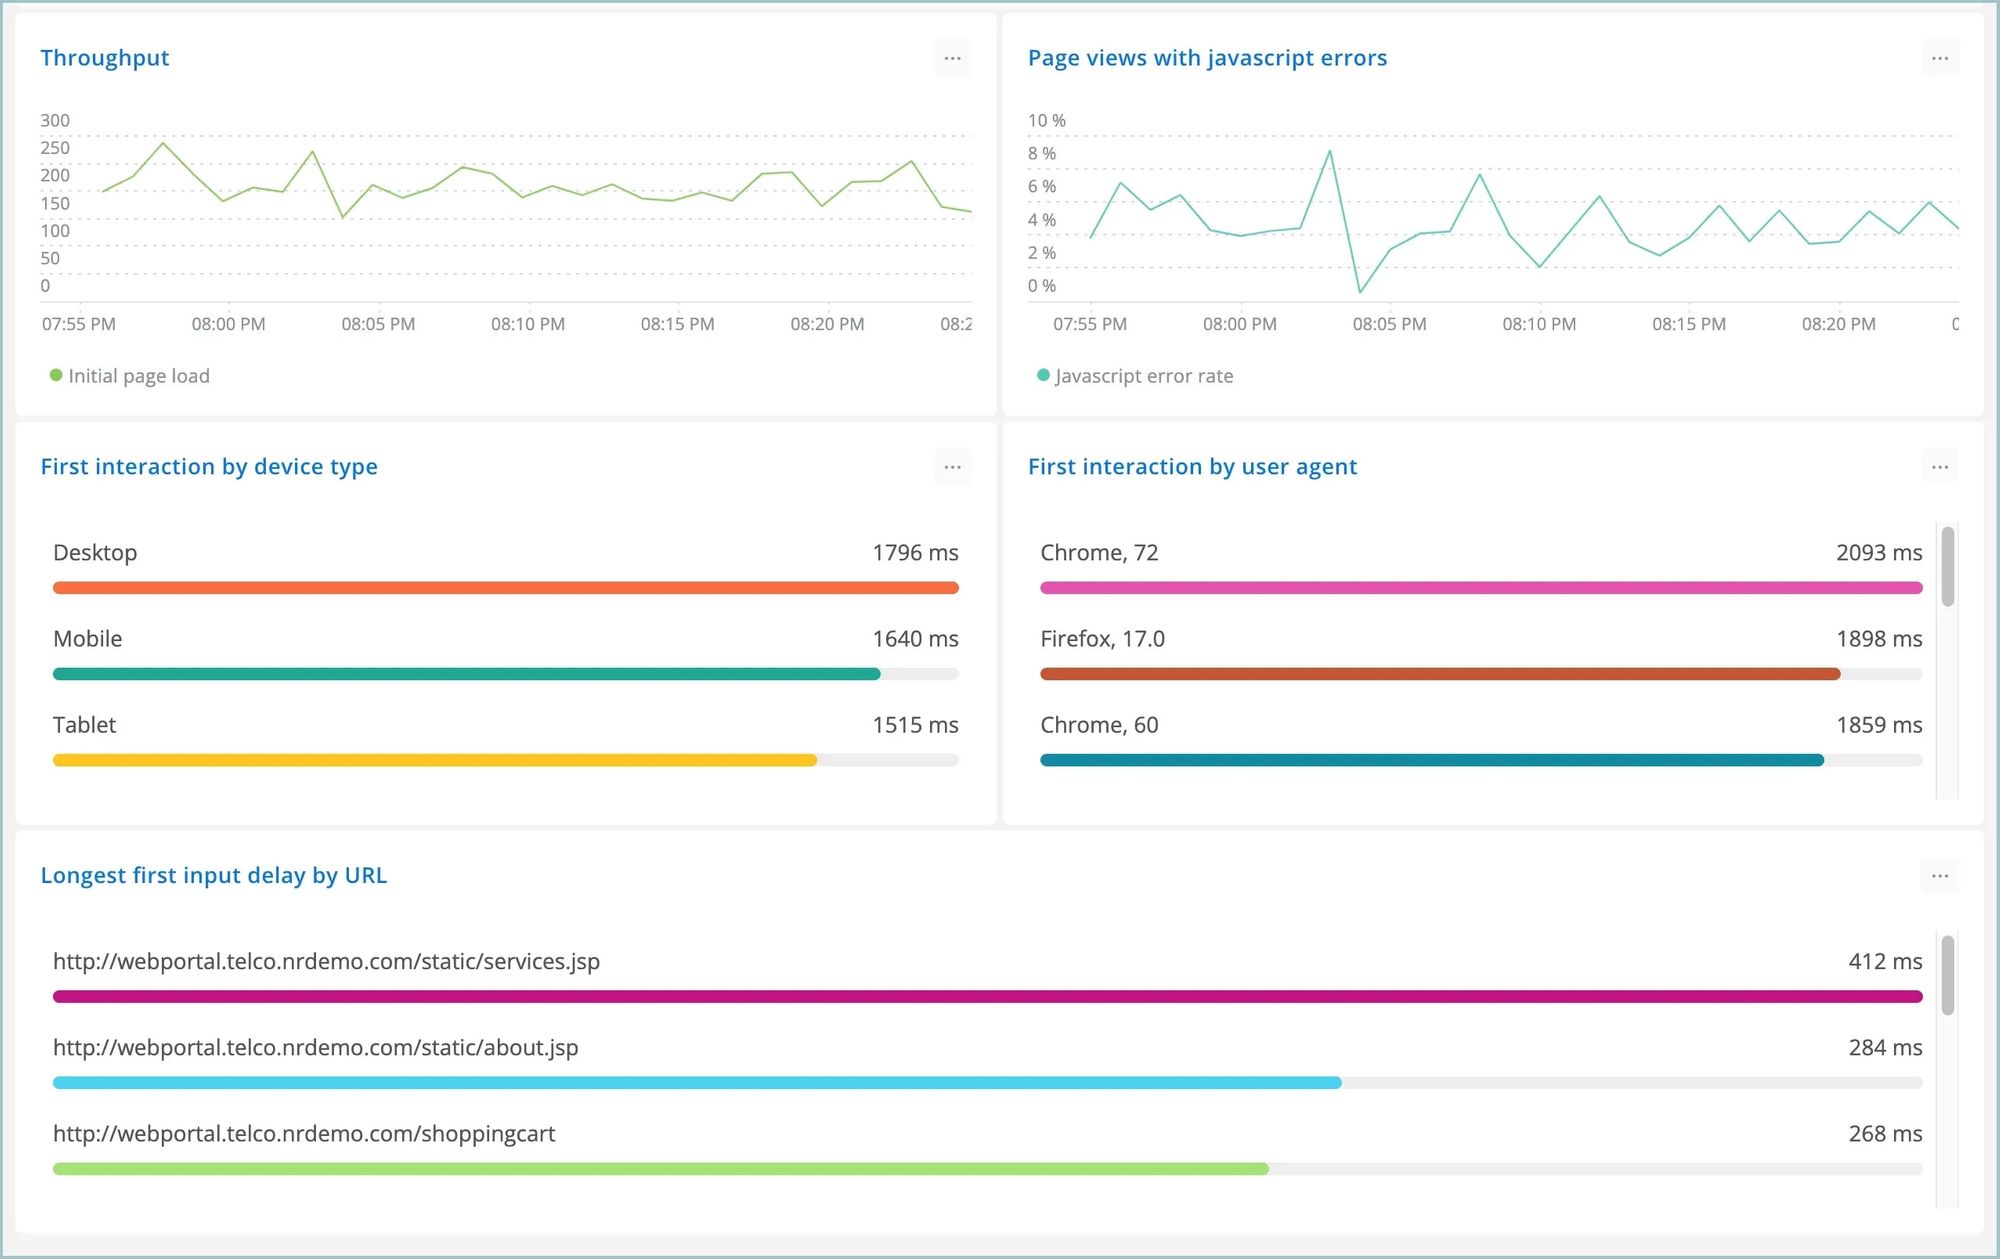
(ii). Datadog real user monitoring(RUM) offers real-time insights for API monitoring, ensuring it works well and stays reliable. It tracks crucial metrics like response time, error rate, and throughput, to optimize API performance and enhance user satisfaction. It provides core web vitals, which helps in understanding the user experience.
Features:
- Receive instant alerts and notifications to address errors promptly and maintain high service reliability.
- Visualize geographical distribution of API requests to optimize infrastructure and deliver consistent performance worldwide.
3. New Relic
New Relic integrates two approaches to API monitoring: Synthetic Monitoring and Real User Monitoring.
(i). New Relic is an application performance monitoring (APM) and observability platform. New Relic Synthetic Monitoring simulates user interactions with APIs to test performance.
New Relic synthetics lets you set up alerts based on metrics such as response time, error rate, or availability for your APIs. You can receive alerts through email, SMS, Slack, or PagerDuty, ensuring prompt action to maintain the health of your APIs.
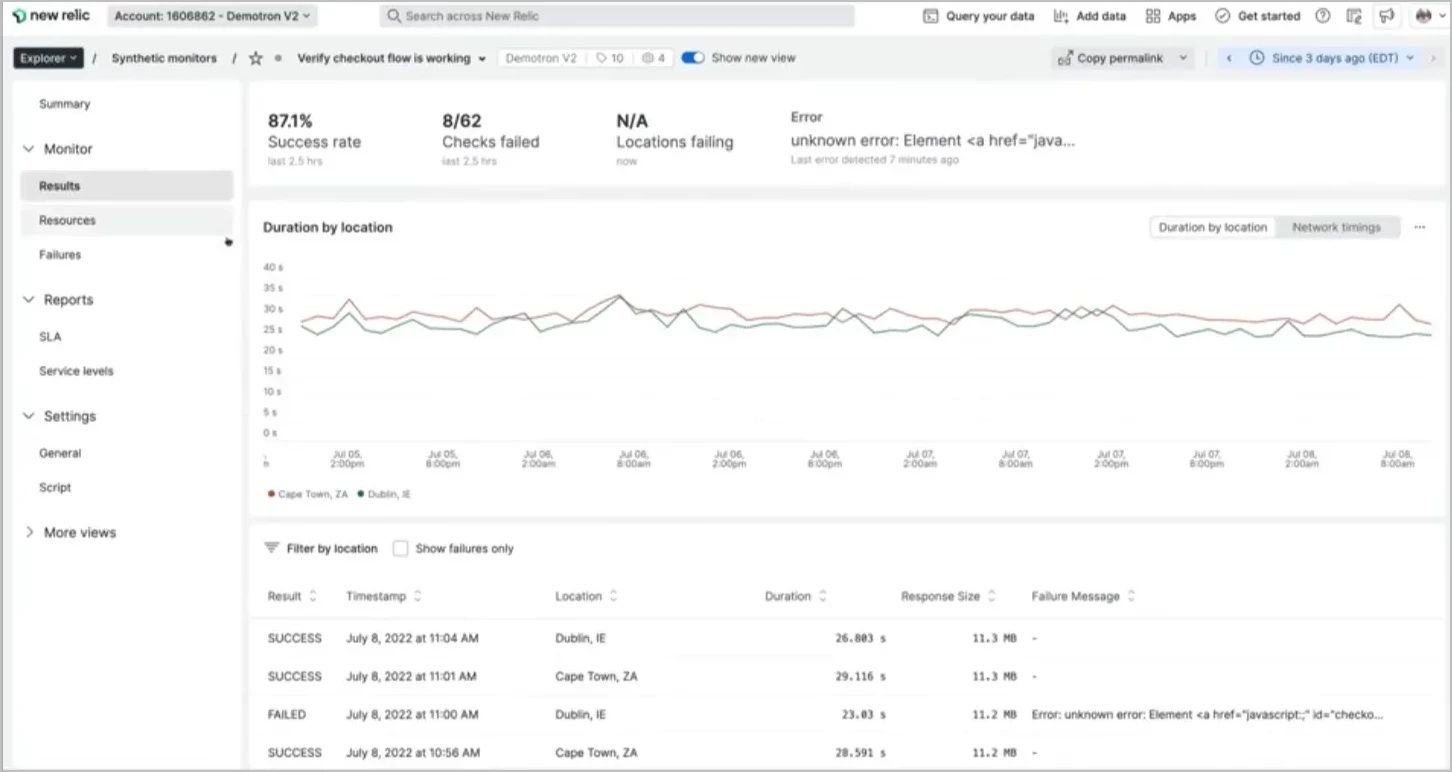
Features:
- Tracks key API metrics such as response times, throughput, and error rates.
- Enables in-depth analysis of individual API calls and their dependencies.
- Customizable alerts for specific performance thresholds to detect and resolve issues quickly.
(ii). New Relic real user monitoring(RUM) offers a more user-centric perspective by providing insights into load times, page rendering, and user interactions. This helps in tracking the performance and responsiveness of API calls that impact these experiences.
New Relic real user monitoring provides insights into how long each user transaction takes, including AJAX and HTTP requests, which directly reflects API performance and responsiveness.
Features:
- Track the geographic location of users accessing APIs, enabling organizations to optimize performance for different regions.
- Detects errors occurring in API requests and triggers alerts based on predefined thresholds to notify users of issues.
4. AppDynamics
AppDynamics provides comprehensive application performance management and analytics across the entire stack. AppDynamics Synthetic API monitoring feature allows you to observe the performance and accessibility of HTTP(s) based APIs.
Through the AppDynamics UI, you can visualize the performance of their API monitoring collections and tasks. You can also create, modify, and delete API monitoring tasks, and view metrics and charts on the dashboards.
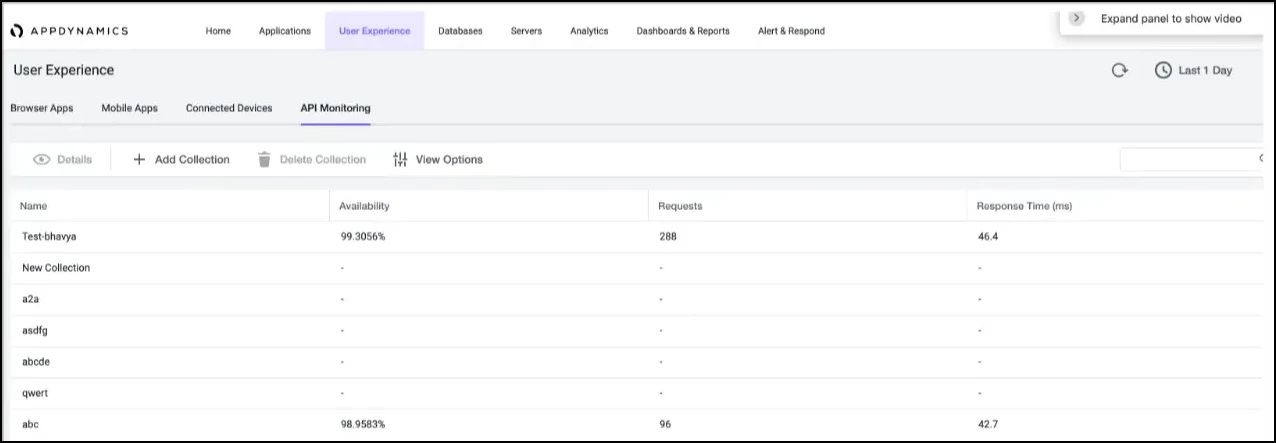
Features:
- Verify API functionality, responses, SLAs, and other parameters.
- Conduct API workflow testing by linking multiple requests together.
- Examine network statistics like wait time, TCP, and DNS resolution times within API calls.
- Receive alerts regarding API uptime and breaches of SLAs.
5. Sematext
Sematext synthetic monitoring ensure that your APIs perform effectively by providing dependable and intuitive monitoring capabilities. It uses waterfall charts to find performance bottlenecks.
Sematext provides continuous 24/7 API monitoring for global visibility, detecting performance issues in real time to prevent outages. It collects custom API metrics, extract data from APIs, visualize API metrics, and create alert rules.
Features:
- API Uptime Monitoring feature monitors API, tracks core web vitals, and checks the response of your APIs from different locations worldwide.
- Identify API time-outs and monitor all critical API endpoints.
- Ensure sensitive data protection by securely monitoring password-protected pages and APIs.
6. Moesif
Moesif API Analytics offers user-centric observability that delivers understanding into how real users interact with your APIs and applications, unlike synthetic tests. It monitors the user experience and provides automatic alerts for API performance issues, security threats, and more.
Moesif offers two notification systems: Alert Rules for abnormal metric behavior or threshold breaches, and User Notifications for customers showing specific behaviors.
Features:
- Track important metrics with prebuilt dashboards based on best practices.
- Gain insights into API usage and user behaviors using advanced, high-dimension analytics.
- Send notifications through various channels: Email, SMS, Slack, PagerDuty, and Webhook.
7. Postman
Postman API Monitoring enable you to check your API's responses, availability, and how well it performs every time it runs, making sure your API stays healthy. It helps you detect issues with your API, such as poor performance, response errors, and outages.
It offers collection-based monitors to track API health and performance, allowing manual or automated runs with customizable retry logic. Once the monitor is active, you will receive alerts for any test failures, enabling you to identify and fix issues before they impact your API's users.
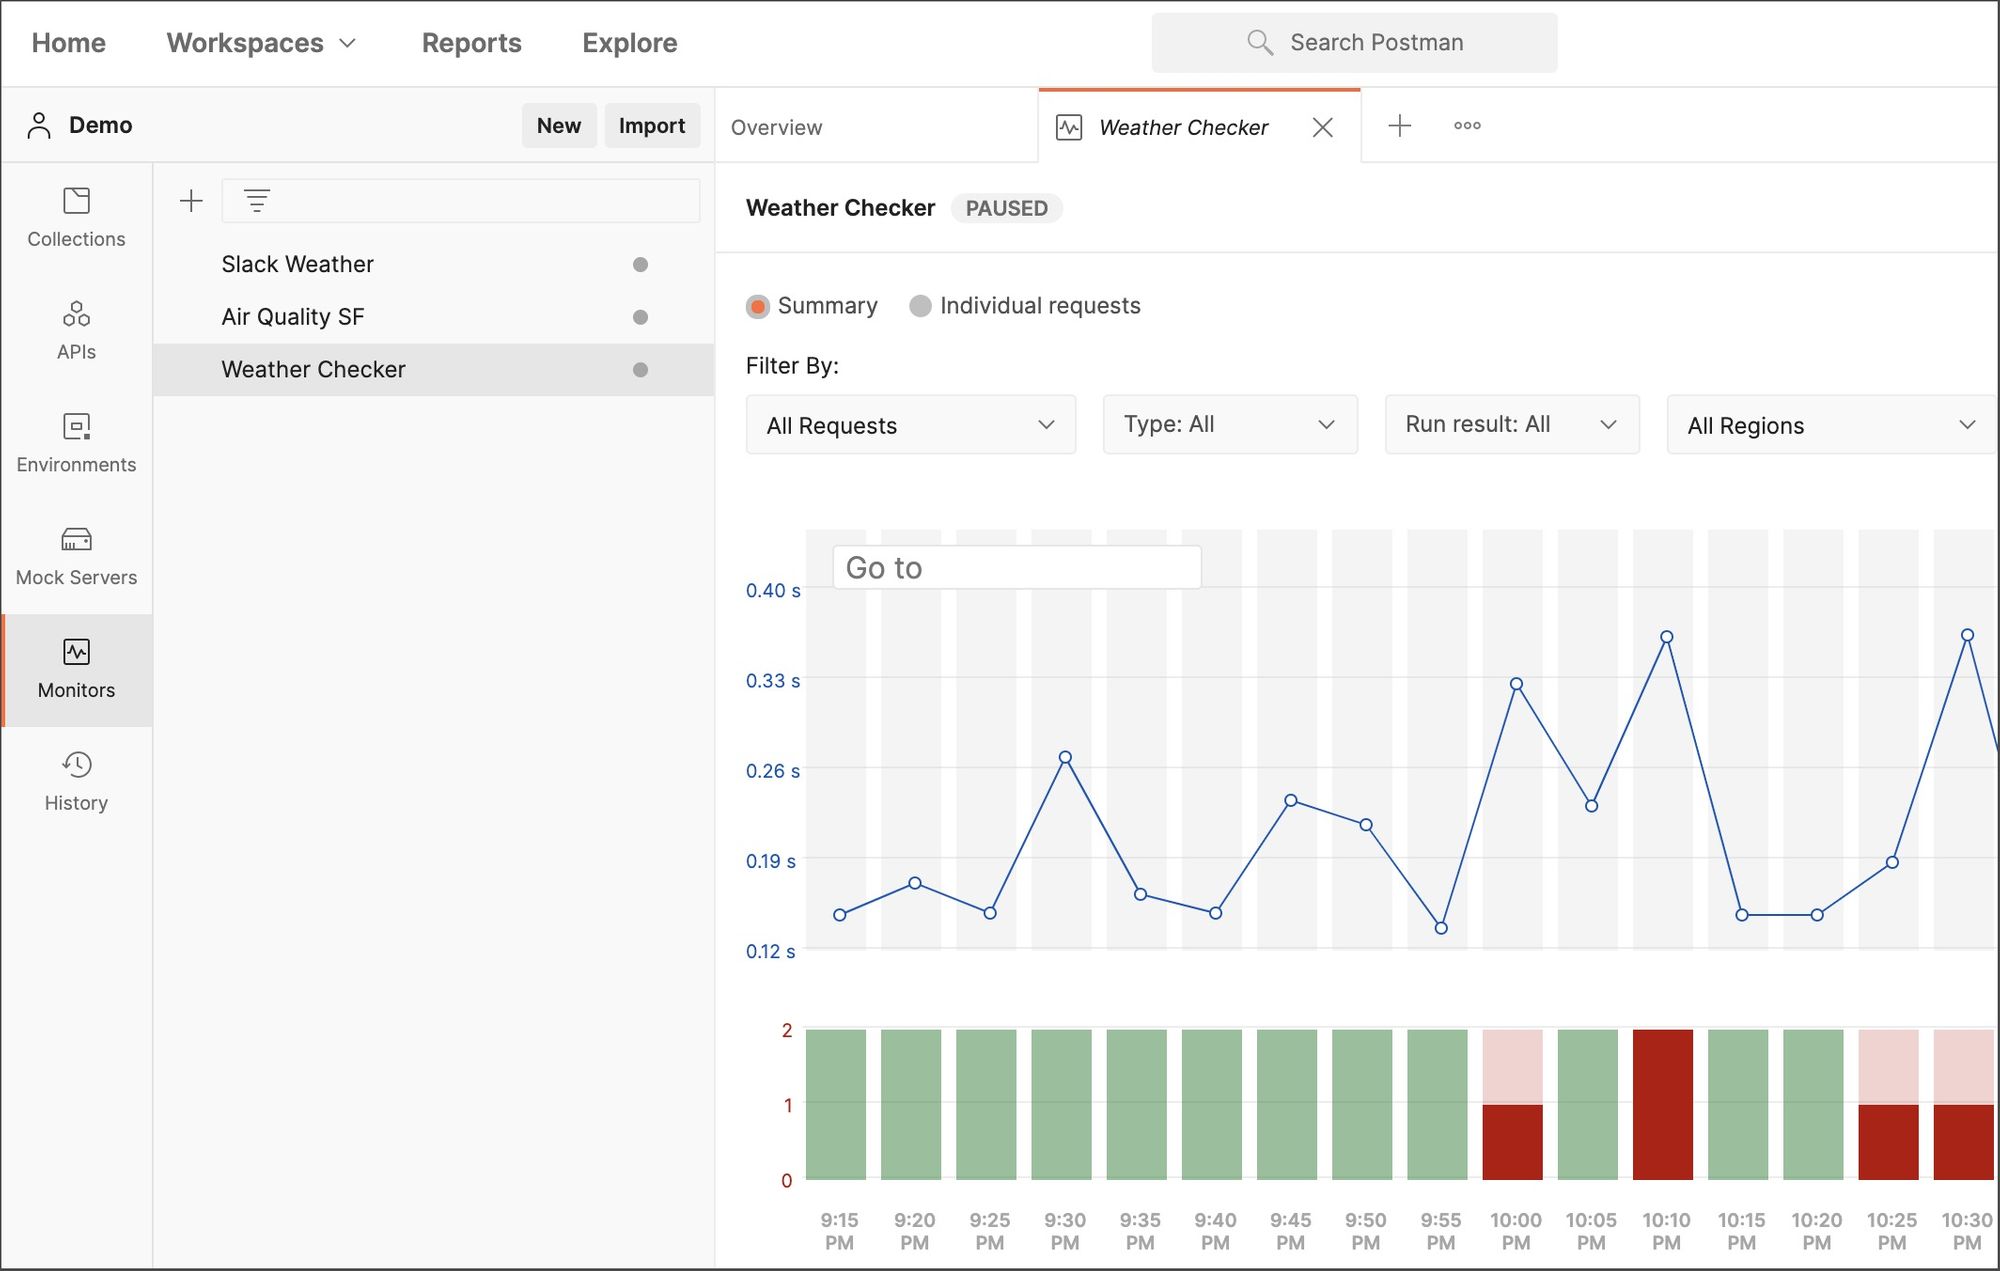
Features:
- Postman's monitoring dashboard provides a clear visual overview of results to quickly identify issues.
- Postman supports monitoring in 6 global regions, ensuring API resilience and availability worldwide.
- Postman API Security allows you to run customizable security checks for vulnerabilities and integrate them into the CI/CD pipeline.
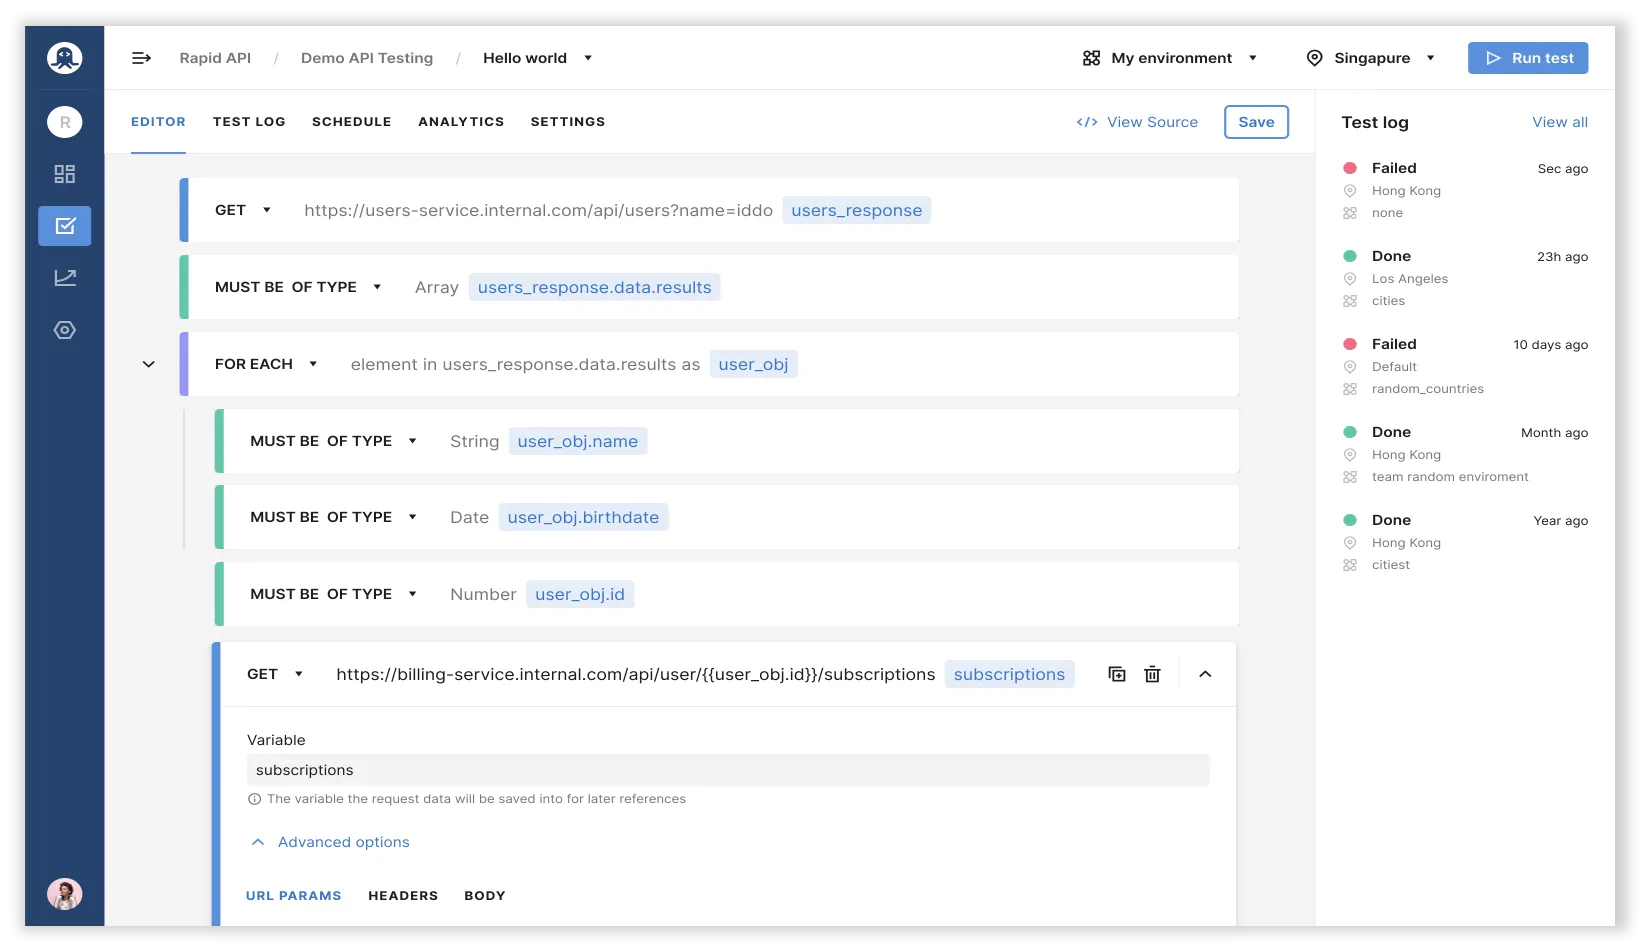
8. RapidAPI
RapidAPI is the largest API hub, providing a comprehensive platform for API monitoring. It allows users to track API popularity scores, average latency, and success rates directly from search results, providing immediate insights into API reliability and efficiency.
RapidAPI monitors API performance by seeing how many requests are made to different APIs and how many are successful.
Features:
- Set up alerts for specific API performance thresholds, Set up alerts for specific API performance thresholds.
- Integrate into CI/CD pipelines, collaborate across teams, and seamlessly connect with RapidAPI Hub and RapidAPI Enterprise Hub.
How to Choose the Right API Monitoring Tool?
- Comprehensive Monitoring Approach: Choose an API monitoring tool that supports all the three approaches, Real User Monitoring (RUM), Synthetic monitoring, and API analytics to ensure comprehensive coverage of API performance. Atatus excels in this aspect.
- API Analytics Focus: If your primary concern is gaining insights into API usage, performance, and trends, prioritize a tool that specializes in API analytics. For example, you can choose tools like Atatus and Moesif.
- Alerting Capabilities: Choose a tool that promptly notifies you of API performance issues or downtime.
- User-Friendly Setup: Choose a tool that is easy to set up and configure, requiring minimal coding or technical skills.
- Accuracy Across Locations: Select the tool that accurately monitors API performance from multiple geographical locations and delivers precise results.
- Flexible Run Options: Prioritize tools offering flexible run options, allowing tests on-demand, scheduled, or event-triggered.
- Pricing: Ensure the pricing model is straightforward and transparent, and choose a budget-friendly option that offers value for money.
Conclusion
To keep track on API performance, focus on key API metrics like response times, error rates, and requests per second. It is crucial to pick tools that match your needs. Additionally, consider factors like uptime, latency, and scalability for a comprehensive monitoring strategy.
Broaden your monitoring strategy beyond just APIs by incorporating synthetic and real user monitoring for your website. When combined for API monitoring, they give you a better picture of how your API is performing.
Atatus stands out as an optimal tool because it combines all these monitoring functions into one platform, and it also provides API analytics making it more effective. It provides budget-friendly pricing plans that prioritize cost effectiveness.
If you are not yet a Atatus customer, you can sign up for a 14-day free trial .
#1 Solution for Logs, Traces & Metrics
![]() APM
APM
![]() Kubernetes
Kubernetes
![]() Logs
Logs
![]() Synthetics
Synthetics
![]() RUM
RUM
![]() Serverless
Serverless
![]() Security
Security
![]() More
More


